


Serviços Personalizados
Artigo
 Inglês (pdf)
 Artigo em XML
 Referências do artigo
Indicadores

Links relacionados
-
 Citado por Google
 -
 Similares em Google
Compartilhar

 Permalink
Water SA
versão On-line ISSN 1816-7950
versão impressa ISSN 0378-4738
Water SA vol.37 no.3 Pretoria Jul. 2011
Characterisation of the inorganic chemistry of surface waters in South Africa
Jan Marten Huizenga*
Department of Geology, School of Environmental Sciences and Development, North-West University, Private Bag X6001, Potchefstroom, 2520, South Africa
ABSTRACT
The main purpose of this study was to determine a simple inorganic chemistry index that can be used for all surface waters in South Africa, in order to characterise the inorganic chemistry of surface waters. Water quality data collected up until 1999 from all sample monitoring stations (2 068 monitoring stations, 364 659 samples) in South Africa were transformed into an Excel dataset and subsequently quality screened using the stoichiometric charge balance, after which 196 570 (41%) of the water analyses could be used. Using an inorganic chemistry index (ICI) a more detailed analysis can be performed. The ICI shows that the surface water chemistry in South Africa is dominated by chemical weathering, chloride salinisation and sulphate contamination. Based on the importance of these factors, primary catchment areas in South Africa can be subdivided into 3 groups, each with their own characteristic water chemistry. The results of this study allowed the development of a ternary diagram in which the 3 factors are represented. This diagram can be used to investigate the variation of the inorganic water chemistry of South African surface waters in time and space.
Keywords: Inorganic water chemistry, inorganic chemistry index, South Africa, surface waters
Introduction
Rivers provide most of the water to South African users (e.g. Day, 2010). Due to climate conditions water is limited and, in addition, pollution caused by urbanisation, mining, and agricultural activities makes freshwater even scarcer (e.g. Walmsley et al., 1999). South Africa has an extensive water monitoring programme in place in which 2 068 monitoring sites in dams and rivers cover the entire country and have been or still are used for collection of inorganic water quality data. This has resulted in the availability of hundreds of thousands (483 892 water samples to be precise) of chemical analyses (up to the year 1999) for the major inorganic chemical species. Water quality data up to 1999 were published on a CD (Water Quality on Disc) by the South African Council for Scientific and Industrial Research (CSIR) in 1999. These data have been used to some extent for water quality studies (e.g., Hohls et al., 2002; Van Niekerk et al., 2009). This study, however, is the first in which the entire dataset is used.
The main purposes of this study were the following:
• To propose a simple, uniform method to characterise the inorganic chemistry for South African surface waters using an inorganic chemistry index, which is a modified version of the pollution index introduced by Pacheco and Van der Weijden (1996)
• To use the inorganic chemistry index by determining differences and similarities between the surface waters of the different primary catchment areas
This study involved the use of the entire water quality dataset available up to 1999. As such, this study also presents on overall overview of the quality of this dataset, something that has not been done before and may be useful for other researchers that would like to use this dataset.
Water chemistry data of South African surface waters
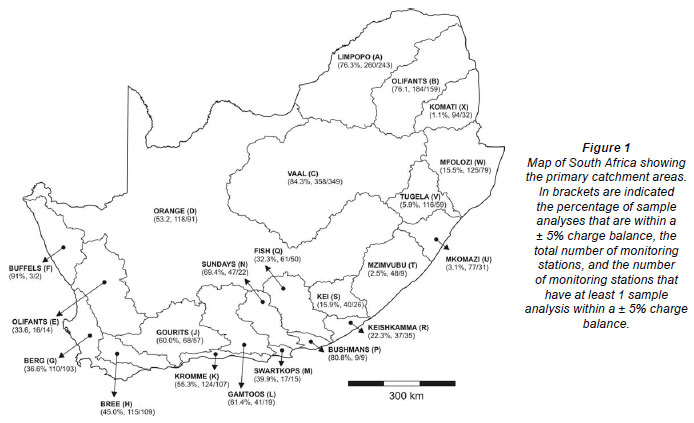
Inorganic water chemistry data were commercially obtained from the CSIR (Environmentek), using the Water Quality on Disc, version 1.0. This CD contains water quality data for the 2 068 sample monitoring sites in South Africa, spread over the different primary catchment areas (Fig. 1). Water samples are collected as part of the national water quality monitoring programme.
The water quality data include pH, total alkalinity (measured as CaCO3 in mg/ℓ) and the concentrations of the following major chemical species (all in mg/ℓ): sodium (Na), potassium (K), calcium (Ca), magnesium (Mg), ammonium (NH4+ ), silica (Si), fluoride (F), orthophosphate (PO43), chloride (Cl), sulphate (SO42-), nitrate (NO3-) and total dissolved solids (TDS). Carbonate and bicarbonate concentrations were calculated from the pH and the total alkalinity using the procedure described in Appelo and Postma (2005). Unfortunately, a follow-up CD with more recent water quality data is not available.
Data preparation
The starting and final dates of sampling and the number of water samples analysed are different for each sample monitoring site and can vary from as early as the 1970s up to 1999. The entire database includes inorganic chemical analyses of 483 892 water samples. The original data file is in a dBase (DBF) format and for the purpose of this study was converted into an Excel format. All data handling described in this paper was done using Excel 2007. The dataset contains numerous discrepancies including blank lines and incomplete chemical analyses.
After removal of the blanks and incomplete analyses, 364 358 chemical analyses remained (Table 1). The quality of this dataset was subsequently screened by calculating the stoichiometric charge balance (SCB), according to the equation (e.g., Appelo and Postma, 2005): SCB (%) = 100 × (∑ [cations] - ∑ [anions]) / (∑ [cations] + ∑ [anions]), where the concentrations (absolute values) of the cations and anions are expressed in the equivalent scale. The speciated charge balance, normally calculated using software such as PHREEQC (Appelo and Postma, 2005), could not be determined due to the large size of the dataset. A check for numerous individual samples, however, showed that the stoichiometric charge balance calculated using Excel was within an acceptable ±5% range of the speciated charge balance using PHREEQC (Appelo and Postma, 2005). The results of the SCB calculations (Fig. 2) illustrate that the majority of the samples show a positive charge balance error. A similar finding was reported by Fritz (1994), who suggested that the positive charge balance error might be related to poor quality alkalinity measurements.

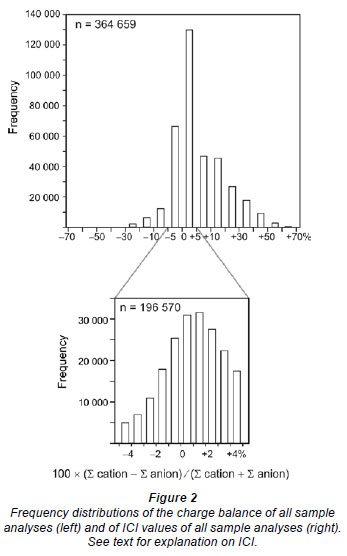
Chemical analyses of which the stoichiometric charge balance was < -5% or > +5% (e.g., Zhu and Andersen, 2002) were removed from the dataset, after which 196 570 (41%) useful chemical analyses remained (Fig. 2, Table 1). Only these data were used in this study. The modified and the raw Excel datasets are available upon request from the author. The percentage of accurate water quality analyses (-5% < SCB < +5%) for the different primary catchment areas indicates that for the primary catchment areas in the south-west and along the east coast fewer than 50% of water quality analyses are accurate (Fig. 1, see Table 2 for details). In particular, primary catchment areas S-X have only a small percentage of reliable water quality analyses (Fig. 1, Table 2).
Limitations
The selection of the samples has some unavoidable limitations. First, there is a geographical bias as the largest densities of the monitoring stations are located in the south-western and north-eastern parts of South Africa (Table 2), with most situated at sites where water quality problems either exist or are to be expected. Second, some monitoring stations contain many data for a long period of time, whereas other stations have limited datasets because sampling was only done for a few years or even less. Third, surface waters affected by acid mine drainage tend to have a large surplus in negative charge due to the fact that the analyses exclude iron and aluminium, which are both expected to be present in relatively high concentrations (e.g., Banks et al., 1997). These analyses were excluded from the dataset (due to SCB screening) although they may actually be correct. Lastly, only water quality data before 2000 are available; an update of the Water Quality on Disc with more recent data does not exist. For the purposes of this study, however, these limitations either did not have a significant impact on the results, or could be dealt with, as will be discussed in the relevant sections to follow.
Water chemistry of surface waters: controlling factors
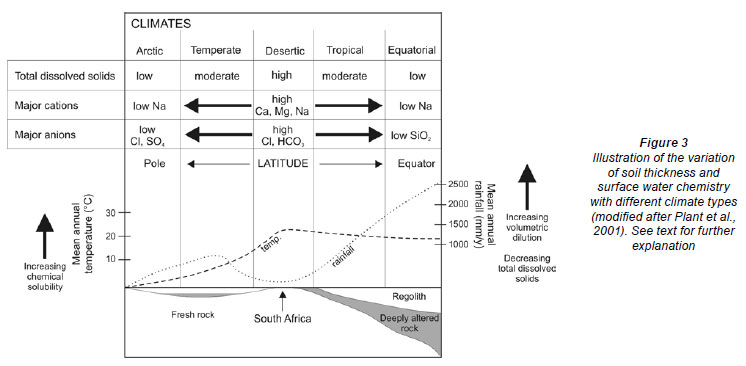
The inorganic chemistry of South African rivers is, to a large extent, controlled by chemical weathering of rocks (Bluth and Kump, 1994) due to the poorly-developed, thin soil cover (Fig. 3) (Laker, 2000). Chemical weathering of rocks releases bicarbonate ions as a result of incongruent and congruent silicate and carbonate weathering reactions (e.g., Bowser and Jones, 2002; Appelo and Postma, 2005).
Incongruent silicate weathering is characterised by the following generalised reaction:
Si-mineral + H2O + CO2
= residue + cations + HCO3- ± H4SiO4
where the solid residue is in most cases a clay mineral such as smectite or kaolinite (e.g., Bowser and Jones, 2002) depending on which silicate mineral is exposed to chemical weathering and the degree of chemical weathering (e.g., Bowser and Jones, 2002) which takes place. Carbonate weathering is illustrated by the following congruent dissolution reaction of calcite:
CaCO3 + H2O +CO2 = Ca2+ + 2HCO3-
These reactions show that bicarbonate and cations such as Ca and Mg are mainly derived from mineral weathering, whereas chloride, sulphate, nitrate and phosphate have alternative sources (Appelo and Postma, 2005). The release of bicarbonate in the weathering reactions results in a typical pH of South African surface waters of between 8 and 8.5 (White et al., 1999). The semi-arid climate in South Africa, i.e. the low rainfall and high evaporation rates, results in an increase of organic chemical species in the water (Fig. 3, e.g., Plant et al., 2001), in particular the conservative ions.
Correspondence analysis
Correspondence analysis was applied for the entire dataset (196 570 samples) using the software XLSTAT, in order to determine the importance of any other factors, in addition to chemical weathering, in determining the surface water chemistry. The application of correspondence analysis is described in detail by Pacheco (1998) and is therefore not repeated here. Correspondence analysis, as applied by Pacheco (1998), can be used for assigning the principal coordinates to specific chemical species that dominate the water chemistry, by evaluating the sympathies and antipathies of the chemical species of the principal coordinates (Pacheco, 1998), together with the relative contribution. It is not necessary to use all the cations and anions in the correspondence analysis as they are linked to each other by the charge balance, i.e., any concentration change of one of the cations must be reflected in an anion concentration change as well (Pacheco, 1998). For interpretation purposes, it is easier to use anions for correspondence analysis as it is easier to assign a specific anion to a specific source, in comparison to cations (Pacheco, 1998).
Correspondence analysis of the entire data set illustrates the importance of chloride, followed by bicarbonate and sulphate, in determining the overall water chemistry (Table 3). The contribution of phosphate and nitrate is relatively minor (relative contribution is 0.001, Table 3). This is obviously a generalised representation that may be different for different regions in South Africa. Therefore, in order to make a detailed regional evaluation, an inorganic chemistry index (ICI) is identified (using charge corrected concentrations):

ICI (%) ≡ 100 x ([Cl-] + 2[ SO24] + [NO-3]
+ 3[PO3-4])/([Cl-] + 2[SO 2-4] + [NO-3] +
+ 3[PO3-4] + [HCO-3])
The index determines the percentage of the overall water chemistry that is derived from all sources excluding rock weathering (Pacheco and Van der Weijden, 1996). This index is modified from the one originally proposed by Pacheco and Van der Weijden (1996) by:
• Including orthophosphate
• Denoting it inorganic chemistry index rather than pollution index
The ICI determines the percentage of the overall inorganic water chemistry that is derived from all sources, excluding chemical rock weathering (Pacheco and Van der Weijden, 1996; Pacheco, 1998; Van der Weijden and Pacheco, 2006). An ICI value of 40% means that 60% of the cations are derived from chemical weathering and 40% are derived from alternative sources (Van der Weijden and Pacheco, 2006). For example, the use of fertilisers will increase the concentrations of orthophosphate, nitrates and sulphate relative to bicarbonate and thus increase the inorganic chemistry index. Acid mine drainage, as another example, will decrease the bicarbonate concentration (as the pH decreases) and, in addition, increase the sulphate concentration, resulting in an ICI close to 100%. In order to evaluate the water chemistry of a specified catchment area one should consider both the ICI value and also the relative contributions of Cl, SO4, NO3 and PO4 towards the ICI value.
Effect of geology on ICI
The ICI can be applied to rivers draining any lithology, except for evaporites (gypsum, halite). Weathering of evaporite minerals will increase the ICI value and thus give the incorrect impression that chemical weathering does not have a great impact on the inorganic water chemistry (Table 4). Fortunately, the exposure of evaporates is rare in South Africa (e.g., Schröder et al., 2008) and this effect can thus generally be ruled out for South African surface waters.
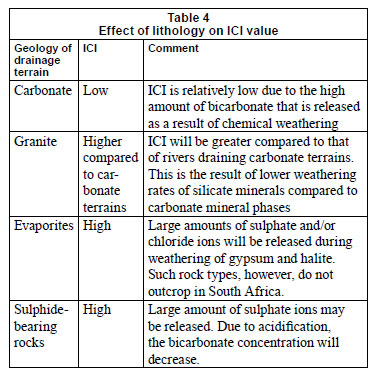
It should be noted that small ICI values do not necessarily imply that that chemical weathering is the only controlling factor determining the water chemistry. Rather, it means that the contribution of inorganic chemical species derived from alternative sources is relatively small compared to the inorganic chemical species that are obtained from chemical weathering. As a consequence the solubility and dissolution kinetics of minerals do have a strong influence on ICI. Minerals in granites and sandstones typically have a slower dissolution rate and lower solubility compared to those that are present in carbonate and volcanic rocks (Table 4) (Appelo and Postma, 2005). This implies that the bicarbonate concentration of rivers draining a carbonate and/or volcanic rock dominated terrain tends to be larger compared to that of rivers draining terrains dominated by sandstones and/or granites (Table 4).
Application of ICI to South African surface waters
Maximum and minimum ICI values need to be established in order to classify the river water chemistry as chemical weathering dominated (from here on referred to as weathering-dominated rivers) or not (from here on referred to as non-weathering dominated rivers), respectively. As discussed in the previous section, these values may be different for different river systems depending on the geology of the drainage areas. Ideally, each river system should thus have specific ICI values for classification purposes, depending on the geology of the drainage area. However, this is an impossible task (and also not practical) if one wants to classify surface waters in a large area or, as in this study, in an entire country, which is characterised by a highly variable geology.
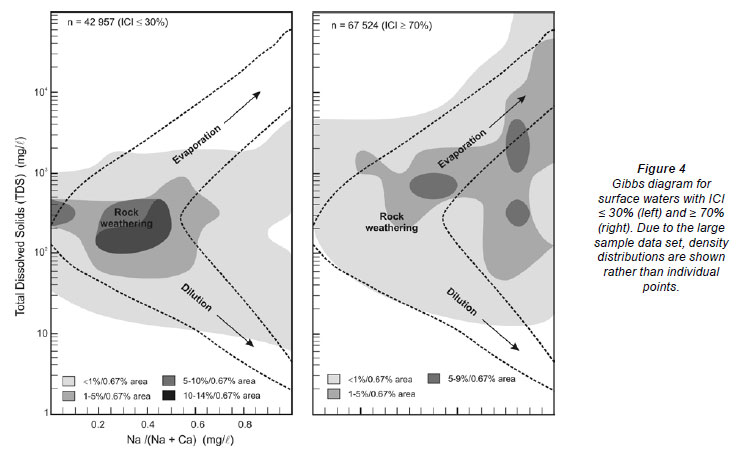
As a starting point, maximum and minimum ICI values, to distinguish weathering-dominated from non-weathering dominated rivers, were established using the dataset from Gaillardet et al. (1999). This dataset comprises chemical data of 62 world rivers of which 53 are weathering-dominated, having a median ICI of 30%, and 9 are non-weathering dominated with a median ICI value of 70%. These ICI values are subsequently used as a maximum (<30%) and minimum (>70%) value to characterise South African surface waters to be weathering- or non-weathering dominated, respectively (Fig. 2). In order to verify the validity of these ICI limits for South African surface waters, rivers with ICI < 30% (42 956 samples, see Table 2) and ICI > 70% (67 524 samples, see Table 2) are displayed in the Gibbs (1970) diagram (Fig. 4, next page).
The Gibbs diagram shows that rivers with ICI values < 30% are concentrated in the 'rock dominance' field in the Gibbs diagram (Fig. 4). Surface waters with ICI values > 70%, on the other hand, are largely scattered in the Gibbs diagram outside the rock dominance field (Fig. 4). The Gibbs diagram shows that the ICI values set for both groups is indeed valid for South African surface waters.
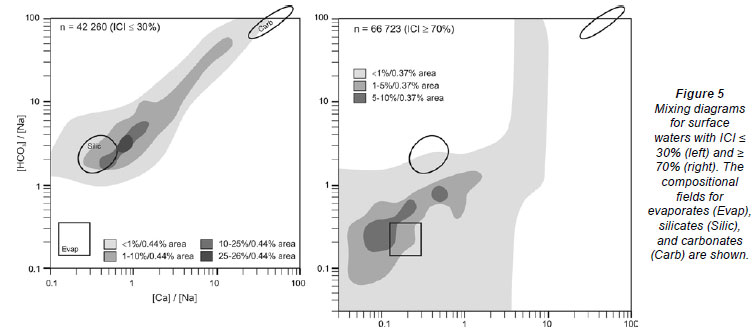
Both groups are also displayed in a [HCO3]/[Na] vs. [Ca]/[Na] mixing diagram introduced by Gaillardet et al. (1999), which shows the different fields of the main rock types: silicate-dominated rocks, carbonates, and evaporates (Fig. 5, next page). Surface waters in which the inorganic chemistry is solely controlled by rock weathering should have values in between the silicate and carbonate end-members. The results illustrate that surface waters with ICI values < 30% are situated between the silicate and the carbonate end-member fields, whereas the surface waters with ICI values > 70% are situated dominantly below the silicate field near the evaporite field (Fig. 5). These results confirm, similarly to the Gibbs classification, that ICI values of < 30% and > 70% are valid for identifying weathering- and non-weathering dominated rivers, respectively. South African rivers that have ICI values falling between 30 and 70% have water chemistries that are affected by chemical weathering and other sources.
Inorganic chemistry status of primary catchment areas
Having established the minimum and maximum values of ICI, it can now be used for the characterisation of the inorganic chemistry of primary catchment areas. As mentioned previously, some monitoring stations may contain a large amount of water sample data for a long period of time, whereas other monitoring stations have limited datasets. This may create a certain bias in determining the ICI value for the primary catchment areas, in particular if the majority of the water samples in a specific primary catchment area were obtained from a few monitoring stations only. In these situations, the inorganic chemistry status of the catchment area is dominated by that of a few monitoring stations.
In this study the following approaches were used to establish the inorganic chemistry status of the primary catchment areas. First, the percentage of samples with ICI > 70% , 30% < ICI < 70%, and ICI < 30% was determined (pie diagrams in Fig. 6). Primary catchment areas that show a ratio of samples with ICI > 70% (S70) / samples with ICI < 30% (S30) > 2 are indicated in dark grey (water chemistry not controlled by chemical weathering) (Fig. 6), the ones that show a percentage ratio between 2 and 0.5 are indicated in light-grey (water chemistry controlled by both chemical weathering and alternative sources), and the ones that show a percentage ratio < 0.5 are shown in white (water chemistry controlled by chemical weathering). Although this method may create biased results as discussed, it might be worthwhile to compare these results with an alternative approach and determine whether this method has some use. The advantage of this method is that is relatively easy to apply.

Secondly, the number of monitoring stations that have more than 50% of water samples with ICI > 70% (referred to as MS70) and that have more than 50% water samples with ICI < 30% (referred to as MS30) was determined. This approach rules out the potential influence of a few monitoring stations that comprise the majority of the water samples within the primary catchment areas. Similar to the first approach, the primary catchment areas are classified according to the ratio MS70/MS30 (Fig. 7). Both approaches produce a similar result; the water chemistry of primary catchment areas A, B, C, D, V, S, T, and X is dominantly controlled by chemical weathering whereas for the remaining (coastal) catchment areas other factors, associated with chloride, sulphate, nitrate and phosphate contributions, prevail.

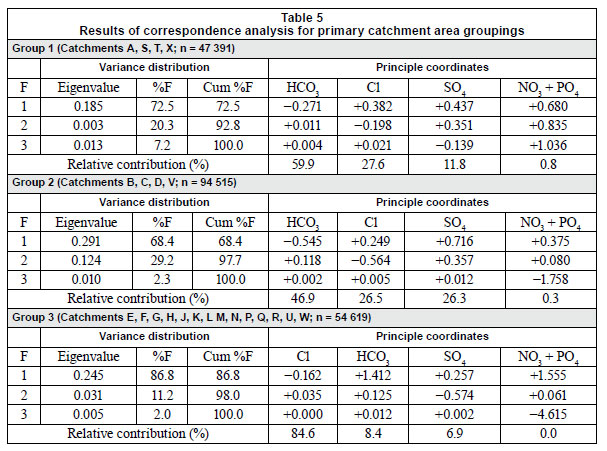
A more detailed analysis can be done by assessing which anion in particular contributes to ICI. The average contribution of chloride, sulphate, and the sum of phosphate and nitrate towards the ICI (Fig. 8) allows the subdivision of the primary catchment areas into 3 groups. Correspondence statistics were applied to the 3 groups and confirms the typical chemistry of the 3 groups (Table 5), as established by the ICI evaluation.

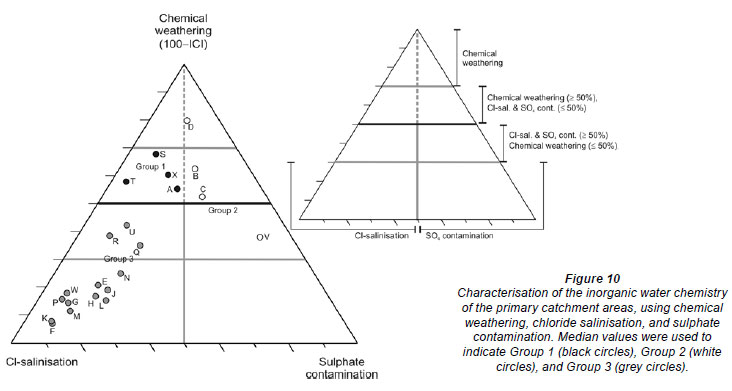
Surface waters in catchment areas A, S, T, and X (Group 1) are dominantly controlled by chemical weathering, followed by other factors that contribute chloride and sulphate (Figs. 8, 9, Table 5). The number of samples with ICI > 70% is relatively small (Fig. 9). Group 1 shows typical total dissolved solid contents (TDS) below 500 mg/ℓ, which increases to TDS values between 500 and 1000 mg/ℓ for samples with ICI > 70% (Fig. 9). There is greater contribution of sulphate towards ICI for samples with ICI > 70%, i.e. greater ICI values are associated with higher sulphate concentrations (Fig. 9). Samples with ICI > 70% show slightly lower pH values (Fig. 9).
The water chemistry of Group 2 (catchment areas B, C, D and V) is, similar to Group 1, dominated by chemical weathering. This group does, however, have significantly more samples with ICI > 70% compared to Group 1. The contribution of sulphate is larger than that of chloride in comparison to Group 1, in particular for samples with ICI > 70% (Figs. 8, 9, Table 5). Group 2 shows typical total dissolved solid contents (TDS) between < 500 and 1 000 mg/ℓ, which increases to TDS values between 500 and 2 000 mg/ℓ for samples with ICI > 70%. Similar to Group 1, ICI values > 70% are associated with higher sulphate concentrations (Fig. 9).
Primary catchment areas E, F, G, H, J, K, L M, N, Q, P, R, U and W (Group 3) show generally high ICI values related to a high chloride contribution (Figs. 8, 9). Both chemical weathering and sulphate contamination have minor contributions towards the water chemistry of Group 3 catchment areas (Table 5). The TDS content is highly variable between < 500 and > 5 000 mg/ℓ. The pH shows a tendency to lower values compared to Groups 1 and 2, indicating that less bicarbonate is released during chemical weathering compared to the catchment areas of Groups 1 and 2. This can be explained by the absence of carbonate rocks in the Cape and Karoo Supergroups, which is the dominant geology of the Group 3 catchment areas.
Elevated chloride concentrations are primarily caused by saline soil and groundwater, as a result of natural (primary) and secondary (anthropogenic) salinisation (e.g., Williams, 1999). Secondary salinisation in South Africa is caused by irrigation (Rabie and Day, 2000) and the removal of natural vegetation (Flügel, 1995). In the coastal catchment areas, seawater intrusion (Bate et al., 2002) and ocean aerosols (Flügel, 1995) may also contribute to chloride salinisation.
Elevated sulphate concentrations can be ascribed to anthropogenic contamination. These include, in particular, acid mine drainage associated with coal and gold mining (e.g., Ackil and Kodas, 2006), atmospheric sulphate caused by air pollution (Rhode et al., 2002; Singer et al., 1999), and the use of fertiliser that contains gypsum. Gold and coal mining are particularly prevalent in the Group 2 catchment areas, i.e. A, B, C, and V. In addition, the location of most of the country's coal power stations in the Mpumalanga Highveld (catchment area B) contributes to increased atmospheric sulphur levels (Tyson et al., 1988), which increases the sulphate concentrations in surface waters as a result of precipitation and fog deposition of sulphate minerals, which are then washed into the rivers (Singer et al., 1993).
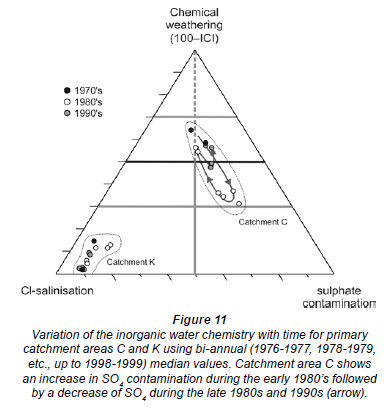
Having established that chemical weathering, sulphate contamination and chloride salinisation are the main controlling factors determining South African surface water chemistry, a ternary diagram can be developed as a visual aid. In this diagram, the apices are defined as chemical weathering: 100 - ICI, Cl-salinisation (Cl contribution towards ICI): ICI × [Cl-] / ([Cl-] + 2[SO42 -]), and sulphate contamination (SO4 contribution towards ICI): ICI × 2[SO42 -] / ([Cl-] + 2[SO42 -]). This ternary diagram was constructed in Excel 2007 using TRI-PLOT (Graham and Midgley, 2000) and can be used to characterise the inorganic water chemistry of South African surface waters (Fig. 10).
The ternary diagram is particularly powerful for monitoring the variation of water quality in time and space (Figs. 10, 11). An example of chemical variation in time is shown in Fig. 11, illustrating that the surface water chemistry of catchment area K remained relatively constant whereas the surface water chemistry of catchment area C has changed significantly between the late 1970s and the late 1990s.
Conclusions
Based on the evaluation of a dataset comprising close to 200 000 water samples, an inorganic chemistry index (ICI) based on the pollution index introduced by Pacheco and Van Der Weijden (1996) can successfully be applied to South African surface waters. The findings of this study show that the surface water chemistry in South Africa is generally dominated by 3 factors: chemical weathering, chloride salinisation, and sulphate contamination. The ICI, together with the Cl and SO4 contributions towards ICI is, therefore, sufficient to characterise the inorganic water chemistry of South African surface waters. The simplification of the inorganic water chemistry to 3 variables allows the use of a ternary diagram where the apices are defined as chemical weathering, sulphate contamination, and soil salinisation. This diagram can be used to monitor the inorganic chemistry status of the primary catchment areas in time and space. All of the calculations performed in this study do not require advanced software and can be done in Excel.
Acknowledgements
The detailed comments of 2 anonymous reviewers have improved the quality of this manuscript significantly. Financial support from the National Research Foundation is gratefully acknowledged.
References
AKCIL A and KOLDAS S (2006) Acid Mine Drainage (AMD): causes, treatment and case studies. J. Clean. Prod. 14 1139-1145. [ Links ]
APPELO CAJ and POSTMA D (2005) Geochemistry, Groundwater and Pollution (2nd edn.). AA Balkema, Rotterdam. 649 pp. [ Links ]
BANKS D, YOUNGER, PL, ARNESEN R-T, IVERSEN ER and BANKS SB (1997) Mine-water chemistry: the good, the bad and the ugly. Env. Geol. 32 157-174. [ Links ]
BATE GC, WHITFIELD AK, ADAMS JB, HUIZINGA P and WOOLDRIDGE TH (2002) The importance of the river-estuary interface (REI) zone in estuaries. Water SA 28 271-279. [ Links ]
BLUTH GJS and KUMP LR (1994) Lithological and climatologic controls of river chemistry. Geochim. Cosmochim. Acta 58 2341-2359. [ Links ]
BOWSER CJ and JONES BF (2002) Mineralogical controls on the composition of natural waters dominated by silicate hydrolysis. Am. J. Sci. 302 582-662. [ Links ]
DAY J (2010) Rivers and wetlands. In: Strydom HA and King ND (eds.) Environmental Management in South Africa (2nd edn.). Juta Publishers, Cape Town. 842-867. [ Links ]
FLÜGEL WA (1995) River salinisation due to dryland agriculture in the Western Cape Province, Republic of South Africa. Environ. Int. 21 679-686. [ Links ]
FRITZ SJ (1994) A survey of charge-balance errors on published analyses of potable ground and surface waters. Ground Water 32 539-546. [ Links ]
GAILLARDET J, DUPRÉ B, LOUVAT P and ALLÈGRE CJ (1999) Global silicate weathering and CO2 consumption rates deduced from the chemistry of large rivers. Chem. Geol. 159 3-30. [ Links ]
GIBBS RJ (1970) Mechanisms controlling world water chemistry. Science 170 1088-1090. [ Links ]
GRAHAM DJ and MIDGLEY NG (2000) Graphical representation of particle shape using triangular diagrams: an Excel spreadsheet method. Earth Surf. Proc. Land. 25 1473-1477. [ Links ]
HOHLS BC, SILBERBAUER MJ, KÜHN AL, KEMPSTER PL and VAN GINKEL CE (2002) National water resource quality status report: Inorganic chemical water quality of surface water resources in SA - The big picture. Report No. N/0000/REQ0801, Institute for Water Quality Studies, Department of Water Affairs and Forestry, South Africa. [ Links ]
LAKER M (2000) Soil resources: distribution, utilization, and degradation. In: Fox R andRowntree K (eds.) The Geography of South Africa in a Changing World. Oxford University Press, Cape Town. 326-360. [ Links ]
PACHECO FAL (1998) Application of correspondence analysis in the assessment of groundwater chemistry. Math. Geol. 30 129-155. [ Links ]
PACHECO FAL and VAN DER WEIJDEN CA (1996) Contributions from water-rock interactions to the composition of groundwater in areas with sizeable anthropogenic input. A case study of the Fundão area, central Portugal. Water Resource Res. 32 3553-3570. [ Links ]
PLANT JD, SMITH D, SMITH B and WILLIAMS D (2001) Environmental geochemistry at global scale. Appl. Geochem. 16 1291-1308. [ Links ]
RABIE MA and DAY JA (2000): Rivers. In: Fuggle RH and Rabie MA (eds.) Environmental Management in South Africa (1st edn., 3rd impression). Juta Publishers, Cape Town. pp. 647-668. [ Links ]
RHODE H, DENTENER F and SCHULZ M (2002): The global distribution of acidifying wet deposition. Environ. Sci. Technol. 36 4382-4388. [ Links ]
SCHRÖDER S, BEKKER, A, BEUKES NJ, STRAUSS H and VAN NIEKERK HS (2008) Rise in seawater sulphate concentration associated with the paleoproterozoic positive carbon isotope excursion: evidence from sulphate evaporites in the ~2.2-2.1 Gyr shallow-marine Lucknow Formation, South Africa. Terra Nova 20 108-117. [ Links ]
SINGER A, KIRSTEN WFA and BUHMANN C (1999) A proposed fog deposition mechanism for the formation of salt efflorescences in the Mpumalanga Highveld, Republic of South Africa. Water Air Soil Pollut. 109 313-325. [ Links ]
TYSON PD, KRUGER F and LOUW CW (1988) Atmospheric pollution and its implications in the Eastern Transvaal Highveld. South African National Scientific Programmes Report 150. CSIR, Pretoria. [ Links ]
VAN DER WEIJDEN CH and PACHECO FAL (2006) Hydrochemistry in the Vouga River basin (central Portugal): Pollution and chemical weathering. Appl. Geochem. 21 580-613. [ Links ]
VAN NIEKERK H, SILBERBAUER MJ and HOHLS BC (2009): Monitoring programme revision highlights long-term salinity changes in selected South African rivers and the value of comprehensive long-term datasets. Environ. Monit. Assess. 154 401-411. [ Links ]
WALMSLEY RD, WALMSLEY JJ, MZURI CONSULTANTS, SILBERBAUER M and DEPARTMENT OF WATER AFFAIRS AND FORESTRY (1999) Freshwater Systems and Resources. National State of the Environment - South Africa. Department of Environmental Affairs and Tourism, Pretoria. URL: http://www.environment.gov.za/enviro-info/sote/nsoer/issues/water/index.htm (Accessed 20 March 2011). [ Links ]
WHITE AF, BULLEN TD, VIVIT DV, SCHULZ MS and CLOW DW (1999) The role of disseminated calcite in the chemical weathering of granitoid rocks. Geochim. Cosmoch. Acta 63 1939-1953. [ Links ]
WILLIAMS WD (1999) Salinisation: A major threat to water resources in the arid and semi-arid regions of the world. Lakes Reservoirs: Res. Manage. 4 85-91 [ Links ]
ZHU C and ANDERSEN G (2002) Environmental Applications of Geochemical Modelling. Cambridge University Press, New York. 284 pp. [ Links ]
Received 16 August 2010; accepted in revised form 30 May 2011.
* To whom all correspondence should be addressed. +27182992526; fax: +27182992370; e-mail: jan.huizenga@nwu.ac.za

