


Services on Demand
Article
 English (pdf)
 Article in xml format
 Article references
Indicators

Related links
-
 Cited by Google
 -
 Similars in Google
Share

 Permalink
Water SA
On-line version ISSN 1816-7950
Print version ISSN 0378-4738
Water SA vol.37 n.3 Pretoria Jul. 2011
Options for improving water use efficiency under worsening scarcity: evidence from the middle olifants sub-basin in South Africa
Teresa WalterI, II,*; Julia KloosI; Daniel TsegaiI
ICenter for Development Research (ZEF), University of Bonn, Germany
IICurrent affiliation: Department of Land Use Economics in the Tropics and Subtropics, University of Hohenheim (490d), Wollgrasweg 43, 70593 Stuttgart, Germany
ABSTRACT
Following the political changes in the early 1990s, the South African government introduced a comprehensive reform process for the water sector with the goal of achieving an enhanced and more equitable water management system. This paper analyses the existing water allocation situations and applies a non-linear optimisation model to investigate the optimal intra- and inter-regional allocation regimes in the Middle Olifants sub-basin of South Africa. Economic issues such as efficiency gains related to water transfers are discussed and calculated water price elasticities and estimated water demand functions provide necessary fundamentals for further modelling work. Social and environmental aspects are accounted for by including constant water demands in the model. Results show higher benefits from inter-regional water allocation. Reducing water supply levels to conform to the sustainable water supply policy, it can be shown that although water supply is reduced by approximately 50%, total benefits from water use are only reduced by 5% and 11% for inter- and intra-regional allocation regimes, respectively. These results indicate that alternative water allocation mechanisms can serve as policy instruments to offset the effects of water scarcity.
Keywords: Optimal allocation, water, IWRM, Middle Olifants, South Africa
Introduction
Water is one of the most indispensable of all natural resources; it is essential for human beings, economic development and biodiversity. However, many countries have to face the challenge of rapidly growing water demands, driven by an increasing population and economic growth, linked to urbanisation, industrialisation and mechanisation (King, 2004). The resulting water scarcity is one of the most pervasive natural resource allocation problems faced by development planners. Hence, water resource management seems to have become one of the important political, social and economic issues of the present century and economists face new challenges of growing water demands and changing laws and institutions (Louw, 2002). Nevertheless, it is also recognized that water scarcity not only originates from quantitative or qualitative scarcity, but also from inefficient use and poor management (Dinar, 2003). Therefore, the need for efficient, equitable and sustainable water allocation policies is evident and new water management studies aim at investigating innovative strategies to yield more efficient water allocations (Rosegrant et al., 2000; Ringler, 2001).
South Africa is one of many countries in the world experiencing water shortages. The increasing competition between water users, decreasing water supply levels and the high and ever mounting demand for freshwater are some of the major problems South Africa is facing (Hassan and Crafford, 2006). Consequently, current water uses are exceeding sustainable natural availability and groundwater is being mined (Conradie, 2002). As a response to this severe problem, the South African Government introduced the National Water Act (NWA; Act No. 36 of 1998), promoting an integrated and decentralised water resource management approach. The new law emphasizes the importance of economic efficiency, environmental protection, equity and the empowerment of people (Hassan and Crafford, 2006). This requires water managers and policymakers to have a thorough understanding of the economic values of water and its various uses as well as powerful information systems that integrate hydrological, economic and social dimensions of water supply and demand within the framework of an integrated water resource management (IWRM) system (McKinney et al., 1999). There has been growing national interest and recognition of the role that market-based approaches can play in facilitating and improving water demand management (Howe et al., 1986). This includes information and knowledge on water-use efficiencies and the value of water in its different uses, price elasticities of water demand, as well as necessary institutional and political settings. Nevertheless, information in this regard hardly exists, and it is a challenging undertaking to achieve sustainable and efficient water management. Institutions are usually lagging far behind the need for more appropriate policies, and analytical tools to provide water resource management agencies with guidelines to introduce a feasible integrated water resource management approach are lacking (Louw, 2002).
This paper aims to model water allocation mechanisms in the Middle Olifants area. After the political changes of the last decade, reforms in the water sector led to improved water management and provided the legal framework for water transfers between different water users. The study analyses the hypothetical effects of water transfers between the most important water users (households, mining and irrigated agriculture) employing water demand functions, which are based on primary data for large-scale agriculture and the mining sector and on secondary data for urban households. The analysis takes place at the sectoral level and discusses economic issues such as efficiency gains related to water transfers. Calculated water price elasticities and estimated water demand functions provide necessary fundamentals for further modelling work. Although this approach is based on economic theory, social and environmental aspects are accounted for but treated as constants. This is unfortunately a shortcoming of the model as it does not allow for a full reflection of the complex interactions between the efficient use of water and the environmental and social impacts of water allocations based on market mechanisms. This paper is organised as follows: the consequent sections present some background information on the study area, the objectives of the research and a summary of relevant literature. After presentation of the conceptual framework outlining the basic structure of the model, demand coefficients and the final model structure are elaborated in the subsequent section. In the last section, the main results are presented and conclusions are drawn.
Background and objectives
National Water Act
There are 2 main new Acts, the Water Services Act and the National Water Act (NWA), which have brought essential transformations to the South African water sector (Nieuwoudt et al., 2004). The Water Services Act (1997; Act No. 108 of 1997) guarantees the right to a basic amount of drinking water and sanitation services, which obliges all governmental levels to assure the provisions of drinking water and basic sanitation services (Republic of South Africa, 2002). The NWA provides the legislative framework for the management of water as a national resource, an improved integration of groundwater and surface water as well as a better water quality and quantity management. The new law identifies sustainability and equity as central principles (Republic of South Africa, 1998), and it identifies the Department of Water Affairs and Forestry (DWAF), now re-named as the Department of Water Affairs (DWA), as the custodian of the country´s water resources, and requires a decentralised water resource management system to be developed at the catchment level (DWAF, 2002).
To fulfil the objectives of efficiency, equity and sustainability, it sets the following priorities in water allocation:
• Provision of the 'Reserve', which consists of two parts: the 'ecological Reserve' and the 'basic human needs Reserve'
• Meeting water needs for international rights and obligations; actions to be taken to meet projected future water needs; and water use of strategic importance: (e.g. power generation)
• Meeting the needs of the general social and economic uses
Furthermore, it acknowledges the possibility of temporary transfers of water entitlements and therefore creates the legal framework for water markets as allocation strategies. As the Act emphasizes decentralised water management, water management areas (WMAs) have been established. Catchment management agencies (CMAs) are to be established in all 19 WMAs to delegate water resource management planning to the regional or catchment level ensuring participation of local communities. For each WMA, the amount of water reserved for prioritised needs ('Reserve') is determined by the National Department of Water Affairs (DWA).
The amount set aside for the 'basic human needs Reserve' is determined through the implementation of the national Free Basic Water (FBW) policy guaranteeing access to water for basic human needs (25 litres per capita per day), as water is formally recognised as a human right in the South African Constitution. This conforms to the global policy where the United Nations declared water as a human right in July 2010. However, the member states did not agree on any binding quantity of water to be secured.
General social and economic uses constitute actual water demands of the various water users in South Africa, such as industries, agriculture, services and households as well as the environment. As the water resource development potential has reached its limits in many WMAs, the option of an applicable water demand management approach needs to be explored. According to Hassan and Farolfi (2005) water allocation decisions are currently made on the basis of limited information derived from water users´ behaviour in the different economic sectors. For the achievement of an improved water demand management, the South African Government has so far addressed important administrative approaches like water user registration and licensing processes. A market-driven approach with the aim of benefit maximization from water use, based on the economic valuation of water, would further support more efficient and sustainable water use. This study explores the role of economic instruments in improved water management.
Study area
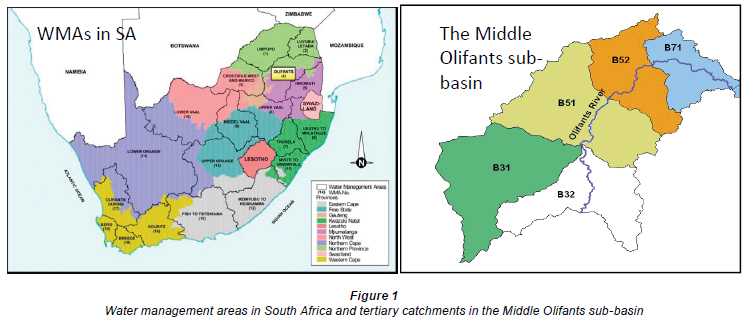
The Middle Olifants (MO) sub-basin (see Fig. 1) is located in the Olifants basin, which is the third most water-stressed basin in South Africa. Based on hydrological features, the MO is sub-divided into 5 tertiary catchments.
The Middle Olifants sub-basin, with an area of 22 550 km2, is home to 60% of the total Olifants basin population. In cooperation with the Water Research Commission (WRC) it was selected as a pilot study area due to the growing competition between water users, its prevailing severe overuse of water resources, and imbalanced water distribution. Water demands are already at their peak for consumption and production purposes. Table 1 shows that water requirements are exceeding availabilities, resulting in a water imbalance in the different sub-basins. At around 500 mm/a, rainfall is very low and over-abstraction of groundwater resources has already led to the lowering of groundwater levels in the whole study area (DWAF, 2003).

The Middle Olifants has a predominantly rural character with scattered formal and informal villages; many of them located in the former homeland areas (DWAF, 2003) where households are still disadvantaged in terms of access to communal services, education and employment. Main water users in the area comprise urban and rural households, large-scale agriculture and the mining industry. Most households are historically disadvantaged and live in rural areas with limited access to water. In Limpopo, which is the province containing the largest share of the Middle Olifants, 15% of the households are classified as poor - having a household income of less than ZAR800 per month (StatsSA, 2007). About 20% of the population is not yet being served by free basic water (DWA, 2010).
Several large-scale irrigation farmers produce for the world market and use high volumes of water (Levite et al., 2002). Although the physical infrastructure of several small-scale irrigation projects exists, most of these were not in operation at the time of data collection and did not demand significant amounts of water. Furthermore, major backyard irrigation at the level of single households hardly exists and was not considered in the analysis.
Objectives
This paper presents a first attempt to provide a modelling framework for the determination of sectoral water demands under different water supply regimes. The study focuses on optimal water allocation levels in the 3 principal competing water user sectors, namely, large-scale irrigation, mining, and domestic use, with the objective of maximising total benefits from water use. For the rest of this paper use of the term 'domestic sector' will refer to urban households. Water requirements of rural households will be considered within the 'basic human needs Reserve' as these households are not using more water than is required for basic human needs. For the model this implies that ecological requirements and basic human needs are treated as constant and are subtracted from total water availability.
The specific objectives of the analysis include:
• Identification of water demand functions and water price elasticities for the large-scale agricultural sector, urban households and the mining sector. For rural households no demand function can be determined as, based on the data collected, rural households do not consume more than 25 litres per capita per day (that is, the basic human needs), which are provided for free. This amount of water corresponds to the 'basic human needs Reserve' of the NWA (1998) and is considered in the modelling framework as a constant. This means that only urban households are included in the allocation decision, while water used by rural households is fixed and will always be guaranteed.
• Analysis of alternative allocation mechanisms, while maximising total benefits from water use. Equity and sustainability issues as addressed by the NWA and its prioritisation approach limits water allocation to a sustainable amount, considering basic human and ecological needs.
• Impact analysis of policy interventions on water demand and allocation structures.
Expected outputs include information on the efficient use of water through water transfers among the 5 tertiary catchments in the Middle Olifants sub-basin and the 3 economic sectors therein. Results will provide support for future water management and decision making alternatives regarding water allocation exploring several scenarios applicable to the study area. However, the authors would like to acknowledge that water quality aspects and environmental externalities that might accrue through water transfers are not considered in the present analysis. Reasons for this omission lie in data and time constraints, leaving room for future research.
Literature review
Due to the deteriorating water scarcity situation and the subsequent water allocation problems, the water management focus has seen a paradigm shift from supply management (mainly through the increase of water availability via water supply infrastructure and other technical solutions) to demand management (through improved technologies, incentives, re-design of tariffs). Several studies have dealt with optimal water allocations in different regions of the world. They differ in the type of data used, applied methods and biophysical factors included.
McKinney et al. (1999) provide a good overview of market valuations of water uses applied in different studies. Booker and Young (1994) developed a river optimisation model for the Colorado River to identify optimal inter-regional allocations and prices. They find that benefits from water use could be increased by up to 50% solely through market transfers. Rosegrant et al. (2000) developed an integrated economic-hydrologic model for the Maipo River Basin in Chile that does not solely consider water allocation but also takes into account interactions of water allocation and agricultural productivity, non-agricultural water demand and resource degradation. Consequently, the model estimates economic as well as social gains from efficiency improvements of water use. The model consists of nodes and links, representing physical entities and links between these entities. Water sources, water inflows and water demands are modelled, including agricultural, municipal and industrial water demand. With the objective of maximising benefits from water use, water demand and supply are integrated into an endogenous system determining efficient water allocations. Model results show that reallocations to higher water values yield higher benefits from water use, which is driven by differences in the marginal values of water. The model could be improved by including further inputs to agricultural production and using empirically-estimated data on household and industrial water demand rather than using literature-based elasticities.
Louw (2002) developed a methodology to estimate the true value of water in the Berg River water management area in South Africa and evaluated potential impacts of a water market on the efficient utilisation of water. With a positive mathematical programming model, the author developed a spatial equilibrium model to predict the impact of a potential water market. In addition to irrigation, water for urban uses like households and industries is also included. The true value of water in irrigation was found to vary significantly between areas in the basin, with the marginal value of water ranging between zero and 20 ZAR/m3 (ZAR=South African Rand). These differences indicate that significant gains from allocative mechanisms are possible in these areas. Mahan et al. (2002) determined efficient allocation of surface water resources in Southern Alberta, Canada, by employing a standard welfare maximising objective function. They find that intra-regional transfer from low value uses to high value uses yields substantial benefit increases of around 6% compared to the status quo situation. They conclude that efficiency improvements through market pricing are likely to be relatively large.
Rodgers and Zaafrano (2002; 2003) developed an integrated economic-hydrologic water resource simulation-optimisation model for the Brantas Basin in East Java, Indonesia. They estimate municipal water demands using data from a household survey. However, for the estimation of industrial water demands they use average water values and literature-based water demand elasticities, and the agricultural water demand function is based on different studies of rice yields and FAO yield coefficients. The model is able to simulate new infrastructure allowing the analysis of benefits associated with the construction of 2 new dams. Hence, the model not only emphasises water demand management but also considers the supply side. Draper et al. (2003) developed an economic-engineering optimisation model for California. They maximised the economic value of agricultural and urban water uses representing water demands for the year 2020 levels of development, using state survey data. Limitations of the model include the consideration of only 2 economic sectors and environmental regulation could not be modelled accurately. Jenkins et al. (2004) developed a large-scale economic-engineering optimisation model of California's water supply system. Results suggest significant improvements to system operation and water allocations through water transfers and exchanges, conjunctive use, and various operational changes to increase flexibility. The authors show that there is great potential to improve the flexibility and economic performance of the water system and that both water scarcity and scarcity costs can be considerably reduced. However limitations of the model include simplifications of conditions and processes, quality of existing data sets, restrictions imposed by the model, and time constraints.
A holistic model embedding water resources and economic components into a mathematical programming model for the Maipo River Basin in Chile was developed by Cai et al. (2001; 2006) and Cai (2008), building upon the work of Rosegrant et al. (2000). The model optimises water allocation by maximising economic profits from water uses in various sectors and confirmed previous results where welfare gains could be reached through reallocations to high value uses. In West Africa, Ahrends et al. (2008) looked at coupling hydrological-economic modelling for optimising irrigation in West Africa while Bharati et al. (2008) used a dynamic coupling of economic and hydrological modelling to explore conjunctive irrigation water use in the Volta basin.
All of the above studies concluded that potential gains in the use value of water could be obtained through the hypothetical introduction of water markets which lead to improved water use efficiencies. This study aims to contribute to present literature by using an economic model, based on supply figures which are provided by the hydrological model and based on primary data on water demands. Unlike most other studies, which rely on 'literature-based' demand coefficients and other parameters, this study used self-collected data and self-estimated coefficients and elasticities, adding plausibility to model results.
Conceptual framework
Figure 2 presents the conceptual framework of the whole modelling process. Water supply levels as an output of the water resources model (WRM) and water demand coefficients, as the estimated parameters of water demand equations, provide the optimal allocation model (OAM) with necessary parameters. The WRM was provided by DWAF and updated by the project partners at the University of Witten/Herdecke, GmbH, Germany.
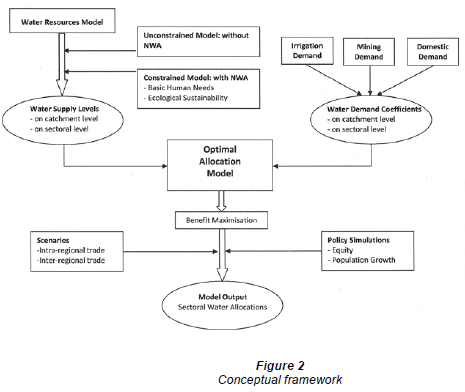
The WRM is a hydrological model based on the modification and further refinements for better operation of the Water Situation Assessment Model (WSAM) (DWAF, 2007), which uses all water demands and available resources in each quaternary catchment and quantifies surpluses and deficits. The time frame of WSAM is based on average annual yield data, accounting for seasonal variations. The calculation of the yield accounting water balance consists of 2 main components: water resource yields and water requirements. Available water yields are not distributed equally between different requirements but rather according to the priorities defined in the NWA (DWAF, 2005).
Respective water supply levels can be modelled in 2 different ways. The first model is unconstrained, neglecting basic human and ecological needs and thus also neglecting the terms under the NWA. In the following, this will always be referred to as policy condition 'without consideration of the NWA'. Results identify benefit gains from water re-allocations under 2 scenarios (see section below).
The second model analyses water allocation levels if available water is reduced according to NWA levels, which are derived from WSAM data by subtracting basic human needs as well as ecological Reserves from total available supply for each tertiary catchment. In the following, this will always be referred to as policy condition 'with consideration of the NWA'. Hence, in the OAM model these reserves are not treated as free variables but are rather entering the model as constants and sustainable water supply levels are results of the WRM, modelled in such a way that it gives priority to environmental flows and basic human needs (rural households). It is important to note that urban and rural households are considered separately within the domestic sector. While for urban water demand, a water demand function was estimated and is thus part of the optimisation process, rural water demand is fixed and thus considered as a constraint of the model. Hence, the provision of water for rural areas does not underlie any efficiency objectives but purely social ones. This mirrors the free basic water policy of the South African Government with the assumption that rural households are provided with the basic amount of water (25 ℓ per capita per day) free of charge and that their water needs do not exceed this rate. Demand coefficients for irrigation, mining and urban domestic households were estimated separately; employing various methods of valuation (see Appendix 1). Water for irrigation is valued by simulating a water demand function via mathematical programming models. Reasons for applying mathematical programming instead of econometric estimation include the fact that farmers are not paying according to water used but according to area irrigated. This makes direct estimation of water demand functions, which are based on quantities of water used at various price levels, generally difficult.
Water user charges and quantity schedules are simulated with an optimisation model in GAMS (General Algebraic Modelling System), maximising farm profits with varying water user charges. Demand functions are obtained by fitting regression equations and point water user charge elasticities are calculated. Water demand in the mining sector is estimated with econometric methods using time-series data. A Seemingly Unrelated Regression (SUR) procedure is applied to estimate cost functions for the 5 mines analysed and water price elasticities and water demand functions are calculated. Using the estimated cost functions, water demands can be derived by varying the water price, holding all other inputs and outputs constant. The valuation of urban domestic water uses allows for a direct estimation of demand functions using an econometric model (see Appendix 1).
Through benefit maximisation, optimal water allocations via water transfers between user sectors and regions can be defined. Various policy simulations give information on possible policy mechanisms to influence optimal water allocation levels, according to equity considerations and future population growth. The model is flexible to explore potential contemporary scenarios proposed by decision makers in South Africa and can provide support in policy decisions with regard to water allocations. The temporal dimension of the model is annual while spatially it is limited to the Middle Olifants sub-basin, with a further sub-division into 5 tertiary catchments (see Fig. 1).
Optimal allocation model (OAM)
Typically prices reflect market scarcity as well as the equilibrium between demand and transportation and supply costs (Spulber and Sabbaghi, 1998). If this is not the case, there is market imperfection and that impedes the market from adjusting to changes in quantities demanded or to changes in costs of supply. Hence, political and institutional mechanisms must be established to ensure an efficient water use. Although the NWA provides the constitutional framework for water markets and technical water research has received priority in the past, little is known about the economics of water use and impacts of alternative water policies (Nieuwoudt, 2000).
The following section analyses gains from water re-allocation among households, irrigation and the mining sector in the Middle Olifants, using a non-linear optimisation model, which is maximising total benefits resulting from water use. As a first step, benefits from water re-allocations under current water uses are analysed; secondly, water availability is reduced according to the NWA and new allocation levels are estimated.
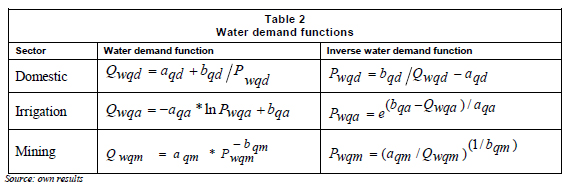
Water demand functions
With a non-linear model, the potential of re-allocation of water entitlements is simulated by deterministic mathematical optimisation. The model consists of defined inverse water demand functions for each water-using sector (see Appendix 1). Table shows the fitted water demand functional forms and their inverse representation; these are the essential elements for benefit calculations in the optimal allocation model. For the domestic sector, a Stone-Geary (reciprocal) function was fitted. For irrigation and mining, a linear logarithmic function and double-log linear function were found to show the best fit, respectively. For all 3 models different functional forms were estimated in STATA and the respective R-squared values were compared (for examples in irrigation, see Appendix 1). Therefore, the various coefficients vary for each tertiary catchment. The coefficients are represented by a and b while the quantity of water demanded is represented by Qw and the price of water by Pw, for tertiary catchments q and water users in the domestic, irrigation and mining sectors represented by d, a and m, respectively. Coefficients for each tertiary catchment are available from the authors on request.
Derived water demand functions for different uses show varying water price elasticities with the most inelastic water demand for households. Table 3 shows water price elasticities for alternate uses for each tertiary catchment calculated (Eq. (1)) with Qw as the water quantity and Pw as the water price:
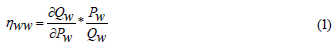
For households and irrigation, elasticities are calculated per tertiary catchment, whereas in the mining sector water price elasticities are calculated for each mine. For all sectors, elasticities are calculated at average consumption levels and prices.
In irrigation elasticities are estimated to be -0.20, -0.19 and -0.18 in catchments B31, B32 and B51, respectively, indicating the weak price-responsiveness behaviour of farmers. Within current price ranges, demand for irrigation water appears to be price inelastic and will only become elastic at much higher price ranges, at around 10 ZAR/m3. The low elasticity estimate may be related to the relatively low average water-user charges attached to irrigation (0.07 ZAR/m3). Given the inelasticity of water demand, limited substitution possibilities for irrigation water, risk aversion of farmers and the low share of water in total costs, increasing irrigation tariffs may not help to substantially decrease quantities of irrigation water used on farms.
Results are comparable to those of other studies using mathematical programming or econometric estimation. One example is the study of Clark et al. (1986), who developed a static linear programming model for determining the short-term demand for irrigation water in the Murrumbidgee Valley in Australia. The authors found elasticities between -0.131 and -0.646 for the lower price ranges. Further examples are Kulshreshtha and Tewari (1991), who calculated derived demand functions for different farms in the South Saskatchewan River Irrigation District in Canada using variable resource price programming. Computed point elasticities at realistic price ranges (-0.05 to -0.73) are far below unity. Moore et al. (1994) estimated water demand equations using Heckman´s estimation procedure. The price of water is proxied by the estimated marginal cost of pumping groundwater and calculated elasticities range from -0.03 to -0.10. More recent studies (Appels et al., 2004; Bontemps and Couture, 2002; Doppler et al., 2002) apply similar methods to different areas and results of inelastic irrigation water demand are similar for all regions.
Households react even less to a water price change, which is reflected in the low water price elasticity of only -0.04. Though results of other comparable studies are mixed and scarce, the dominant finding is that domestic water demand is inelastic (Van Vuuren et al., 2004; Olmstead et al., 2007 (for USA); Gill and Punt, 2010). These results show that increasing water prices hardly affect agricultural and urban domestic water demand so that other political measurements must rather be applied to influence water demands. In the mining sector, water price elasticities are from -0.76 to -0.95, relatively higher than in the agricultural and domestic sector, yet inelastic. The low elasticities in irrigation and domestic uses can be explained by the fact that water is an essential good. Households are less sensitive to water price changes since they are highly dependent on water for their day to day activities. The same is true for irrigation where water is the major input in the production process, while this is relatively not true for the mining sector, where substitution possibilities can be found where water is not the only input and also not a relatively major input as in agriculture.
Model structure
Representative data on water availability is provided by the hydrological model WSAM (DWAF, 1998). Assumptions underlying the OAM include perfectly competitive markets, deterministic water supply and demand, and partial rather than general equilibrium. Our results, based on the assumption of the neo-classical economic theory of perfect market conditions, should be interpreted with caution. We believe that this will form a basis for an appropriate water user charge (tariff) setting, which should be combined with an institutional economic approach to the water scarcity problem.
These assumptions require water to be seen as an economic good, where efficiency aspects are decisive for the allocation between high and low value uses and if necessary the reallocation to high value uses (Moran and Dann, 2008). The model does not consider water quality issues, distribution and transportation costs. Hydrological flows, such as return flows, will not explicitly be considered since they are included in the calculations of the WSAM data, implying that any changes in off-take will lead to changes in return flows. However, model results show that these changes in return flows are marginal and can be neglected. The optimisation model is programmed in GAMS, where the different sets and subsets for catchments q and water uses u, including households, irrigation and mining, are formulated. Further sets contain the parameters of the inverse water demand functions represented as coefficients a and b. The objective function maximises total benefits TB as the sum of the areas under the inverse demand curves (Mahan et al., 2002; Nieuwoudt et al., 2004). Considering households, irrigation and mining, the model can be formulated as:

where:
Fqu (Qw) are the inverse functions for water consumption Qw
Benefits from each water usage u (d, a and m) in each catchment q (B31, B32, B51, B52, B71) can be calculated as the area under the inverse demand functions (see Table 2), from the upper limit Qw to the minimum quantity demanded Qmin at the choke price CP, plus the rectangle from the choke price and the corresponding minimum amount demanded (see Fig. 3). The choke price defines the backstop price, at which quantity demanded becomes exactly zero or approximately zero.
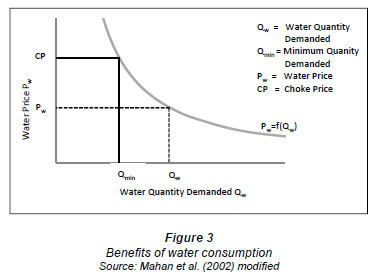
Using equations from Table 2 the choke price at Qmin is calculated and entered into the benefit functions. If the integral of the functional form does not converge, it is necessary to add the rectangle from the choke price and the corresponding minimum amount demanded to the benefit function. Equations 3, 4 and 5, respectively, show the benefit functions for the domestic, irrigation and mining sectors with a and b as the coefficients for the functional forms shown in Table 2.

Since water is not available without limitation, total water availability per catchment Sq represents the major restriction in the model.

where:
u = domestic, irrigation and mining sectors
q = B31, B32, B51, B52, B71
TC = treatment costs for domestic water uses
Distribution losses, which are assumed not to enter into return flows but to simply be sinks, account for 25% (Polokwane Municipality, 2006) in the domestic and agricultural sectors (Tren and Schur, 2000), while they add up to 10% in the mining sector (DWAF, 1998).
Model results
In this section, impacts of alternative allocation mechanisms based on 2 different water availability levels and sensitivity analyses are presented. The allocation mechanisms to be analysed include intra- and inter-regional trade regimes, which will be compared to the status quo situation where current water use will be considered and the NWA is not fulfilled.
Scenario 1: Intra-regional water allocation: Water can only be re-allocated within a tertiary catchment but not between tertiary catchments.
Scenario 2: Inter-regional water allocation: Water can be re-allocated in the whole Middle Olifants, that is, between tertiary catchments.
Besides water quantities, changes in total benefits due to the allocation mechanisms will be analysed. In a second step, simulation scenarios reflecting current policies and future developments are developed.
Simulation 1: Policy-makers may introduce an upper limit to domestic water tariffs to ensure basic water quantities, particularly for low-income and poor households. This is in line with the equity objective of the NWA. However, it should be noted that basic water needs according to the NWA are already assured.
Simulation 2: Policy-makers may set a minimum price for large-scale irrigation farmers to make a first step towards appropriate water pricing and to cross-subsidise the domestic sector.
Simulation 3: Population growth and increased urbanisation in the year 2050: This simulation consists of a prediction of population growth and urbanisation rates based on data from Statistical Services, South Africa.
All simulations are modelled at inter- and intra-regional trade water allocation regimes.
Current water use (2007)
To be able to analyse the impact of re-allocation and changes in allocation based on the fulfilment of the requirements of the NWA, the existing water use of the year 2007 is modelled. Currently, most of the available water (93%) is used by commercial farmers for crop irrigation. Only 4.7% of the water is consumed by urban and rural households and 2.3% by mines. The fact that current water use is highly unsustainable becomes obvious when comparing current demand to sustainable water supply in accordance with the NWA (1998) at the catchment level. A negative balance of about 170 m. m3 per year is witnessed in the Middle Olifants sub-basin (see Fig. 4), implying that groundwater is mined and water is used unsustainably. All catchments, with the exception of Catchment B71, exhibit a negative balance. The situation is most severe in upstream Catchment B31, in which the gap is almost 3 times as high as sustainable supply. The strong negative balance forms the need for an improved - more sustainable - water management strategy in accordance with the principles of the NWA.

Effects of water re-allocation
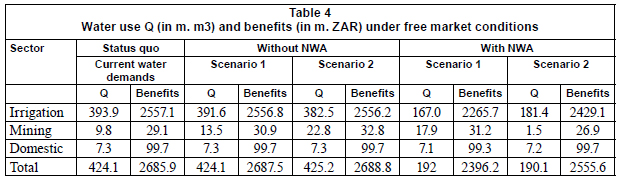
In this section, the effects of water re-allocation within and between tertiary catchments will be analysed under 2 different policy conditions. Firstly, effects purely resulting from water re-allocation will be determined using current water demands in the status quo situation. Available water amounts do not change in this policy condition, implying that water is used unsustainably and that the NWA is not considered. This makes it possible to separately estimate the benefits from re-allocation only after having estimated efficient water use levels. Model results (as shown in Table 4, column 'without NWA') support the assumption of positive benefit effects from water re-allocation.
The status quo situation shows current water demand levels for each sector at the historical level from 2007, reflecting an average year. Corresponding benefits are highest in irrigation, representing 95% of total benefits. Total water use in the Middle Olifants amounts to around 424 m. m3 per year. Permitting water transfers within tertiary catchments, as in Scenario 1, while water availabilities are kept constant at the status quo level ('without NWA'), results in small water re-allocations from irrigation to mining, confirming the assumption of water transfers from low to high-value uses. Water allocation in the mining sector increases by 37% (9.8 to 13.5, second row) while there is a decrease of only 1% in irrigation (393.6 to 391.6, first row). Although some mines have more water available than needed, others have difficulties in receiving the amount of water they need and the according licences, which will make increased water allocation levels very useful for them. Total benefits increase by 1.6 and 2.9 m. ZAR per year in Scenarios 1 and 2, respectively, with the implication that benefits are higher when water transfers are allowed in the whole Middle Olifants, and not only within tertiary catchments. In Scenario 2 water allocations to irrigation further decrease to some extent, while allocations increase by around 69% in the mining sector, compared to Scenario 1. In the domestic sector, water allocation levels stay the same as in the status quo situation, reflecting very low elasticities of households.
Since current water levels are unsustainable and do not comply with South African policies and the NWA, we determine new water allocation levels under reduced water availabilities (which complies with the NWA) in a second analysis. This allows the consideration of basic human and environmental needs, but also means that the water availability in the Middle Olifants has to be decreased by more than 50% to reach a sustainable supply level of about 190 m. m3. In Scenario 1, we witness an increase of 82% in the mining sector compared to the status quo situation, while water allocation in irrigation is reduced by 58%. As agriculture represents an important employer for the rural population in the area, WUAs and farmers argue that decreased water supplies to the agricultural sector would lead to lower production, high unemployment rates and food insecurity. However, as Backeberg (2006) states, according to the National Water Resource Strategy, irrigation agriculture will have to be competitive even if contributing to food security. This implies that agriculture should not be artificially protected and that water allocation decisions should -in the long run - follow economic principles. However, the Act favours exceptions for subsistence farmers, to support rural development and reduce rural poverty. Thus, we are of the opinion that further research that allows the inclusion of other water users such as small-scale and emerging farmers would add value to the results of this study.
It can be shown that water re-allocation presents an appropriate means to tackle the problem of water scarcity since, although water availabilities are reduced by almost 50%, total benefits under Scenario 1 only decrease by around 11% compared to the status quo, while this is even less in Scenario 2 (5%). It is important to note that the model does not consider any employment aspects and the impact of water re-allocation on farming and mining labour cannot be quantified. As agriculture is the biggest employer in the area, the impact on the unemployment rate of reducing water use by over 50% should be considered in further developments of the model. Thus, results of this study should be considered with caution. Reasons for low benefit decrease, especially in agriculture, can be found in high water values. As water became scarcer, its value increased accordingly, resulting in relatively high benefits as water is re-allocated, particularly in Catchment B31, where the increase in the water value is around 8 ZAR/m3 (relatively high), when compared to the initial value of close to zero. As the model only considers purely economic aspects, social aspects are neglected in this phase of the modelling work and results might not reflect true implementation possibilities, as farmers will not be able to pay 8 ZAR/m3. However, other studies (see Louw, 2002) found even higher water values in irrigation with 0-20 ZAR/m3.
Water allocations in Scenario 2 are reduced by 54%, 85% and 1.5%, respectively, in irrigation, mining and domestic use, compared to the status quo situation. Low water allocations to mining can be explained with differences in available water supplies in tertiary catchments (see Fig. 4) where, especially in catchments B52 and B71, gaps between current demand and sustainable supply are only slightly negative (B52) or even positive (B71). This leads to lower water values, resulting in a re-allocation to catchments with highly negative gaps and higher water values. In tertiary catchment B31, the value of water is very high and water is re-allocated from B71 and B52 to B31. This is different to the first situation where the NWA is not considered and water supply levels are much higher. Resulting water values are lower as more water is available than under the conditions of the NWA. Differences in total water use levels result from different distribution losses that are accounted for in the model.
Generally, results show that water markets represent political measures to increase water use efficiencies through re-allocation of water to its high value uses. Benefits increase the most in Scenario 2 in both situations ('without' and 'with' NWA). However, it must be noted that high transportation costs might accrue, due to large distances, which are not accounted for in the model and which would need further research as it represents a setback of the model. Transportation costs are probably quite high in the Middle Olifants, because more water is required upstream than downstream. In particular, Scenario 2, in which water can be traded between tertiary catchments, would generate higher transportation costs than Scenario 1. Thus, interpretation of results has to consider these shortcomings. However, we believe that the model can serve as background work for further applications and can be modified to integrate the transaction costs for future model validation.
Policy simulations
Given the fact that water is not a purely economic good and that equity aspects play a major role in the new South African policy, we ran relevant policy simulations and analysed resulting impacts on the allocation levels under Scenarios 1 and 2. Further simulations investigate the effects of a population increase in the year 2050 and consequently the effects of increased water demands of the urban domestic sector. All policy simulations are based on supply levels with consideration of the NWA.
Policy Simulations 1 and 2: Equity issues
Up until this point, modelling results have only taken into account efficiency aspects. However, in many cases efficiency considerations fail to consider the backward and forward linkages among sectors and other non-market uses of water, leading to the incorporation of equity and sustainability issues. This raises the question of the allocation of water resources in such a way that the standard of living of most people is improved, which is also a major concern of the South African policy (Juana et al., 2006). According to the policy of Black economic empowerment, the South African government attempts to redress past racial inequities by assuring water availability and affordability to all households. Hence, no additional water should be allocated to large-scale commercial farmers, who are mostly white and relatively affluent; instead, the water needs of the previously disadvantaged population should be prioritised. This simulation attempts to address the issue by analysing different policy interventions on the water pricing system.
In a first simulation, the end-user price in the domestic sector will be restricted to a maximum level of 4 ZAR/m3. This price was arbitrarily chosen, but we oriented ourselves on the current water price, and chose a lower one to analyse equity effects. Compared to the current average water price in the 3 provinces considered (Mpumalanga, Limpopo and Gauteng) of 5.69 ZAR/m3, and compared to water prices of up to 8 ZAR/m3 in Scenario 1 and Scenario 2, households would have to pay much less for their water. In practical terms, price changes can be implemented at the water source where raw water is extracted and the change in raw water tariffs will be translated to the end-user prices. All the simulations on price changes refer to changes at the water source and raw water prices.
In the second simulation we try to account for the policy of curbing water supply to irrigation by restricting the end-user price for large-scale irrigation farmers to a minimum level of 2.5 ZAR/m3 ceteris paribus. Again this price was arbitrarily chosen as somewhere between the prices that households and mines pay. Since currently farmers pay very low prices for water, this price restriction is relatively rigorous; nevertheless it would be in line with the policies of Government. These minimum and maximum water tariffs for households and farmers can easily be changed and adapted in further simulations.
Table 5 (next page) shows simulation results under Scenarios 1 and 2 and resulting allocation levels and benefits for the whole Middle Olifants for each sector.


Compared to results in Table 4 (the 'with NWA' Scenario 1 and 2 results), water quantities do not change remarkably as a result of the domestic water price restriction. Under Scenario 1, domestic water allocation increases from 7.1 (see Table 4) to 7.4 m. m3, corresponding to a 4% increase, while it increases by only 3% in Scenario 2. Although quantities of water used are higher than those without price restriction, benefits decrease as the water price restriction does not lead to efficient water use. Total benefits are, at 2 394 and 2 555 m. ZAR, slightly lower than benefits without the price restriction, reflecting the low impact of water price restriction in the domestic sector.
Looking at the restriction in irrigation, we realize that higher water prices for farmers have a high impact on the allocation levels and benefits. Due to the higher water price, farmers are demanding around 33 m. m3 (-20%) less water compared to the unrestricted model under Scenario 1, while water use decreases by only 6% under Scenario 2. In Scenario 1, total water use is, at 158.4 m. m3, lower than sustainable availability. Due to the high water price in irrigation, less is demanded and more is available for households. However, in tertiary catchments B32 and B51 water is not re-allocated from irrigation to households (in catchments B32 and B51 there are no mining activities), since it would not be efficient and water is therefore left unused. In Scenario 2 all water available is used, and is re-allocated to the mining sector in catchments B52 and B71. The resulting high increase in water use in the mining sector and the corresponding low increase in benefits, reflects the inefficient water re-allocation due to price restrictions in irrigation. Even in the domestic sector water allocation increased slightly to 7.4 m. m3. Total benefits in the Middle Olifants decrease by around 2% and 1% in Scenarios 1 and 2, respectively, compared to the analysis considering the NWA without price restrictions.
Results show that policy instruments (altering prices) can be one of the means to influence allocation levels under market conditions. By restricting domestic water prices to a maximum of 4 ZAR per m3, for example, water is re-allocated from irrigation to urban households. Due to the lower water prices for households, they are encouraged to consume more water. However, compared to the high domestic water price reduction of around 50%, the increase of demand by the urban households is, at 4% and 3%, relatively low, reflecting the low water price elasticity of households (see Table 3). This shows that interfering in the water pricing policy can be one instrument for the government to support (urban) households and re-allocate water from irrigation. Nevertheless, to realise higher re-allocation amounts to households, further measurements should be applied. Looking at the pricing instrument for farms, it could be shown that higher water prices in irrigation lead to highly decreased demands in the sector, and do not support reallocations to households but rather to the mining sector. Hence, it does not represent an appropriate instrument if households are the ones to be favoured.
Policy Simulation 3: Population increase
This scenario is based on population growth rates and urbanisation until the year 2050. According to the higher population figures, the amount of water assigned to the 'basic human needs Reserve' increases. As the Reserve is prioritised by the NWA, this decreases the amount of water to be freely allocated to the other sectors. Table 6 presents the new allocation figures per sector. All sectors get less water in 2050 than in 2007. The amount of water allocated to urban households is least reduced with only a 0.03% and 0.05% reduction in Scenario 1 and 2 (2050), respectively, compared to the allocation in 2007 (see Table 4). However, as the number of urban households increases due to population growth and urbanisation, less water per person is available. While in 2007, every person was entitled to 30.8 m3/a (Scenario 1) or 31 m3/a (Scenario 2) of water available in urban areas; these numbers decline until 2050, to 22.9 m3/a (Scenario 1 2050) and 23 m3/a (Scenario 2 2050). As rural households are being served from the 'basic human needs Reserve', which is now increased in absolute terms, they still receive 9 m3/a per person which is equivalent to the basic amount of 25 ℓ per capita per day.

As water levels allocated to urban households hardly decrease, increased allocation of water to the 'basic human needs Reserve' comes at the expense of the irrigation and the mining sector. The amount of water allocated to both sectors decreases by 1.1% and 7.7%, respectively, compared to the corresponding amounts in 2007 in Scenario 1. Scenario 2 leads to savings in irrigation of 1.7% and of 4% in the mining sector. Accordingly, changes in benefits are marginal, with less than 1% decrease in the sectors. Price changes are also very low.
Conclusions
As development of new water sources in the Middle Olifants is not feasible (DWAF, 2004), using water efficiently and allocating it in such a way that it meets the economic and socio-political objectives of the country, is crucial for future sustainable water availability. Therefore, this study developed a methodology to determine optimal water allocations under different water supply levels based on calculated water price elasticities and water demand functions. Results allow conclusions on the impacts of water reallocations between main water users - households, mining and irrigated agriculture- through water trade. Furthermore, the model helped to analyse the effects of policy instruments such as price restrictions on water allocation.
Firstly, as a result of allowing free trade between sectors, the model shows higher economic returns to water in the mining sector in the 'without NWA' analysis, and results of the study suggest water transfers from irrigation to mining in order to maximise benefits from water use, while domestic water use stays relatively unchanged (with negligible transfer to mining as well). However, the authors would like to emphasise that efficiency increases could indeed be easily achieved in the model, but might not be as easy to implement in practice. Due to current regulations like the existing lawful water use rights of farmers, immediate action might not be feasible and water transfers through market-driven approaches should rather be seen as a long-term process. Furthermore, necessary institutions, laws and regulations must be established. A reduction of total water availability as suggested by the NWA leads to highest reductions in irrigation, followed by the mining sector, and only marginal reductions for urban households.
The model not only provides insights on re-allocations but also on water values, which will be important for future policy decisions. Results imply that water user charges should be higher than currently applied. Furthermore, calculated elasticities provide valuable information that should be considered in the design of improved water demand management. The elasticities allow changes in demand when prices are increased to be foreseen, which is especially helpful for water suppliers, in order to calculate their returns to water provided and anticipated changes in quantities needed.
In order to address the issue of historically disadvantaged individuals the South African policy pursues the objective to divert more water to the needy, for domestic use. Our model results show that the Government intention of gradually capping water for irrigation does not only meet the socio-political objective but has an economic rationale, especially when transferred to mining. However, results also show that no more water is transferred to the domestic sector, and even fixed maximum water prices would only have a minor impact on water transfers. Hence, model results favour the slow diversion of water from irrigation to mining, but not to domestic water users. This is in line with the economic objectives but at the same time does not follow equity considerations stated in the NWA. Therefore, besides purely market-driven mechanisms the Government must find other measures, such as changed water licences and improved water distribution networks, to support the domestic sector.
We found that with growing water scarcity, water trade and water re-allocations can play an increasing role as water use becomes more efficient, as evidenced by the lower (5-11%) reduction in total benefits from water use compared to the relatively high (about 50%) reduction of water supply according to the NWA. Both intra-and inter-regional allocation results provide evidence for benefits of water re-allocations. Assuming that intra-regional allocation involves fewer transaction costs than the inter-regional allocation in the short run, the intra-regional allocation might be even more beneficial; this would need to be validated through further research. However, the intra-regional allocation involves some water loss in B71 as the sustainable supply is higher than what is actually used. Therefore, intra-regional allocation will be more effective in future when the Government makes use of this water once the planned several mining companies in B71 are in place (Conradie, 2007).
Although this study provides insights into water demands, potential benefits from water trade and policy instruments related to water pricing, it should be kept in mind that economic reasoning alone cannot underlie a new water demand management approach, and equity aspects have to be considered. More research and data are needed to be able to incorporate equity and environmental demands, in a better manner than merely as simple constraints, into economic modelling of the Middle Olifants sub-basin. Furthermore, appropriate Governmental institutions and regulations are necessary preconditions for the establishment of a water trading system in South Africa.
Acknowledgements
This work is part of the BMBF-funded project on 'Integrated Water Resources Management Pilot Project in the Middle Olifants Sub-basin of South Africa'. We would like to thank Dr Anik Bhaduri from ZEF, Dr Charles Rodgers and 2 anonymous reviewers for their review and insightful comments on earlier versions of this manuscript. Last but not least, we thank Dr Taylor Frazier for the editorial work.
References
AHRENDS H, MAST M, RODGERS CH and KUNSTMAN H (2008) Coupled hydrological-economic modelling for optimized irrigated cultivation in a semi-arid catchment of West Africa. Environ. Model. Softw. 23 (4) 385-395. [ Links ]
BACKEBERG GR (2006) Reform of user charges, market pricing and management of water: Problem or opportunity for irrigated agriculture? Irrig. Drain. 55 1-12. [ Links ]
BHARATI L, RODGERS C, ERDENBERGER T, PLOTNIKOVA M and SHUMILOV S (2008) Integration of economic and hydrological models: Exploring conjunctive irrigation water use strategies in the Volta basin. Agric. Water Manage. 95 925-936. [ Links ]
BOOKER JF and YOUNG RA (1994) Modelling intrastate and interstate markets for Colorado River water resources. J. Environ. Econ. Manage. 26 66-87. [ Links ]
CAI X, MCKINNEY DC and LASDON LS (2001) Piece-by-piece approach to solving large non-linear water resources management models. J. Water Resourc. Plann. 127(6)363-368. [ Links ]
CAI X and WANG D (2006) Calibrating holistic water resources- economic models. J. Water Resourc. Plann. 132(6)414-423. [ Links ]
CAI X (2008) Implementation of holistic water resources-economic optimization models for river basin management - reflective experiences. Environ. Model. Softw. 23 2-18. [ Links ]
CONRADIE B (2002) The Value of Water in the Fish-Sundays Scheme of the Eastern Cape. WRC Report No. 987/1/02. Water Research Commission (WRC), Pretoria. [ Links ]
CONRADIE A (2007) Personal communication, 23 August 2007. Platinum-Group Metal Mine in South Africa. Pretoria. The Department of Minerals and Energy, Directorate: Mineral Economics. [ Links ]
DINAR A (2003) The potential economy context of water-pricing reforms. In: Koundouri P, Pashardes P, Swanson TM and Xepapadeas A (eds.) The Economics of Water Management in Developing Countries. Edwards Elgar Publishing, Inc., UK. 15-40. [ Links ]
DRAPER AJ, JENKINS MW, KIRBY KW, LUND JR and HOWITT RE (2003) Economic-engineering optimization for California water management. J. Water Resourc. Plann. (May/June) 155-164. [ Links ]
DWAF (DEPARTMENT OF WATER AFFAIRS AND FORESTRY, SOUTH AFRICA) (1998) Water situation assessment model (WSAM). Department of Water Affairs and Forestry (DWAF), Pretoria. [ Links ]
DWAF (DEPARTMENT OF WATER AFFAIRS AND FORESTRY, SOUTH AFRICA) (2003) National Water Resource Strategy: Summary. Department of Water Affairs and Forestry (DWAF), Pretoria. [ Links ]
DWAF (DEPARTMENT OF WATER AFFAIRS AND FORESTRY, SOUTH AFRICA) (2004) Olifants Water Management Area. Internal strategic perspective. Department of Water Affairs and Forestry, Pretoria. [ Links ]
DWAF (DEPARTMENT OF WATER AFFAIRS AND FORESTRY, SOUTH AFRICA) (2005) Water Situation Assessment Model, A decision support system for reconnaissance level planning. Volume 1 - Theoretical Guide, Version 4, Interim Report. Department of Water Affairs and Forestry, South Africa , Chief Directorate: Planning, Directorate: Strategic Planning, Pretoria. [ Links ]
DWAF (DEPARTMENT OF WATER AFFAIRS AND FORESTRY, SOUTH AFRICA) (2007) Water Situation Assessment Model. A Decision Support System for Reconnaissance Level Planning, Volume 1. Department of Water Affairs and Forestry, South Africa, Chief Directorate: Planning, Directorate: Strategic Planning, Pretoria. [ Links ]
DWA (DEPARTMENT OF WATER AFFAIRS, SOUTH AFRICA) (2010) Department of Water Affairs. Water Services National Information System - (WS NIS)- April 2010. URL: http://www.dwa.gov.za/dir_ws/wsnis/default.asp?nStn=wsnisindex (Accessed 11 March 2011). [ Links ]
GILL T and PUNT C (2010) The potential impact of increased irrigation water tariffs in South Africa. Proc. Joint 3rd African Association of Agricultural Economists (AAAE) and 48th Agricultural Economists Association of South Africa (AEASA) Conf., Cape Town, South Africa, September 19-23, 2010. [ Links ]
HASSAN R and CRAFFORD J (2006) Environmental and economic accounts for water in South Africa. In: Lange GM and Hassan R (eds.) The Economics of Water Management in Southern Africa: an Environmental Accounting Approach. Edward Elgar Publishing Limited, Great Britain. 114-168. [ Links ]
HASSAN R and FAROLFI S (2005) Water value, resource rent re-covery and economic welfare cost of environmental protection. A water sector model for the Steelport sub-basin in South Africa. Water SA 31(1)9-16. [ Links ]
HOWE C, SCHURMEIER D and SHAW D (1986) Innovative approaches to water allocation: The potential for water markets. Water Resour. Res. 22 (4) 439-445. [ Links ]
JENKINS MW, LUND JR, HOWITT RE, DRAPER AJ, MSANGI SM, TANAKA ST, RANDALL S, RITZEMA KR and MARQUES GF (2004) Optimization of California's water supply system: Results and insights. J. Water Resour. Plann. 130(4)271-280. [ Links ]
JUANA J, KIRSTEN J and STRZEPEK K (2006) Inter-sectoral water use in South Africa: Efficiency versus equity. Proc. 26th International Association of Agricultural Economists Conf., Gold Coast, Australia, August 12-18, 2006. [ Links ]
KING N (2004) The economic value of water in South Africa. In: Blignaut J and de Witt M (eds) Sustainable Options: Development Lessons from Applied Environmental Economics. University of Cape Town Press, Cape Town. 207-238. [ Links ]
LEVITE H, SALLY H and COUR J (2002) Water demand management scenarios in a water-stressed basin in South Africa. Proc. 3rd WARFSA/WaterNet Symposium, Arusha, 30-31 October 2002. [ Links ]
LOUW DB (2002) The Development of a Methodology to Determine the True Value of Water and the Impact of a Potential Water Market on the Efficient Utilisation of Water in the Berg River Basin. WRC Report No. 943/1/02. Water Research Commission, Pretoria. [ Links ]
MAHAN RC, HORBULYK THM and ROWSE JG (2002) Market mechanisms and the efficient allocation of surface water resources in Southern Alberta. Socio-Econ. Plann. Sci. 36 25-49. [ Links ]
McKINNEY D, CAI X, ROSEGRANT M, RINGLER C and SCOTT C (1999) Modelling water resources management at the basin level: Review and future directions. International Water Management Institute (IWMI), Sri Lanka. [ Links ]
MORAN D and DANN S (2008) The economic value of water use: Implications for implementing the water framework directive in Scotland. J. Environ. Manage. 87 484-496. [ Links ]
NIEUWOUDT WL, BACKEBERG G and DU PLESSIS H (2004) The value of water in the South African economy: some implications. Agrekon. 43(2)162-183. [ Links ]
NIEUWOUDT WL (2000) Water markets institutions in South Africa, lessons from Colorado. Agrekon. 39(1)58-67. [ Links ]
OLMSTEAD S, HANEMANN W and STAVINS R (2007) Water demand under alternative price structures. National Bureau of Economic Research Working Paper No. 13573, November 2007. NBER, Cambridge, USA. [ Links ]
POLOKWANE MUNICIPALITY (2006) Water Service Development Plan. Polokwane Municipality. [ Links ]
REPUBLIC OF SOUTH AFRICA (2002) Proposed First Edition National Water Resource Strategy, August 2002. Department of Water Affairs and Forestry, Pretoria. [ Links ]
RINGLER C (2001) Optimal water allocation in the Mekong River Basin. Bonn: Centre for Development Research (ZEF), Discussion Paper No. 38. [ Links ]
RODGERS C and ZAAFRANO R (2002) Water allocation and pricing strategies in the Brantas River Basin, East Java, Indonesia. Conf. on Irrigation Water Policies: Micro and Macro Considerations, Agadir, Morocco, 15-17 June 2002. [ Links ]
RODGERS C and ZAAFRANO R (2003) A water resources management policy simulation model of the Brantas Basin, East Java, Indonesia. Paper prepared for the Panel on Water Policy and Agricultural Production at the Global and River Basin Levels, IAAE Meetings, Durban, South Africa, 16-23 August, 2003. [ Links ]
ROSEGRANT MW, RINGLER C, MCKINNEY DC, CAI X, KELLER A and DONOSO G (2000) Integrated economic-hydrologic water modelling at the basin scale: The Maipo River Basin. International Food Policy Research Institute (IFPRI), Washington. [ Links ]
STATSSA (2007) Statistics South Africa. Community Survey 2007. URL: http://interactive.statssa.gov.za/superweb/login.do (11 January 2010). [ Links ]
SPULBER N and SABBAGHI A (1998) Economics of Water Resources: From Regulation to Privatization. Kluwer Academic Publishers, Boston. [ Links ]
TREN R and SCHUR M (2000) Olifants River Irrigation Schemes, Reports 1&2. International Water Management Institute (IWMI), Sri Lanka. [ Links ]
VAN VUUREN DS, VAN ZYL HJD, VECK GA and BILL MR (2004) Payment Strategies and Price Elasticity of Demand for Water for Different Income Groups in Three Selected Urban Areas. WRC Report No. 1296/1/04. Water Research Commission, Pretoria. [ Links ]
Received 8 July 2010; accepted in revised form 21 April 2011.
* To whom all correspondence should be addressed. +49 711-459-22437; fax: +49 711-459-24248; e-mail: teresa.walter@uni-hohenheim.de
Appendix 1
Agricultural demand estimation
Agricultural water demand schedules were determined with mathematical programming using primary data from 2007. For each sub-basin a regional farm model was established applying the representative farm approach. The objective function of each single representative farm model is specified as net annual income Z resulting from n crops grown. It is maximised by selecting the optimal land areas of crops subject to water availability.

where:
pi is the output price of the crop product i
yi the yield of crop i
xi is the cropped and irrigated area with crop i
ci are the crop production costs of crop i not considering water costs
cw are electricity costs of pumping water, which depend on water quantity applied.
The model is of a long-run nature since it also considers activities that differ from each other by their capital investment like permanent crops and it considers irrigation establishment investment costs.
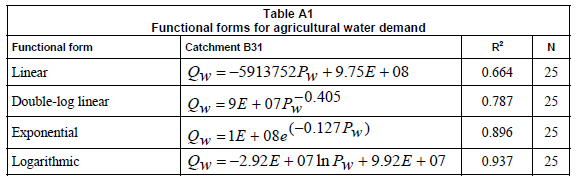
In a first step for 3 of the 5 catchments a representative farm was determined and modelled subject to land, water and rotation constraints. Annualised capital costs were included for permanent crops and irrigation equipment. After model validation, demand schedules were developed by varying the water price. Through horizontal summation of the demand schedules of the individual producers in the area an aggregate derived water demand schedule could be determined. Since results of programming models can only depict stepped demand schedules, demand functions were obtained by fitting regression equations. The logarithmic functional form turned out to show the best fit in most of the cases. Representatively for the other 2 catchments Table A1 shows different functional forms and their fit calculated in Stata. Inverse demand functions were established through solving for P.
Demand estimation in the mining sector
Water demand for 5 mines in the MO was determined by estimating a translog cost function with primary time series data over several months.

where:
t = 1, ......, T represents the periods and indexes i and j with i, j = water, electricity, labour, capital, diesel correspond to variable inputs n. Index y represents output and the index t refers to monthly observations and reflects the time series character.

where:
Sit represents the cost share of input i at date t.
This partial differentiation of the cost function with respect to the price of 1 input yields the demand function of that input, which is dependent on the level of output and the vector of input prices. Seemingly unrelated regression (SUR) is used to estimate the systems of equations jointly with correlated disturbances. The parameter estimates of the translog functional form cannot be interpreted directly, but they can be used for further calculations of water price and cross-price elasticities. The water demand function can be derived from the share equation.
Domestic demand estimation
Demand estimation was based on secondary data of local municipalities from the years 2005/2006 to 2008/2009 (National Treasury, South Africa, Water Service Development Plans, WSIS, 2009). Socio-economic data were used from the Census 2001 and Household Survey 2007 (StatsSA, 2001; StatsSA, 2007). The combination of the different data sources resulted in an unbalanced panel data set with 38 municipalities and 150 observations in total. Municipalities with only a flat-rate tariff structure and with missing data were excluded from the analysis. A drawback of the data is that no data on water use and water bills at the individual household level were available. In addition to this, non-payment of water bills constitutes a major problem in South Africa due to the 'non-payment culture' for services which dates back to the Apartheid regime (King, 2005). However, the rate of non-payment had to be neglected. The following Stone-Geary water demand function was estimated econometrically:
where:
θ is the parameter to be estimated for the income-price relation and ϑ is the subsistence level of water which is non-responsive to prices. The price variable p used in the estimation refers to the average price calculated based on the increasing block rates tariff system implemented in most municipalities. The vector z comprises all socio-economic variables that were included to control for socio-economic differences in water demand (population over 65 years, average household size, backlog rate (in terms of water provision), and dummy variables for the provinces). Estimation results reveal a very low price elasticity of -0.036.

