


Servicios Personalizados
Articulo
 Inglés (pdf)
 Articulo en XML
 Referencias del artículo
Indicadores

Links relacionados
-
 Citado por Google
 -
 Similares en Google
Compartir

 Permalink
Water SA
versión On-line ISSN 1816-7950
versión impresa ISSN 0378-4738
Water SA vol.37 no.3 Pretoria jul. 2011
The effect of air supply on nitrogen removal using a biological filter proposed for ventilated pit latrines
Martha AA CoetzeeI,*; Magaretha P Roux-Van der MerweII; Jacqueline BadenhorstII
IDepartment of Environment, Water and Earth Sciences, Tshwane University of Technology, Private Bag X680, Pretoria, South Africa, 0001
IIDepartment of Biotechnology and Food Technology, Tshwane University of Technology, Private Bag X680, Pretoria, South Africa, 0001
ABSTRACT
Pit latrines are the most commonly used sanitation systems in many developing countries. Various researchers have reported elevated nitrate concentrations in groundwater in the vicinity of pit latrines and this could pose a serious health risk to the users of the water source. Faecal sludge from pit latrines contains high concentrations of nitrogen and organic matter (3-5 g·ℓ-1 N and 20-50 g·ℓ-1 COD); however, it is produced at a very low rate (1.5 ℓ·capita-1·d-1) relative to that of waterborne sewage systems. A pit latrine basically only confines the waste and no real treatment takes place. In this research the nitrogen was removed in a biological filter using a combination of nitrification and denitrification processes. The aim of this investigation was to determine the effect of air supplied at different rates, namely, 0, 0.3, 1.0 and 2.0 m3·h-1 N, on the biological filtration process. The application rate was 0.04 m3·m-2·d-1.
More than 90% removal of nitrogen was observed at an air supply rate of 1.0 m3·h-1 N. At lower air supply rates nitrification was not complete. At an air supply rate of 2.0 m3·h-1 nitrogen removal was also approx. 90%, but the biological filter only became stable after about 2 months of operation, possibly due to desiccation of the biomass.
Keywords: High nitrogen concentrations, nitrification, denitrification, biological filter
Introduction
About 18.4 million people in South Africa do not have access to proper sanitation systems, of which 6.7 million do not have any sanitation service at all (DWAF, 2009). The system recommended by government (DWAF, 1996) as a basic level of service for a household is the ventilated improved pit latrine (VIP). Ventilated improved pit systems which are poorly designed and operated, or where the soil characteristics are not favourable, can create a real danger of groundwater pollution. Most of the pollutants are normally bound in the soil matrix by a variety of chemical, physical and biological processes, preventing these from reaching the groundwater. Nitrate, however, is not bound and moves freely through the soil matrix to the groundwater (Fourie and Van Ryneveld, 1995). Various researchers have confirmed that elevated nitrate concentrations occur in groundwater in the vicinity of pit latrines (Lewis et al., 1980).
Nitrate is a health risk, especially for babies younger than 6 months, as it causes methaemoglobinaemia (also known as 'blue babies'). In adults it causes an irritation of the mucous membranes and is possibly also carcinogenic (Shuval and Gruener, 1977; Terblanche, 1991). The recommended limit for nitrate in drinking water in South Africa is 6 mg·ℓ-1 as NO3-N (DWAF, 1993).
According to the guidelines provided by DWAF (2002), a VIP latrine should be designed to supply a service to households which consist of 6 persons. The hydraulic loading rate on a VIP system will be approx. 0.04 m3·m-2·d-1, assuming that the pit serves a family of six and that the liquid contribution is 1.5 ℓ·capita-1·d-1 (Geigy, 1962). The majority of the total nitrogen excreted is in the form of urine, of which 84% consists of urea, approx. 13.2 g·d-1 (Geigy, 1962). The pit of a VIP system contains a combination of fresh faecal matter and stored faecal sludge. The age of the sludge in the pit varies from a few days to several weeks. Thus, the composition of faecal sludge from pit latrines varies considerably. Typical faecal sludge from pit latrines and bucket systems contains 2 000-5 000 g·ℓ-1 NH4-N (Montangero and Strauss, 2002). The nitrogen load on a VIP system is about 180 g·m-2·d-1 N (assuming that the TKN concentration is 5 g·ℓ-1).
The organic content of urine and faeces is very high. Adult faeces and urine, according to Van Ryneveld and Fourie (1993), provides 19.3 g·d-1 and 10.3 g·d-1 BOD5, respectively. Czemiel (2000) reported a BOD7 value of 20 g·capita-1·d-1 for the mixture of urine and faeces (faecal sludge). Assuming that the concentration of the organic matter that will leach from a VIP system will be 17 g·ℓ-1, the organic loading rate will be 0.4 kg·m-3·d-1 BOD5.
A basic VIP system only confines the waste and no real treatment takes place. Modifications to the basic system exist, where urine and faecal matter are separated. The faecal matter falls into the pit below, while the urine is diverted into a soak-away or collection pot. As the bulk of the nitrogen is in the urine, there is a need to treat either the urine or the liquid fraction of the faecal sludge, in order to ensure safe disposal of the leachate into the soil. A new modified VIP system is proposed, where actual treatment of the nitrogen fraction takes place, as the faecal sludge (faeces and urine) in the pit is allowed to leach into a biological filter. The filter is packed with stones. The vent pipe is fitted with an extractor fan (wind-driven 'whirlybird') to induce a draft through the filter. Thus, all of the liquid that seeps from the top part of the pit is treated in the biological filter (Fig. 1).

Biological filters have been proven to be an effective treatment option for the treatment of domestic wastewater. Nitrification and partial denitrification is achieved with these systems. However, should this well-known technology be incorporated in a VIP system, the parameters would be drastically different from a standard low-rate biological filter used for the treatment of domestic sewage. The hydraulic loading rates of standard rate biological filters are significantly higher, i.e. 1.2-3.5 m3·m-2·d-1 (Barnes et al., 1981). The TKN and COD concentrations, on the other hand, are significantly lower, i.e., approx. 60 mg·ℓ-1 N and 500 mg·ℓ-1 COD (Metcalf and Eddy, 2003). Complete nitrification can usually be achieved. Normally denitrification is not achieved in biological filters but under certain operating conditions it can be done (Metcalf and Eddy, 2003). The typical organic loading rate for combined carbon and nitrogen removal is 250-750 g·m-3·d-1 COD, and the nitrogen loading rate is 0.2-1.0 g·m-2·d-1 (Wates, Meiring & Barnard (Pty.) Ltd., 2002).
Nitrification is the oxidation of ammonium to nitrate by specific autotrophic bacteria (Metcalf and Eddy, 2003). Nitrifiers are obligate aerobic organisms. In biofilm processes this implies that the dissolved oxygen concentration in the bulk of the liquid should be high enough to ensure adequate diffusion into the biofilm. In the proposed modified VIP system, a draft of air will be mechanically induced by an extraction fan system (wind-driven 'whirlybird', Fig. 1). Thus, one of the critical design parameters will be to estimate the correct amount of air to be introduced for optimum oxidation of ammonium.
Nitrate removal by biological denitrification can also be achieved in a biological filter. Denitrification may start simultaneously with nitrification or after nitrification, as nitrates are the electron acceptors for denitrification (Iwai and Kitao, 1994). By contrast to nitrification, denitrification is an anaerobic process. As the biofilm becomes thicker, the inner layer becomes anaerobic and denitrification can occur (Iwai and Kitao, 1994). The rate will also be determined by the availability of carbon (Nielson et al., 1990). As nitrification normally occurs in the lower reaches of a biological filter, it is possible that the carbon will be exhausted and it is very likely that complete denitrification will not be feasible.
The aim of this investigation was to determine the optimum amount of air which should be supplied to the biological filter at the proposed hydraulic loading rate, and to evaluate the performance of the filter with regards to nitrogen removal.
Materials and methods
Biological filter set-up
The biological filter consisted of a PVC column, 150 mm in diameter and 1 500 mm in length. The filter was packed with stones, 10-20 mm in diameter. The synthetic waste medium was fed intermittently to the biological filter by means of a diaphragm dosing pump (Model: Alldos M205). The pump was controlled by an electronic timer, which switched the pump on for 30 s, every hour. The medium was distributed through micro-sprayers over the stones onto the biological filter. The average application rate was 640 mℓ·d-1 (a loading rate of 0.04 m3·m-2·d-1) (Fig. 2).

Air was supplied by means of a compressor (Model: Fini, 100) through a network of perforated perspex pipes. The air flow through the column was monitored with a rotameter (Model: Frank 123) (Fig. 2).
The composition of the synthetic waste medium
Fresh medium was prepared daily. Primary settling tank effluent from a domestic wastewater treatment plant (COD was approx. 250 mg·ℓ-1; TKN approx. 50 mg·ℓ-1 N; and total P approx. 10 mg·ℓ-1) was supplemented with urea (8.6 g·ℓ-1) and glucose (16 g·ℓ-1) to give a TKN concentration of 4 000 mg·ℓ-1 and 17 100 mg·ℓ-1 COD. The pH was buffered to pH 7 with 1.8 g·ℓ-1 potassium dihydrogen phosphate, and 2.8 g·ℓ-1 disodium hydrogen phosphate. The phosphate salts were also used to ensure sufficient phosphorus to sustain unrestricted microbial growth in the biological filter.
Operational conditions in the biological filter
The biological filter was operated at an air supply rate of 1.0 m3·h-1 N for nearly 6 months. Thereafter, the air supply was stopped and the reactor was operated at zero air supply until steady-state conditions were obtained (approx. 2 months). The air supply was then raised to 0.3 m3·h-1 N and again operated until steady-state conditions were obtained (approx. 2 months). After that time period, the air supply was increased to 2.0 m3·h-1 N and was operated for another 3-month period until steady-state conditions were obtained. The time periods for the trials at 1.0 and 2.0 m3·h-1 N were longer than those at 0 and 0.3 m3·h-1 N, because at 1.0 m3·h-1 N a preliminary growth period was required to achieve steady state and at 2.0 m3·h-1 N major instability was experienced during the first 2 months of operation. When any operational parameters were changed the reactors were operated (under the new set of parameters) until steady-state conditions were obtained. Steady-state conditions were based on stable performance of the biological filter with regards to ammonium, nitrite and nitrate concentrations (3 to 4 weeks of comparable results) in the effluent.
Monitoring of the effluent composition
The pH (Orion Model 410A) of the effluent from the biological filter, as well as the volume throughput, were determined daily in all of the trials. It was anticipated that the increased aeration rate (at 1 and 2 m3·h-1 N) would lead to evaporation and consequent concentration of the effluent, and therefore the conductivities of the effluent from these trials were also determined daily, using a Hach Sension 6 meter. The effluents from the different trials were also analysed at least once a week for COD, TKN, nitrate, nitrite and ammonium, according to Standard Methods (APHA, 1995).
High concentrations of nitrate and nitrite
Higher concentrations of nitrate and nitrite were determined with an ion chromatograph (76I Compact IC from Metrohm). A Metrosep A Supp 3 column (6.1005.320) was used. The sample loop was 20 µℓ and the flow rate through the column was 1.0 mℓ·min-1 with a mixture of 1.7 mM NaHCO3 and 1.8 mM Na2CO3 as eluents (APHA, 1995).
Low concentrations of nitrate and nitrite
Lower concentrations of nitrate and nitrite were determined with colorimetric methods. The salycilate method was used for nitrate analyses (Miller and Wideman, 1955). An aliquot of the sample, treated with sodium salicylate, was evaporated on top of a water bath. The dried sample was re-suspended with concentrated sulphuric acid and diluted with distilled water before a 50% sodium hydroxide solution was added for colour development. Thereafter the sample was transferred, quantitatively, to a volumetric flash and the absorbance was read at a wavelength of 410 nm on a spectrophotometer (Hach model: DR2000). The concentration was determined with the aid of a calibration curve. The nitrite concentration was determined colourimetrically by addition of the colour developing agent, which consisted of a mixture of 2.5 g·ℓ-1 sulfanilamide, 25 mℓ·ℓ-1 of a 85% phosphoric acid solution and 0.25 g·ℓ-1 N-(-1-naphthyl)-etylene diamine dihydrochloride, to an aliquot of the sample. The absorbance was read at a wavelength of 543 nm. The concentration was determined with the aid of a calibration curve. A DR2000 spectrophotometer (Hach Co. Loveland CO) was used.
The ammonium concentration
The ammonium concentration was determined using the distillation method (APHA, 1995). An aliquot of the sample was buffered with 25 mℓ of a solution that contained 9.5 g·ℓ-1 sodium tetraborate and 88 mℓ 0.1 N NaOH, treated with 30% NaOH to increase the pH value above 9. The sample was then distilled on a Kjeltec system 1002 distillation unit. The distillate was collected in 2% boric acid solution and titrated to end point with 0.02 N sulphuric acid.
TKN
For the TKN analysis an aliquot of the sample was first digested (Buchi) with 10 mℓ concentrated sulphuric acid and a TKN tablet (Merck) (potassium sulphate and cupric sulphate) at 360 ̊C. The resultant ammonium was determined as mentioned before (APHA, 1995).
COD
The COD concentration was determined according to the closed reflux, colourimetric method. An aliquot of the sample was treated with 1.5 mℓ digestion solution (which was a mixture of 10.216 g·ℓ-1 potassium dichloromate, 167 mℓ concentrated sulphuric acid and 33.3 g·ℓ-1 mercuric sulphate) and 3.5 mℓ concentrated sulphuric acid, and digested at 150ºC for 2 h. After cooling, the absorbance of the samples was read at 600 nm using a spectrophotometer (Hach model: DR2000). The concentration was determined with the aid of a calibration curve (APHA, 1995). All chemicals used were of analytical grade and obtained from major retailers.
Data analysis
The estimated interval of the mean (t-estimate) was calculated at 95% confidence level for the different parameters in the effluent, for the different trials, at steady-state conditions. Data Analysis PlusTM 2.12, an add-in for Microsoft Excel, was used to perform the data analysis. The results are reported as  ± 1.96
  (where is the estimated mean, σ is the standard deviation and n the number of samples (Keller and Warrack, 2000)).
Results and discussion
Liquid loss from the reactors at different air supply rates
The average dosing rate of the reactor operated at 0 m3·h-1 N air supply was 678 ± 23 mℓ·d-1 and the average effluent produced was 535 ± 36 mℓ·d-1. That represented a 21% loss in liquid. This loss of water was probably the result of evaporation. Even with no air supplied, there was probably a natural draft of air through the filter induced by the differences in air temperatures between the air in the filter and the ambient air (Wates, Meiring & Barnard (Pty.) Ltd., 2002).
At an air supply rate of 0.3 m3·h-1 N the average dose was 661 ± 33 mℓ·d-1 and effluent was produced at a rate of 507 ± 31 mℓ·d-1. The liquid loss was slightly higher, at 23%. The dosing rates at 1.0 m3·h-1 N and 2.0 m3·h-1 N were 632 ± 19 mℓ·d-1 and 674 ± 24 mℓ·d-1, respectively. The effluents were produced at a rate of 398 ± 19 mℓ·d-1 for 1.0 m3·h-1 N and 284 ± 25 mℓ·d-1 for an air supply rate of 2.0 m3·h-1 N. This represented an average liquid loss of 37% for the air supply rate of 1.0 m3·h-1 N and 58% for the air supply rate of 2.0 m3·h-1 N. Although the liquid loss increased significantly at 1.0 m3·h-1 N , in comparison with the reactor trials operating under lower or no air supply, this seems to have had no significant effect on the stability of the reactor. However, at an air supply of 2 m3·h-1 N the liquid loss nearly doubled and this probably affected the stability of the biological filter. Compared to the performances of the other trials, it only became stable after 50 days of operation.
The conductivity of the effluent, for the reactor trials with the higher air supply rates of 1.0 and 2.0 m3·h-1 N,was also determined. At an air supply rate of 1.0 m3·h-1 N, the conductivity varied between 6.4 and 11.5 mS·cm-1 (average 7.7 ± 0.3 mS·cm-1), and at an air supply rate of 2.0 m3·h-1 N the range was 9.5 to 35.6 mS·cm-1 (average 18.1 ± 2.2 mS·cm-1). These results confirm that a significant liquid loss took place and concentrated the effluent, at an air supply rate of 2.0 m3·h-1 N. The increase in conductivity was influenced by the increased concentration of the dissolved salts (ammonium and nitrate) in the effluent. The nitrate concentration was reduced considerably, from 1 085 ± 276 mg·ℓ-1 N before steady-state conditions to 35.2 ± 26.8 mg·ℓ-1 N at steady-state conditions, and consequently also resulted in a reduction of the conductivity (from an average of 20.7 ± 2.7 mS·cm-1 before steady-state conditions to 12.5 ± 1.3 mS·cm-1 after stable conditions were obtained).
The composition of the effluent from the reactor trials at the different air supply rates, with regards to nitrogen species
The concentration of the various nitrogen species and pH values at the different air supply rates are presented in Table 1. Urea is enzymatically hydrolysed to form ammonium (Orhon and Artan, 1994). Thus, the TKN in the effluent will mainly be in the form of ammonium. At all 4 air-supply rates the ammonium concentration in the effluent was significantly reduced within 7 days, from approximately 4 000 mg·ℓ-1 N to 1 278 mg·ℓ-1 N, 1 073 mg·ℓ-1 N, 398 mg·ℓ-1 N and 2 985 mg·ℓ-1 N, at 0, 0.3, 1.0 and 2 m3·h-1 N, respectively. The interesting results found at 1 m3·h-1 N (low ammonium concentration compared to the other trials) could possibly be due to the fact that the biological filter was put into operation for the first time, using uncolonised rocks. Thus the high initial loss of nitrogen was probably due to physical processes and not accumulation by biomass, as biomass takes time to develop and nitrifying organisms are known to be slow growers (Metcalf and Eddy, 2003). The initial rapid removal of nitrogen in the newly-packed biological filter was most likely due to the adsorption of the ammonium ions onto the stones and the newly formed biomass. It is well known that ammonium (NH4+) adsorbs to various organic and inorganic compounds like soil particles (Lance, 1972; Nishantha Fernando et al., 2005). Wik (1999) observed ammonium adsorption and desorption in nitrifying trickling filters and Nielsen (1996) confirmed that ammonium also adsorbs to activated sludge flocs.

The hydrolysis of urea proceeds according to the equation below (Orhon and Artan, 1994):
(NH2)2CO + 3H2O → 2NH4+ + CO2 + 2OH-
The production of hydroxyl ions will increase the pH of the liquid. However, initially the pH only increased slightly (from pH 7 to pH 7.5; Fig. 3 shows the change in the composition of the liquid from the middle of the biological filter operated at 1 m3·h-1 N), which indicates that ammonium ions were probably exchanged with hydrogen ions, which kept the pH nearly constant until the full exchange capacity of the filter was reached and the pH increased as the ammonium concentration in the liquid increased. The biological filter showed a breakthrough of ammonium and an increased pH value, after 61 days; thereafter, the ammonium concentration remained lower than 500 mg·ℓ-1 N (Fig. 3). Similar conclusions were made by McNevin and Barford (2001) when they examined the relationship between the adsorption of ammonium and pH on peat moss and found that the pH remained constant. They postulated that ammonium ions from the feed were replaced by hydrogen ions from the peat moss.

Once a proper biomass was established ammonium was probably removed by a combination of processes, namely, volatilization, assimilation into the biomass and biological nitrification. Although volatilization of ammonia could possibly occur in the system, the contribution to the removal of ammonia was probably not significant as air stripping of ammonia only occurs at pH values above 9.5 (Metcalf and Eddy, 2003), and the pH values in all the trials varied between 7.5 and 9.0.
Some of the ammonium was also used for the assimilation of biomass. Microorganisms require nitrogen for growth. Heterotrophic organisms which grow on domestic wastewater require carbon, nitrogen and phosphorus (expressed as BOD5:N:P) in a ratio of 100:5:1 (Orhon and Artan, 1994). However, the biomass yield for aerobic heterotrophic growth on pure glucose (used in this study) is higher than it is for growth on domestic wastewater. The YH (e-. e biomass/ e-. e substrate) for domestic wastewater is 0.66 e-. e biomass/ e-. e substrate compared to the 0.79 e-. e biomass/ e-. e substrate for glucose (Orhon and Artan, 1994). The nitrogen requirements can be calculated from stoichiometric reaction equations developed by using the concept of half-reactions (Grady and Lim, 1980; Orhon and Artan, 1994). For heterotrophic, aerobic growth with glucose as carbon source and electron donor, the 3 half-reactions will be:

Thus, for glucose, where YNH = 0.79 e-. e biomass/ e-. e substrate, the overall stoichiometric reaction equation for bacterial growth is:
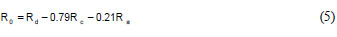
where:
R0 = The overall stoichiometric reaction
Rd = Reaction for electron donor
Rc = Reaction for bacterial cell synthesis
Ra = Reaction for electron acceptor
By applying Eq. (4) the amount of ammonium required per e-. e substrate (expressed as N) can be calculated as follows:

As 1 e-. e substrate is equivalent to 8 g COD (Orhon and Artan, 1994)
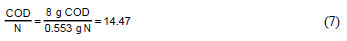
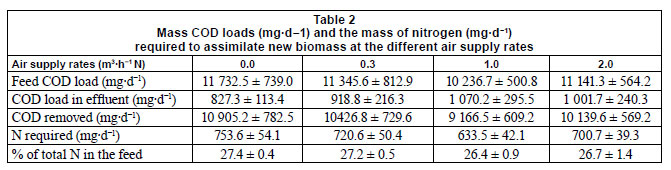
The synthetic feed-water contained 16 g·ℓ-1 glucose (a theoretical COD value of 17.1 g·ℓ-1), which was used to determine the mass of the COD load on the system. The total COD concentration in the effluent was determined and not residual glucose. It is known that the total COD in the effluent from the biological filter will contain sloughed biomass, residual glucose and microbial waste products (Metcalf and Eddy, 2003). The COD left in the effluent would therefore not solely be glucose. However, should it be assumed that glucose comprised 100% of the total COD in the effluent, the amount of nitrogen that would be assimilated by biomass could be calculated. From the effluent COD concentrations, the mass of COD removed was determined (Table 2) and the amount of nitrogen that would be required for biomass production was calculated based on the COD/N ratio obtained above (COD/N = 14.47). It is evident that at least 27% of the applied nitrogen was used for growth by the bacteria. This percentage is probably higher as glucose is not the only contributor to the effluent COD.
Nitrification occurred in the biological filters at all the air supply rates. The low hydraulic loading rate and the intermittent dosing rate possibly left enough void space to provide oxygen for nitrification even where no air was supplied. However, the nitrification was limited and incomplete, as can be seen in the high nitrite concentrations in the trial where no air was supplied (387 ± 167 mg·ℓ-1 N) compared to the higher air supply rates in the other trials (at 1 m3·h-1 N the nitrite concentration was 13.0 ± 12.8 mg·ℓ-1 N and at 2 m3·h-1 N the nitrite was 4.0 ± 1.5 mg·ℓ-1 N). With no air supplied, the ammonium was 1 366 ± 106 mg·ℓ-1 N (Table 1) and when the air supply rate was increased to 0.3 m3·h-1 N more ammonium was oxidised as the ammonium concentration was decreased to 531 ± 46 mg·ℓ-1 N. The lowest ammonium concentration was obtained at an air supply rate of 1.0 m3·h-1 N, i.e. 336 ± 65 mg·ℓ-1 N. At an air supply rate of 2 m3·h-1 N it seems as if little oxidation of ammonium took place (1 075 ± 179 mg·ℓ-1 N). However, it has been shown that twice as much liquid loss occurred during this trial compared to the others. Therefore, should this be brought into consideration, the ammonium concentration was comparable to that of the reactor trial at 0.3 m3·h-1 N (531 ± 46 mg·ℓ-1 N). These results were confirmed when the mass loads were calculated to compare the results (Fig. 4).
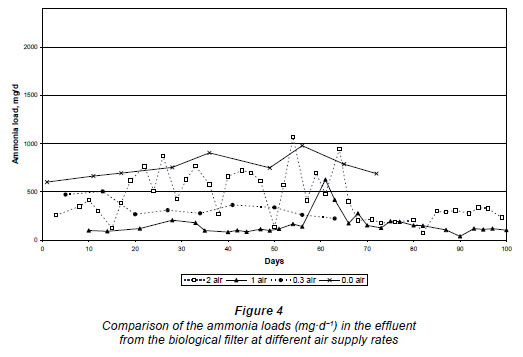
Because of the liquid loss and the resulting concentrating effect on the various nitrogen species in the different effluents, the mass loads (mg·d-1) were calculated to compare the results at the different air supply rates. At zero air supply the average ammonium load in the effluent was 758 ± 92 mg·d-1, which decreased significantly when the air supply was raised to 0.3 m3·h-1 N, i.e. 282 ± 36 mg·d-1 N. For 1.0 m3·h-1 N, ammonium load was 120 ± 32 mg·d-1 N, and at 2.0 m3·h-1 N the ammonium load was 240 ± 45 mg·d-1 (Fig. 4). From the results in Fig. 4, it is evident that even if a natural draft exists in the reactor with no air supplied, this was not sufficient for satisfactory nitrification to occur. The trial at an air supply rate of 1 mg·d-1 N gave the best performance overall and was more stable, although complete oxidation of ammonium was also not obtained. The trial supplied with 2.0 m3·h-1 N was initially very unstable (probably due to the concentration effect of the high air draft through the biological filter and desiccation of the biomass), but after 68 days of operation it became stable and produced similar results to when the biological filter was operated at 1.0 m3·h-1 N air supply, i.e. 240 ±45 mg·d-1 N.
However, the nitrification (oxidation of nitrite to nitrate) was incomplete at the lower rates of air supply. The nitrite load was 218 ± 104 mg·d-1 N at zero air supplied, at steady state, while the nitrite load at 0.3 m3·h-1 N was 149 ± 30 mg·d-1 at steady state. At the higher air supply rates, the nitrite loads were much lower, i.e., 4.2 ± 4.0 mg·d-1 and 8.8 ± 7.2 mg·d-1 at 1.0 m3·h-1 N and 2.0 m3·h-1 N, respectively (Fig. 5).

These results are in accordance with that found by Turk and Mavinic (1989) and Balmelte et al. (1992). They found nitrite built-up at low dissolved oxygen concentrations in various processes. More recently, Bernet et al. (2001) achieved nitrite accumulation in a completely stirred biofilm reactor when the dissolved oxygen concentration was less than 0.5 mg·ℓ-1. Pollice et al. (2002) operated laboratory-scale reactors under continuous and intermittent aeration conditions and build-up of nitrite was also found. Thus, these results indicate that the oxygen was probably limited at the lower air supply rates (0 and 0.3 m3·h-1 N). As more oxygen was available at the higher supply rates (1 and 2 m3·h-1 N), the nitrification process was more complete.
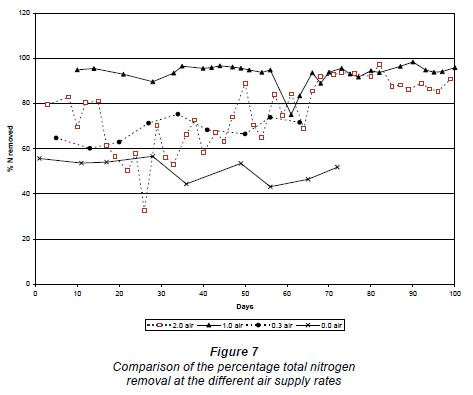
The nitrate load in the effluent at zero air supply was 371 ± 73 mg·d-1 Nand at 0.3 m3·h-1 N the load was of the same order, approx. 347 ± 64 mg·d-1 (Fig. 6). Because more ammonium nitrified, more nitrogen was also removed at 0.3 m3·h-1 N. The percentage nitrogen lost at 0.3 m3·h-1 N was 71 ± 3%, compared to the 51 ± 4% at zero air supply (Fig. 7). At an air supply rate of 1.0 m3·h-1 N, the nitrate load was 4.3 ± 3.3 mg·d-1and at an air supply rate of 2.0 m3·h-1 N the nitrate load was 0.8 ± 0.3 mg·d-1 (Fig. 6). The average percentage nitrogen loss at 1.0 m3·h-1 N and 2.0 m3·h-1 N was 94.5 ± 1.4% and 90.3 ± 2.1%, respectively (Fig. 7).

An unexpected observation was the high denitrification rates at the higher air supply rates. It is evident from the literature (Ekama et al., 1984) that the presence of dissolved oxygen is one of the limiting factors influencing denitrification. However, denitrification can take place in a biological filter even if there is high dissolved oxygen present in the bulk of the liquid, as long as the biofilm is thicker than 200 µm, as oxygen can only penetrate the upper 100-200 µm of a biofilm (Biesterfield et al., 2003).
Usually the availability of biodegradable COD in the lower parts of a biological filter is limited. The rate of denitrification in a biofilm process is influenced by the rate of movement of nutrients in and out of the biofilms (Grady and Lim, 1980). COD:N > 4.5 mg COD:mg NO3-N is required to obtain more than 90% removal of nitrogen (Grady and Lim, 1980). Orhon and Artan (1994) showed that a COD:NO3 ratio of 4.8 is required for denitrification in an anoxic, activated sludge reactor. The COD:NO3 ratio in this investigation was 4.3, which was slightly lower than this.
The lack of denitrification in the trials operated at the low air supply levels was probably due to insufficient biomass in the lower reaches of the biological filters to sustain anaerobic conditions. Because of the high organic load, and the low air supply levels, most of the COD load would be metabolized anaerobically. Under anaerobic conditions much less biomass is formed (Grady and Lim, 1980).
With this in mind the COD concentrations in the effluent of the trials operated at the various air supply rates were compared. The average COD concentrations of the trials operated at 0 and 0.3 m3·h-1 N air supply rates were very similar, i.e. 1 502 ± 321 mg·ℓ-1 COD and 1 732 ± 372 mg·ℓ-1 COD, respectively. However, the average COD concentrations at 1.0 and 2.0 m3·h-1 N were 2 920 ± 527 and 3 588 ± 891 mg·ℓ-1 COD, respectively, about double the COD concentrations of the trials at the lower air supply rates. The higher COD concentrations in the effluent at the higher air supply rates indicate more sloughed biomass, as COD in the effluent is mainly sloughed biomass, unbiodegradable COD (which was not present in the influent as glucose was the sole carbon source) and microbial waste products (Ekama et al, 1984). These results support the assumption that the biomass was thick enough to maintain anaerobic conditions that could sustain denitrification.
Conclusion
A very rapid decrease in the nitrogen concentration was observed during the initial trial operated at 1 m3·h-1 N, possibly due to the adsorption of ammonium onto the newly formed biomass and the stones in the biological filter. As the ammonium desorbed it was removed by a combination of volatilization and nitrification processes. However, complete removal of ammonium was never observed. The lowest ammonium concentration was observed at 1 m3·h-1 N, i.e. 336 mg·ℓ-1 N. At the lower air supply rates, nitrification was incomplete and high nitrite concentrations were observed in the effluent.
Denitrification was nearly complete at the higher air supply rates, probably due to thicker biomass with which to provide anaerobic conditions. The reactor was the most stable at the 1 m3·h-1 N air supply rate and produced the best results. More than 90% removal of nitrogen was observed.
Currently there is no on-site treatment system that treats both the solid and the liquid part of sewage sludge from VIP systems. The results obtained from the biological filter proposed for use in the modified VIP system in this study show potential to reduce the nitrogen fraction of sewage sludge on-site. Even though the proposed components of the system are very basic, a complete cost analysis needs to be conducted to determine the economic feasibility of the proposed system.
References
APHA (1995) Standard Methods for the Examination of Water and Waste Water (19th edn.). American Public Heath Association, Washington DC. [ Links ]
BALMELLE B, NGUYEN KM, CAPDEVILLE B, CORNIER JC and DEGUIN A (1992) Study of factors controlling nitrite build-up in biological processes for water nitrification. Water Sci. Technol. 26(5-6)1017-1025. [ Links ]
BARNES D, BLISS PJ, GOULD BW and VALLENTINE HR (1981) Water and Wastewater Engineering Systems. Pitman Publishing Inc, Massachusetts. [ Links ]
BENEFIELD LD, JUDKINS JF and WEAND BL (1982) Processes Chemistry for Water and Wastewater Treatment. Prentice-Hall, Inc., Englewood Cliffs, New Jersey. [ Links ]
BERNET N, DANGCONG P, DELGENÉS J and MOLETTA R (2001) Nitrification at low oxygen concentration in biofilm reactor. J. Environ. Engineering 127(3)266-271. [ Links ]
BIESTERFIELD S, FARMER G, FIGUEROA L, PARKER D and RUSSELL P (2003) Quantification of denitrification potential in carbonaceous trickling filters. Water Res. 37(16)4011-4017. [ Links ]
CZEMIEL J (2000) Phosphorous and nitrogen in sanitary systems in Kalamr. Urban Water 2 63-69. [ Links ]
DWAF (DEPARTMENT OF WATER AFFAIRS AND FORESTRY, SOUTH AFRICA) (1993) South African Water Quality Guidelines, Vol. 1: Domestic use. Department of Water Affairs and Forestry, Pretoria. [ Links ]
DWAF (DEPARTMENT OF WATER AFFAIRS AND FORESTRY, SOUTH AFRICA) (1996) Water Supply and Sanitation Policy. White paper, Department of Water Affairs and Forestry, Cape Town. [ Links ]
DWAF (DEPARTMENT OF WATER AFFAIRS AND FORESTRY, SOUTH AFRICA) (2002) Sanitation of a healthy nation: The policy on basic household sanitation made easy. Department of Water Affairs and Forestry, Pretoria, South Africa. [ Links ]
DWAF (DEPARTMENT OF WATER AFFAIRS AND FORESTRY, SOUTH AFRICA) (2009) Water Services National Information System. URL: <http://www.dwaf.gov.za/dir_ws/wsnis> (Accessed10 May 2009). [ Links ]
EKAMA GA, MARAIS GvR, SIEBRITZ IP, PITMAN AR, KEAY GFP, BUCHAN L, GERBER A and SMOLLEN M (1984) Manual for the Design and Operation of Nutrient Removal Plants. WRC Report No. TT 16/84. Water Research Commission, Pretoria, South Africa. [ Links ]
FOURIE AB and VAN RYNEVELD MB (1993) Environmental Impact of On-site Sanitation: A Literature Review with Particular Application to South Africa. WRC Report No. KV 57/94. Water Research Commission, Pretoria, South Africa. [ Links ]
FOURIE AB and VAN RYNEVELD MB (1995) The fate in subsurface of contaminants associated with on-site sanitation: A review. Water SA 21(2)101-111. [ Links ]
GEIGY JR (1962) Documenta Scientific Tables (6th edn.). S.A. Basle Switerland. [ Links ]
GRADY CPL and LIM HC (1980) Biological Treatment Processes. Marcel Dekker, Inc, New York. [ Links ]
KELLER G and WARRACK B (2000) Statistics for Management and Economics (5th edn.). Duxbury Thomson Learning, New York. [ Links ]
LANCE JC (1972) Nitrogen removal by soil mechanisms. J. Water Pollut. Control Fed. 44(7)1352-1361. [ Links ]
IWAI S and KITAO T (1994) Wastewater Treatment with Microbial Films. Technomic Publishing Co., Inc., Lancaster. [ Links ]
LEWIS WJ, FOSTER SS and DRASER BS (1980) The Risk of Groundwater Pollution by On-site Sanitation in Developing Countries. A Literature Review. International Reference Centre for Waste Disposal. IRCWD Report No. 01/82. Duebendorf. [ Links ]
MAURER M, PRONK W and LARSEN TA (2006) Treatment processes for source-separated urine. Water Res. 40(17)3151-3166. [ Links ]
McNEVIN D and BARFORD J (2001) Inter-relationship between adsorption and pH in peat biofilters in the context of cation-exchange mechanism. Water Res. 35(3)736-744. [ Links ]
METCALF and EDDY INC. (2003) Wastewater Engineering, Treatment, Disposal and Reuse (4th edn.). McGraw-Hill, New York. [ Links ]
MILLER R and WIDEMAN O (1956) Bestimnung des Nitrat-Ions in Wasser. Wasser 22 2471. [ Links ]
MONTAGERO A and STRAUSS M (2002) Faecal sludge treatment. URL: <http://www.eawag.ch/organisation/abteilungen/sandec/publikationen/publications_ewm/downloads_ewm/IHE_lecture_notes.pdf (Accessed 27 November 2008). [ Links ]
NIELSEN LP, CHRISTENSEN PB, REVSBECH NP and SqRENSEN J (1990) Denitrification and oxygen respiration in biofilms studied with a microsensor for nitrous oxide and oxygen. Microb. Ecol. 19 63-72. [ Links ]
NIELSEN PH (1996) Adsorption of ammonium to activated sludge. Water Res. 30(3)762-764. [ Links ]
NISHANTHA FERNANDO WAR, XIA K and RICE CW (2005) Sorption and desorption of ammonium from liquid swine waste in soils. J. Soil Sci. Soc. Am. 69 1057-1065. [ Links ]
ORHON D and ARTAN N (1994) Modeling of Activated Sludge Systems. Technomic Publishing Co., Inc., Lancaster. [ Links ]
POLLICE A, TANDOI V and LESTINGI C (2002) Influence of aeration and sludge retention time on ammonium oxidation to nitrite and nitrite. Water Res. 36(10)2541-2546. [ Links ]
SHUVAL HI and GRUENER N (1977) Infant methemoglobinemia and other health effects of nitrates in drinking water. Prog. Water Technol. 8(4-5)183-193. [ Links ]
TERBLANCHE APS (1991) Health hazards of nitrate in drinking water. Water SA 17(1)77-82. [ Links ]
TURK O and MAVINIC DS (1989) Maintaining nitrite build-up in a system acclimated to free ammonia. Water Res. 23(11)1383-1388. [ Links ]
WATES, MEIRING & BARNARD (PTY.) LTD (2002) Guidelines for the Application of Natural Stone Trickling Filters with some Reference to Synthetic Media Trickling Filters. WRC Report No. TT 178/02. Water Research Commission, Pretoria, South Africa. [ Links ]
WATER POLLUTION CONTROL FEDERATION (1983) Nutrient Control. Manual of Practice FD-7: Facilities Design. WPCF, Alexandria. [ Links ]
WIK T (1999) Adsorption and denitrification in nitrifying trickling filters. Water Res. 33(6)1500-1508. [ Links ]
Received 2 October 2009; accepted in revised form 21 April 2011.
* To whom all correspondence should be addressed. +2712 382 6234; fax: +2712 382 6256; e-mail: coetzeemaa@tut.ac.za

