


Services on Demand
Article
 English (pdf)
 Article in xml format
 Article references
Indicators

Related links
-
 Cited by Google
 -
 Similars in Google
Share

 Permalink
Water SA
On-line version ISSN 1816-7950
Print version ISSN 0378-4738
Water SA vol.37 n.2 Pretoria Apr. 2011
Influence of irrigation on the level, salinity and flow of groundwater at Vaalharts Irrigation Scheme
PMJ VerweyI,*; PD VermeulenII
IDepartment of Agriculture Forestry and Fisheries, Agricultural Engineering Services, Private Bag X 515, Silverton 0127, South Africa
IIInstitute of Groundwater Studies, University of the Free State, PO Box 339, Bloemfontein 9300, South Africa
ABSTRACT
In 1934, Act No. 38 of 1938 was approved, providing permission to construct the Vaal Dam and develop the Vaalharts Irrigation Scheme There are currently 1 200 plots varying in size from 25 to -75 ha and covering a total area of 35 302 ha. Water logging and salinisation are being experienced, leading to research being initiated in the area. The area researched stretches from Jan Kempdorp in the south to Taung (the Dry Harts River) in the north. A sampling network of 246 piezo-meters was installed to monitor the water levels and electrical conductivity (EC) over a period of 1 year. It was found that the leaching requirement to ensure sustainable irrigation is 611.5 mm/a. According to the water balance this requirement is 562 mm/a. Salt deposited through irrigation water amounts to 4.65 t/ha per annum. The total dissolved salts (TDS) aver aged 1 005 mg/ℓ in 1976 and 1 350 mg/ℓ in 2004, an average increase per annum of 13 mg/ℓ. At the time of this research TDS was 1 476 mg/ℓ, representing an increase of 96 mg/ℓ in 5 years, an average increase per annum of 19.25 mg/ℓ. Irrigated salt deposits not drained build up in the soil at a rate of 0.8 t/ha per annum. Results of this study suggest that upgrading of all infrastructure is essential. Suitable internal subsurface drainage should be cleaned, unsuitable drainage replaced and spacing decreased to drain the area more effectively. Effective drainage would minimise the salt build-up in the soil, have a positive influence on the sustainability of irrigation farming and improve crop yields and quality in the area. The drained water can be reticulated into an evaporation pond to confine the salt mass, thus preventing it from influencing the environment and other activities downstream.
Keywords: Drainage, irrigation and scheduling, soil water quality, water and salt balance
Introduction
Vaalharts Irrigation Scheme
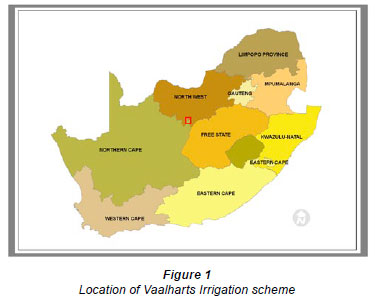
In 1934 Government gave permission to construct the Vaal Dam and to develop the Vaalharts Irrigation Scheme. The water for the scheme is diverted from a weir in the Vaal River (24º55'30'E; 28º06'54'S), ± 6.5 km east of Warrenton (Fig. 1). The first farmers received their plots in 1938. Today there are 1 200 plots that vary in size from 25 to 75 ha and cover a total area of 35 302 ha, which includes 31 732 ha in the Northern Cape and 3 570 ha in the North-West Province. Waterlogging and salinisation problems have been experienced in the area. To remedy the problem, a main subsurface drainage system was installed in 1972; the feeder canals were also lined with concrete. In 2000 approximately 50% of the plots did not have proper discharge points for the drained water, although ± 80% do have internal subsurface drains (Van Niekerk, 2009).
The Vaalharts Irrigation Scheme is the largest and oldest of its kind in the country. The sustainability of the scheme is very important; it provides a farming livelihood and job opportunities for many people, contributing significantly to national food security. Intensive farming on irrigation land and especially on sandy soil (aeolian soil), such as that in the Vaalharts area, makes the application of fertilisers very important to ensure profitable crops. Unfortunately, over-fertilisation has a deteriorating effect on natural resources.
Several studies have been conducted in the Vaalharts Irrigation Scheme area to determine the influence of the irrigation on groundwater. The study by Herold and Bailey (1996) claimed that salts are accumulating in the groundwater sources below the area by leaching through the upper soils. The study also indicated the possibility of a salt sink, mainly due to a perched water table. At some stage, the sink will be exhausted and have severe effects.
A study Ellington et al. (2004), on the other hand, indicated that water levels do not differ more than a few centimetres in deep and shallow water systems. The water quality profiled in piezometers indicated no major stratification of groundwater, and the deep aquifer does not perform separately. If the net storage of the aquifer remains the same, the TDS increase will be in the order of 14 mg/ℓ per annum. The irrigation water is the greatest contributor to the groundwater system and contributes much more to the salt load than fertilisers do.
Salinisation and irrigation
Salinisation and waterlogging of irrigation schemes is a well researched field throughout the world. Groundwater pollution due to increasing salinity of soils used for agricultural irrigation practices is very common. Several studies have been conducted in order to propose remediation procedures, with varying degrees of success (Alemi and Faria, 2001; Heuperman et al., 2002; Smith et al., 2006).
Salinisation is the build-up of salt that is soluble in water in the top part of soil (including the A and B horizons), to such an extent that it influences agriculture, the economy and livelihoods. Soil is considered to be saline if the EC of its saturated extract reaches 400 mS/m. Salinisation due to sodium salts can enhance the formation of sodic soils when other salts leach from the soil profile. Salt-affected soils are often waterlogged, although only periodically in some cases. The interaction between hypoxia and salt has a powerfully depressive effect on plant growth (Rengasamy, 2006).
When the soil becomes parched due to evapotranspiration, it may cause an increasing osmotic effect; low osmotic potential can reduce water uptake by plants and affect production. Plants can absorb water from soil with moisture content as low as 5% when there is no salt content. In contrast, an EC of 100 mS/m will restrain a plant from absorbing water, only allowing such uptake from certain soil types with a moisture content of at least 18% (Rengasamy, 2006).
Effective irrigation in combination with effective drainage is the only way to prevent salinisation of land. A water table of ± 2.5 m below ground level must be obtained and managed. There are several methods to drain soils, for example perforated pipes, open ditches and pumping wells. Saline water must then be disposed of in an environmentally-friendly way. Prevention of salinisation is however better than cure, because it can take years to rehabilitate salinised soils due to the slow movement of salts in soil water compared to surface water.
Aims
The aims of the research were to:
• Determine the influence of irrigation and drainage on the level and salinity of groundwater in the upper zone (0-3 m) of the soil
• Investigate if the direction of the flow path of groundwater in the upper zone is towards the Harts River
• Perform tests and field investigations to determine the physical properties of the upper zone
• Construct a conceptual model to determine the drainage need
• Conduct water and salt mass-balance calculations
Materials and methods
Overview of study
The groundwater levels and chemical parameters were monitored by installing a network of piezometers. Monitoring took place over a period of a year to cover all seasons; planting, harvesting, rainy and dry periods. The hydraulic gradient was established and the existence of any stratification in the upper soils determined to construct conceptual models.
In order to accomplish the abovementioned investigations, the following steps were taken:
• Conducted a literature review and obtained background information on the existing scheme and previous studies conducted in the area
Installation of a piezometer network
• Fieldwork monitoring groundwater levels and piezometer electrical conductivity (EC) profiling
• Analysing groundwater levels and EC
• Monitoring drains on selected sites
• Profiling and testing of aquifer parameters
• Conceptual modelling to test the salt flow paths
• Evaluation of options to ensure sustainable irrigation
Study area
The investigation covered the area from Jan Kempdorp in the south to Taung (the Dry Harts River) in the north.
Land type and geology
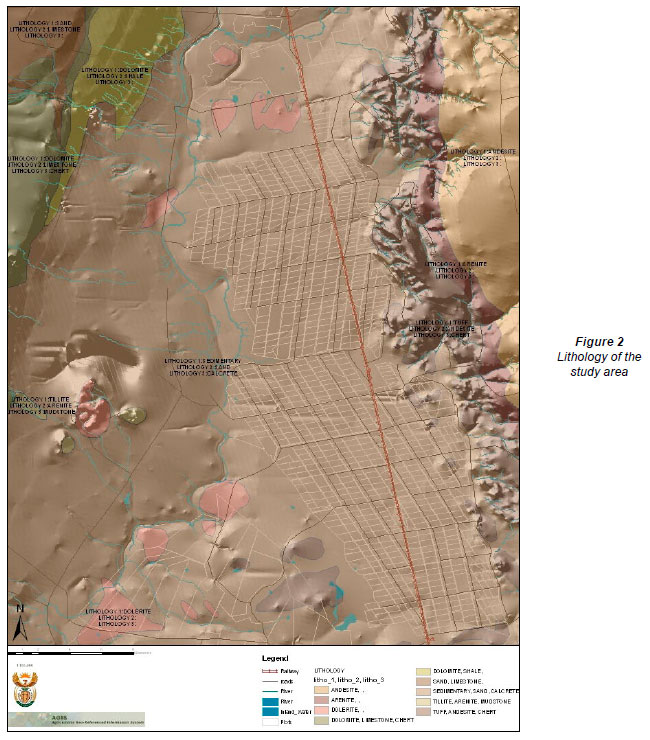
The irrigation area is situated in a glacial valley which is drained by the Harts River. The altitude ranges from 1 050 to 1 175 m a.m.s.l., changing towards the west. The map pro vides a good idea of the topography (Fig. 2; AGIS, 2009). The irrigation scheme is predominantly flat, as 70% of the area comprises slopes of less than 1%. The lithostratigraphy clas sification of the area was named as the Bothaville Formation, Rietgat Subformation. The Rietgat Formation in the Taung-Jan Kempdorp area is known as the Phokwane Formation of the Hartswater Group. The Phokwane Formation mainly consists of porphyrite lava, volcanic tufa, tuffaceous sediments and chert (Schutte, 1994).
Surface run-off, rainfall, temperature and evapotranspiration
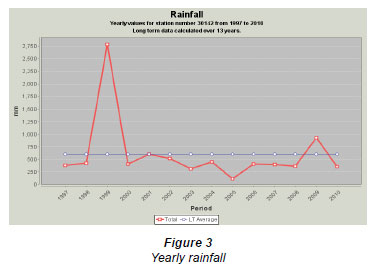
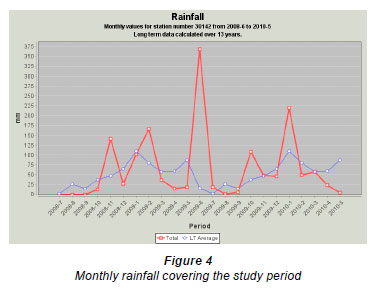
The median annual simulated run-off in the area is in the range of 20 to 41 mm, with the lowest 10-year recording at 4.8 to 9.3 mm (Schmidt et al., 1987). The rainy season for the area is usually from October to March. In the winter months, almost no rainfall occurs. The average rainfall in the area is 477 mm in Jan Kempdorp and 450 mm in Taung (Figs. 3 and 4, AGIS, 2009). The average temperature of the spring and summer months is above 30ºC and usually highest in February. Evapotranspiration due to the application of irrigation water, higher rainfall and plant growth in this month are high. The importance and relevance of evapotranspiration refers to the calculation of water use by a plant during a given season. The total average evapotranspiration for the crops planted in the study area for the period of study was 1 030 mm (Fritz, 2009) taking the growth cycle of the 2 most planted crops (maize and wheat) into consideration this figure can be reworked to 774 mm for the research period.
Soils
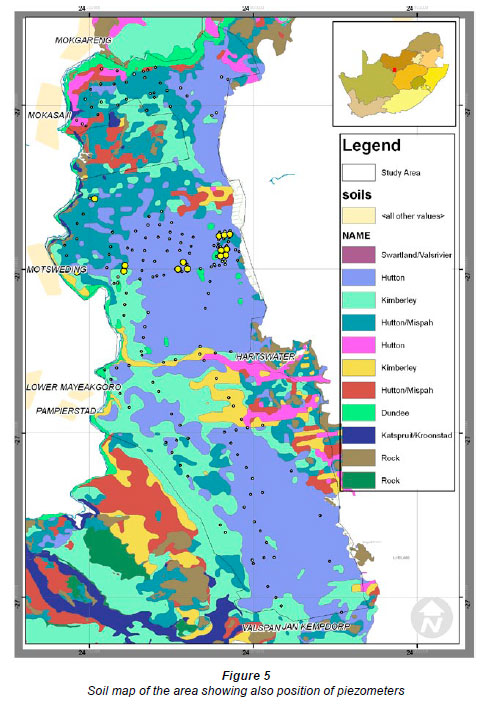
The soils in the area are alluvial and described as Kalahari Sand (Hough and Rudolph, 2003) (Fig. 5). The soil layer is more than 3 m deep in this area. Soil types found in the study area are: Hutton, Kimberley, Hutton/Mispah, Dundee and Katspruit/Kroonstad (Barnard, 2008). On average soil mainly consists of 75% sand, 10% silt and 15% clay.
The 2 qualities of soil that are important for irrigation include the ability of the soil to hold water and the availability of this water to plants. Sandy soils have coarse particles with a small surface area, and hold little water compared to clay. Sands drain easily and little water is available as field capacity; irrigation can raise the soil moisture to field capacity.
Infrastructure, irrigation methods and crop types
Irrigation water is relayed to the plots on the Vaalharts and Taung Irrigation Schemes through an extensive network of open channels, siphons and pipes. The main canal is 18.4 km long; it splits into the northern canal, which is 82 km long and serves 33 400 ha, and the western canal, which is 22 km long, serving 4 800 ha. The water reaches the plots by means of feeder (45 km) and tertiary (580 km) canals. There are 5 balancing dams on the scheme. Farmers also make use of overnight dams to enable them to irrigate when the canal is dry and to assist with scheduling. The average size of an overnight dam is 3 600 m3.
A wide variety of fruits, nuts and crops is planted in the area throughout the year. Pecan nuts, peanuts, citrus and olives are exported to the USA, Europe and Japan. Other cash crops include wheat, maize, cotton, grapes, potatoes, oats and lucerne.
Vaalharts is the oldest irrigation scheme in the country and some of the farmers still make use of flood irrigation. Many farmers have changed to other practices like centre irrigation pivots and drip, due to the greater effectiveness of these systems.
Field study and geohydrological data collection
Installation of a piezometer grid
To be able to monitor and measure parameters of groundwater in the top layer of the soil, a network of piezometers was installed between Jan Kempdorp and Taung. The entire casing is slotted, enabling groundwater monitoring from zero (0) m b.g.l. (metres below ground level) to a depth of 3 m b.g.l.
The purpose of the piezometer grid was to collect as much data as possible, covering as large an area as possible. An area of 29 400 ha was covered, of which 3 400 ha is in Taung. A total of 246 piezometers were installed and surveyed; 84 in Block K, 61 in Taung and 102 to create a network over the remainder of the research area.
When determining the positions of the piezometers, the following factors were taken into consideration; irrigation type, land usage (cash or annual crops), drainage, soil type, interpolation possibilities and previous research.
Water level and electrical conductivity monitoring
Monitoring took place from August 2008 till May 2009 and was carried out 4 times over this period to cover all seasons and irrigation periods. Although 208 (some were already demolished when the survey started) piezometers had to be measured, all readings were taken within 3 days. Water levels were measured to establish the effect of rainfall, drainage and irrigation on the groundwater level. These levels were also used to generate groundwater contour maps and to determine the groundwater flow directions.
During August 2008, EC profiling for all of the piezometers was conducted at 200 mm intervals. No stratification takes place in the top 3.0 m of the soil. All the EC readings per piezometer were in the same range. EC data were used to generate maps to visualise the EC values and differences in the area.
Results and discussion
Water level contour maps
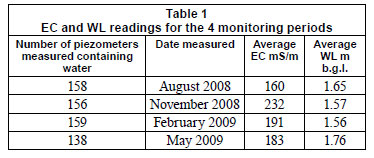
Due to the fact that no stratification exists in the upper 3.0 m of the soil and the EC stabilised at about 0.4 m b.g.l., a decision was taken to take readings at 400 mm below the water table. The following average readings were measured during monitoring (Table 1).
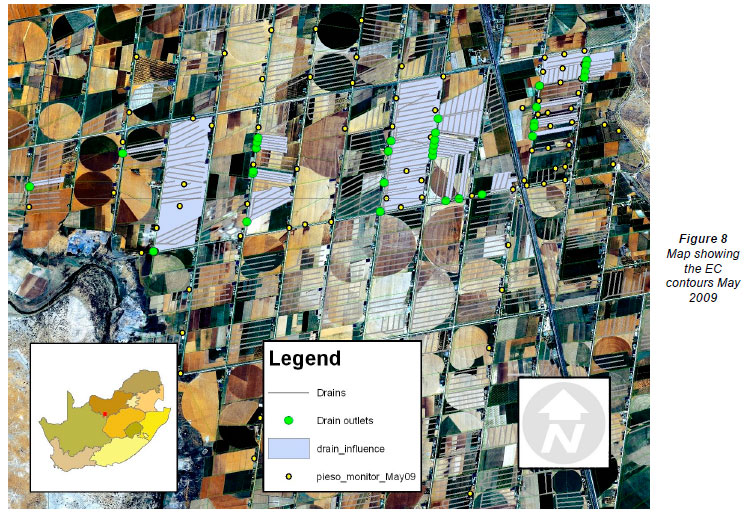
A map was developed to visualise the values of the meas ured EC values (Fig. 7), the coloured dots indicate the range as per SANS 241/2005, the bigger the dot the higher the value. A contour map was also developed to assist in visualisation of the data (Fig. 8).
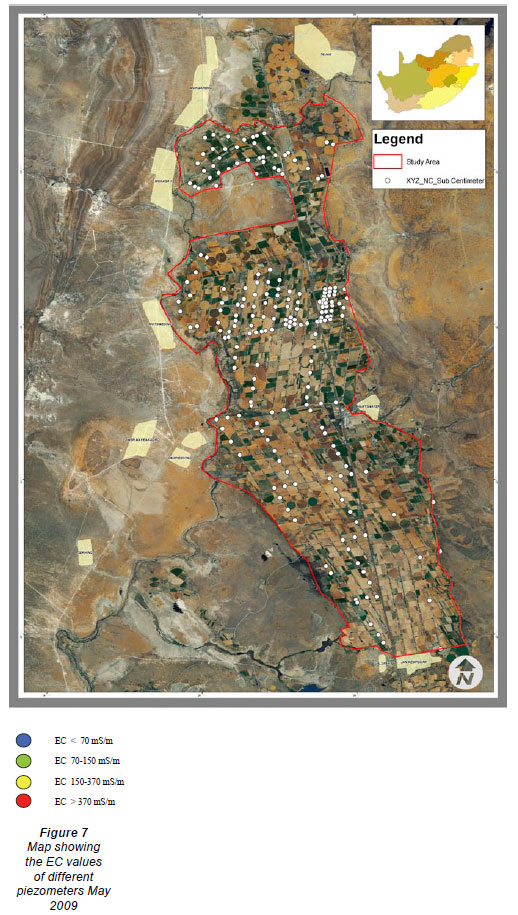
The ECs were lower than most plants can tolerate, but much higher than the 60 mS/m of the irrigation water. Although there are differences in the water levels, the trends are generally the same.
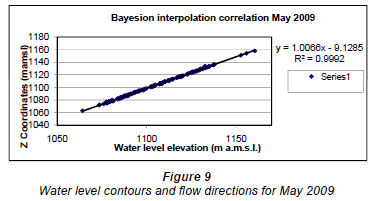
To establish if the Bayesian interpolation method could be used to interpolate groundwater contours, the correlation between the surface and water levels must be 80% or more. The data of the installed piezometers were used as reference groundwater heights. The correlations were above 90% during all the monitoring periods - see Eq. (1) representing the values for May 2009.

Groundwater levels were interpolated and contours and flow lines developed.
The general groundwater flow direction is the same as that of the surface water towards the Harts River. The direction change at the south-west border is a result of the artificial barrier imposed by the programme utilised.
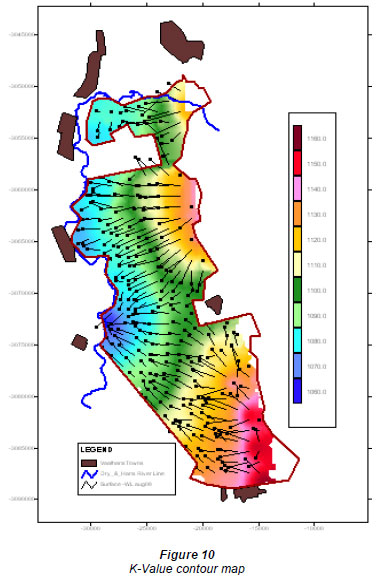
Hydraulic conductivity (K)
The K-value was determined by means of field tests. The groundwater was pumped or bailed out of the piezometers and the return flow was measured. Hooghoudt's method was used to rework the figures and determine the K in m/d. These values were used to develop a K-value contour map.
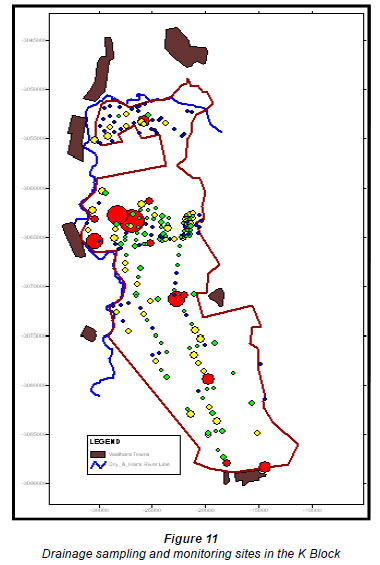
Drainage
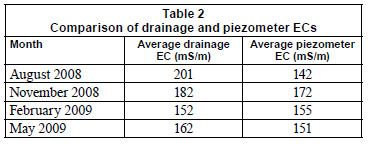
Electrical conductivity and flows of the drainage water were monitored at outlets in Block K to determine the effectiveness of the system. The average EC of the water measured at the same drains in Block K during August 2008 was compared to the EC of the groundwater in the piezometers in Block K. The comparison of the EC of the drainage water and that measured for the piezometers (average) in the areas drained by these drains showed that, on average, the EC of drainage water is 20% higher. This indicated that the drainage is not effective and a salt build-up takes place at the drainage depth.
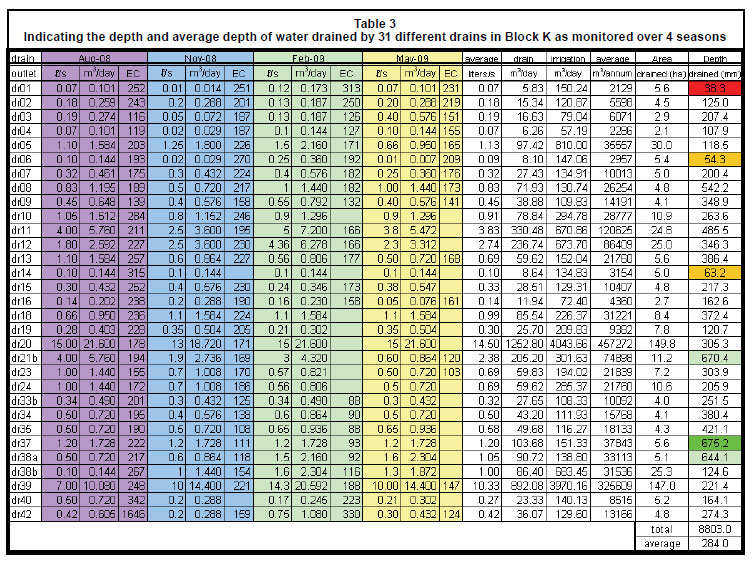
The drainage flows were also measured at the drain outlets to determine how effective the drainage system still is. The area served by each outlet was determined and the average flow recalculated to cubic metres per annum. Dividing the m3/a by the area in m2 and multiplying it by 1 000 gave an answer in millimetres, a depth of water drained which was compared to the drainage need. The design value of the area used is 3 mm/d (Van Niekerk, 2009), which is 1 095 mm/a. These subsurface drains were installed at double spacing therefore at single spacing should drain 547 mm/a.
The best result was found at drain Outlet dr37 which was 675.2 mm/a in depth with an average EC of 147 mS/m, which can be interpreted as an effective drain (Table 3, next page). In contrast with this Outlet dr01 only drains 38 mm/a in depth with an average EC of 250 mS/m. Where good drainage exists the EC values of the drainage water tend to be lower, implicating that the salts are drained and do not accumulate, emphasising the importance of subsurface drainage that is in a good working condition.
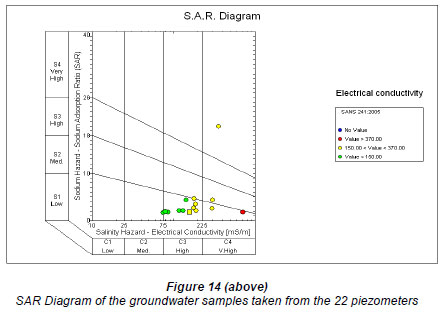
Chemical properties
Samples were taken at 22 sites representing boreholes, drainage outlets, piezometers and the feeder canal. The samples were chemically analysed by the IGS laboratory to determine SAR and Hardness. These values were plotted on an SAR diagram to establish whether the soil is still suitable for irrigation farming. All the samples recorded a high to very high salinity index. The electrical conductivities are mostly within the 60-250 mS/m range. Most of the soil is suitable for irrigation farming.
To be able to convert the EC reading to total dissolved salts the EC and TDS of the 22 samples were plotted on a diagram to find a trend to determine the conversion factor. The conversion factor is necessary to determine the amount of salt in tons that is being deposited by the irrigation water, to be used in the salt water-balance calculation. The conversion factor is calculated by:

Numerical model
A model was set up to simulate the drains in Block K to compare the values with those measured during monitoring. The purpose of this was to estimate the water budget or outflow to establish whether the drains are adequate and functional.
The water budget was determined for 57 zones. These zones represented the areas drained and measured at certain drainage outlets. These zone outflows were compared to the drainage outflows that were measured on 4 occasions during the monitoring period. The values of 13 of the drainage outflow measuring positions and 21 of the drain zones (that represented the same areas) were used for the comparison (Table 4).
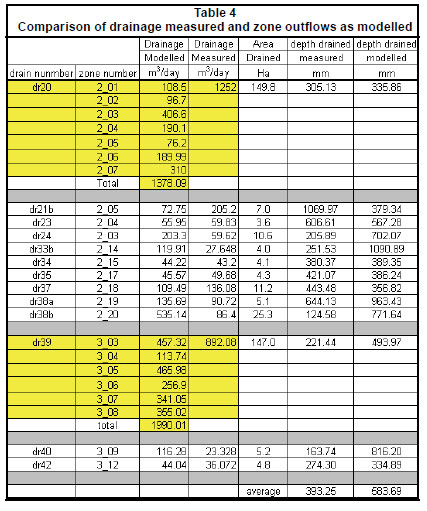

The best correlation was at drain Outlet dr20 serving zones 2_1 to 2_7. The difference was only 30.7 mm for a period of a year. The largest difference was 839 mm and the measured value was 23% of the 1 090 mm/a modelled. On average the drainage outflows measured were 67.4% of the modelled average of 583.7 mm/a.
Summary of water and salt balance
Salt balance
The average EC for the piezometers was 181 mS/m and for the irrigation water 66 mS/m for the period monitored. The evapotranspiration was 4.3 mm/d and the effective rainfall 1.18 mm/d; therefore the leaching requirement is 1.4 mm/d.
Water balance
The drainage demand is not met, and water by-passes the subsurface drainage, and drains towards the Harts River. This water is not drained by the river as surface water due to the fact that the drainage level is lower than the riverbed. The average drainage in Block K was 0.8 mm/d. This is supported by the fact that the average EC of the drain water was higher than that measured in the piezometers in the cultivated lands.
Conclusions
The following conclusions can be drawn from the results of this study:
• Vaalharts is in a glacial valley, therefore the topographic gradient of the scheme is predominantly flat, 70% of the area comprises of slopes of less than 1%. This minimises the surface runoff and maximises the effectiveness of irrigation in the area. The median annual simulated runoff in the area is in the range of 20 to 41 mm. The rainfall for the monitoring period of a year was 530 mm. The total evapotranspiration for the area that is predominantly planted with cash crops was 774 mm over the research period.
• The EC tolerances for wheat, maize and lucerne are 170, 200 and 600 mS/m and the average measured in the piezometers was 191 mS/m; thus emphasising the salinity threat.
• A total of 210 piezometers (43 in Taung, 74 in Block K and 91 in the rest of the research area) were constructed to a depth of 3 m b.g.l., surveyed and geo-referenced for monitoring purposes. The interpretation of an EC log taken at 200 mm intervals in all of the piezometers showed that there is no cross flow and thus no stratification.
• EC of the groundwater in the top 3.0 m for the 4 seasons was 160, 232, 190, and 183 mS/m. The average of 191 mS/m is lower than most plants can tolerate, but is much higher than the 66 mS/m of the irrigation water.
• Average groundwater level for the piezometers monitored was 1.65, 1.57, 1.56 and 1.76 m b.g.l. Although there were differences the trends were much the same with an average of 1.63 m b.g.l.
• The K values varied between 0.013 and 5.4 m/d
• The average ECs of drainage in the K Block were 201, 182, 152 and 162 mS/m with an overall average of 174 mS/m. The average EC in the piezometers in Block K during the same time frame was 155 mS/m. This difference of 11% indicates a salt build up and non-effective drainage.
• Continuous irrigation with water containing a SAR value >10 has detrimental effects on the crops. Samples taken in the area have a salinity index of high to very high but only one, m21, had a SAR of more than 10.
• Drainage canals need to be cleaned up, as the sand deposits in them lead to a build-up of drainage water that leads to the submerging of drainage outlets prohibiting outflows. On average the drainage outflows measured were 67.4% of the modelled average of 583.7 mm/a.
• The finding of this research is that the EC in the upper 3.0 m of soil averages 191 mS/m, thus representing a TDS level of 1 476 mg/ℓ. This indicates an increase of 96 mg/ℓ in 5 years, an average increase per annum of 19.25 mg/ℓ, an indication that some of the salts remain in the upper 3.0 m layer.
• The leaching requirement to maintain the salt balance was 611.5 mm/a. This compared well with the 583.7 mm/a modelled. The measured drainage average was 284 mm/a indicating that the drainage is not effective. A subsurface flow depth of 8 m was calculated at the piezometer at the b12 position. The EC of the groundwater in this area was high during the entire monitoring period. Values of 660, 1 000, 841 and 711 mS/m were measured. The clay content was 28%, emphasising why a salt built-up is taking place in the area and will build up in similar scenarios.
• The leaching requirement is 1.67 mm/d which is only 0.13 mm/d more than the 1.54 mm/d calculated for the water balance. The groundwater level in the area is stable. However, the average leaching requirements of 298 mm/a are not met by the measured drainage; therefore, it appears that water is by-passing the subsurface drainage system to enter another storage - if this were not the case the groundwater level would have risen rapidly.
• Incoming salts through irrigation per annum are 4.65 t/ha; irrigation salt not drained per annum is 0.8 t/ha.
Acknowledgements
We thank the Water Research Commission, for funding and supporting the project, the Institute for Groundwater Studies at the University of the Free State, and the Directorate: Agricultural Engineering Services of the Department Agriculture Forestry and Fisheries.
References
AGIS (Agricultural Geo-Referenced Information System) (2009) URL: www.agis.agric.za. [ Links ]
ALEMI MM and FARIA J (2001) Water Facts No. 20, Salt Balance in the San Joaquin Valley. DWR Bulletins & Reports, Sacramento. [ Links ]
BARNARD JH (2008) Personal communication, October 2008. Lecturer, Department of Soil Crop and Climate Sciences, UFS, Bloemfontein. [ Links ]
DE JAGER AM and MARAIS AH (1994) SAICE Journal, first Quarter 1994, Technical Paper, Die Aanloop tot die Vaalharts besproeiingsskema. 6-12. [ Links ]
ELLINGTON RG, USHER BH and VAN TONDER GJ (2004) Quantification of the Impact of Irrigation on the Groundwater Resource in the Vaalharts Irrigation Scheme. WRC Report No. 1322/2/04. Water Research Commission, Pretoria. [ Links ]
FRITZ M (2009) Personal communication, December 2009. Agrometeorolgy, Agricultural Research Council, Institute for Soil, Climate and Water, Potchefstroom. [ Links ]
HEROLD CE and BAILEY AK (1996) Long Term Salt Balance of the Vaalharts Irrigation Scheme. WRC Report No. 420/1/96. Water Research Commission, Pretoria. [ Links ]
HEUPERMAN AF, KAPOOR AS and DENECKE HW (2002) Biodrainage: principles, experiences and applications. IPTRID Secretariat, Food and Agriculture Organization of the United Nations, Rome. [ Links ]
HOUGH, JJH and RUDOLPH, DC (2003) Vaalharts Groundwater Protocol for on-site sanitation. Report fr VKE Engineers, by GHT. GHT Consulting Report No. RVN 331.1/482. [ Links ]
RENGASAMY P (2006) World salinisation with emphasis on Australia. J. Exp. Bot. 57 (5) 1017-1023. [ Links ]
SCHMIDT EJ, SCHULZE RE and DENT MC (1987) SCS Based Design Runoff. WRC Report No. 155 TT 32/87. Water Research Commission, Pretoria. [ Links ]
SCHUTTE IC (1994) The Geology of the Christiana Area. Explanation of Sheet 2724 Scale 1:250 000. Council for Geoscience, Pretoria. [ Links ]
SMITH AJ, POLLOCK DW and PALMER D (2006) Groundwater Management Options to Control Rising Groundwater Level and Salinity in the Ord Stage 1 Irrigation Area, Western Australia CSIRO Land and Water Affairs Science Report No. 70/06. [ Links ]
VAN BEERS WFJ (1983) The Auger Hole Method. International Institute for Land Reclamation and Improvement ILRI, Wageningen, Netherlands. [ Links ]
VAN NIEKERK CS (2009) Personal communication, February 2008. Deputy Director, Northern Cape Provincial Department of Agriculture, Jan Kempdorp. [ Links ]
Received 31 March 2010; accepted in revised form 1 February 2011.
* To whomall correspondence should be addressed. +2712 846 8535; fax: +2712 846 8528; e-mail: flipv@daff.gov.za

