


Servicios Personalizados
Articulo
 Inglés (pdf)
 Articulo en XML
 Referencias del artículo
Indicadores

Links relacionados
-
 Citado por Google
 -
 Similares en Google
Compartir

 Permalink
Water SA
versión On-line ISSN 1816-7950
versión impresa ISSN 0378-4738
Water SA vol.37 no.1 Pretoria ene. 2011
TECHNICAL NOTE
River modelling to infer flood management framework
Darrien Yau Seng MahI,*; Ching Poon HiiII; Frederik Josep PutuhenaII; Sai Hin LaiIII
IRiver Engineering and Urban Drainage Research Centre (REDAC), Universiti Sains Malaysia, Engineering Campus, Seri Ampangan, 14300 Nibong Tebal, Penang, Malaysia
IIDepartment of Civil Engineering (Water & Environment), Faculty of Engineering, Universiti Malaysia Sarawak, km-17 Kuching Samarahan Expressway, 94300 Kota Samarahan, Sarawak, Malaysia
IIIDepartment of Civil Engineering, Faculty of Engineering, Universiti Malaya, 50603 Kuala Lumpur, Malaysia
ABSTRACT
River hydraulic models have successfully identified the weaknesses and areas for improvement with respect to flooding in the Sarawak River system, and can also be used to support decisions on flood management measures. Often, the big question is 'how'. This paper demonstrates a theoretical flood management framework inferred from Sarawak River modelling outputs. The river model simulates the movement of flood waters through river reaches. Information on flood levels and overtopping of embankments is used to guide a flood early warning system. The above-mentioned elements were combined in a logical framework that showed logic sequences and impact indicators for improved flood relief activities in the city of Kuching, Malaysia.
Keywords: Flood, framework, InfoWorks RS, logframe, river modelling
Background
The Sarawak River system has been the subject of numerous studies, due to the location of Kuching, the capital of Sarawak State, Malaysia, within the basin. The state government has invested huge amounts of resources and time in researching the river. Two very important outputs of those funded projects have been the topographical and hydrological data essential to river modelling (Dyhouse et al., 2003). Without these data, investigations aimed at understanding the hydrological behaviour of the Sarawak River would be futile. Earth surface data represented the elevation, profile curvature, flow path length, upslope area and conveyance capacity of the river. Hydrological data represented the meteorological and rainfall-runoff mechanism (Yu et al., 1999). However, as it is difficult to imagine the effects of these factors, a river computer model is useful in enabling visualisation of the system (Liang and Molkenthin, 2001; Sinnakaudan et al., 2003). The modelling outputs support decision making (Hämäläinen et al., 2004; Oxley et al., 2004) and can be used, as in this study, to formulate a flood management framework.
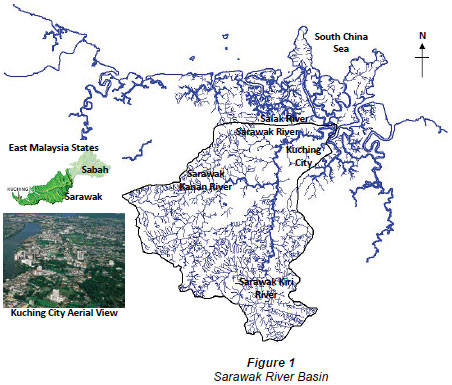
The Sarawak River (see Fig. 1) rises in the Bungoh Ranges to the south of Kuching city, at the border with Indonesia, meanders across a wide coastal floodplain and through the capital city before discharging into the South China Sea. The river basin has an area of approximately 1 430 km2 and a stream length of about 120 km, which consists of 2 principal tributaries, namely, Sarawak Kanan River and Sarawak Kiri River. The 2 tributaries meet near Batu Kitang, some 34 km upstream of Kuching. Kuching city is very flat and low-lying. Parts of the city are susceptible to flooding from fluvial and tidal events. The average annual rainfall in the catchment is about 3 800 mm (Memon and Murtedza, 1999).
On the eastern edge of the city, the Sarawak River divides, and prior to 1998 2 exits to the sea to the sea existed, on the Sarawak River and Santubong River. In order to protect the city, the Sarawak State Government blocked the 2 rivers and allowed only 1 outlet to the sea, via the Kuching Barrage, aimed at controlling the river and tidal flows (KTA Consulting Engineers, 1994). The river flow was modified from the natural tidal regime to a regulated flow, by means of a system of gates constructed along a land isthmus just downstream of Kuching city (Sharp and Lim, 2000). However, the opening and closing of barrage gates for flushing, de-siltation and navigation, was operated in such a way as to allow a certain degree of tidal influx into the Sarawak River system. Tidal effects were significant till the river confluence at Batu Kitang.
After the completion of the barrage, and with the downstream flow regime altered, major floods took place in February 2003, January 2004 and January 2009. To further mitigate the flooding problems, the state government announced the construction of an 8 km flood bypass channel from Kpg Paroh to Salak River (Jurutera Jasa Consulting Engineers, 2006). Sarawak River would be cut off by a second barrage. These facilities are expected to be in full operation by 2015, at which time the Sarawak River will be separated into lower and upper rivers.
River modelling
A MWH Soft model, InfoWorks River Simulation (RS) was utilised for modelling the Sarawak River. InfoWorks RS involves tight coupling of GIS functionality and full dynamic flow simulation. Such a model relies profoundly on the accuracy of topographical data (Benito et al., 2004; Sinnakaudan, 2009). The basin-wide digital terrain model (DTM) was derived from 3 sources: a 1:25000 topographical map of urban areas, a 1:50000 topographical map of rural areas and a river corridor survey exercise that produced river cross-sectional profiles at intervals of 1 km in urban areas and 5 km in rural areas. The survey exercise was carried out in 2000 in conjunction with the Sarawak River Mitigation Options Study (Jurutera Jasa Consulting Engineers, 2003). In the absence of more advanced earth-surface observation datasets, the available topographical data was the best available at the time. These were adequate for 1-dimensional (1-D) modelling, as previously indicated by the reports of Jenny et al. (2007) and Salim et al. (2009) on modelling Sarawak River systems.
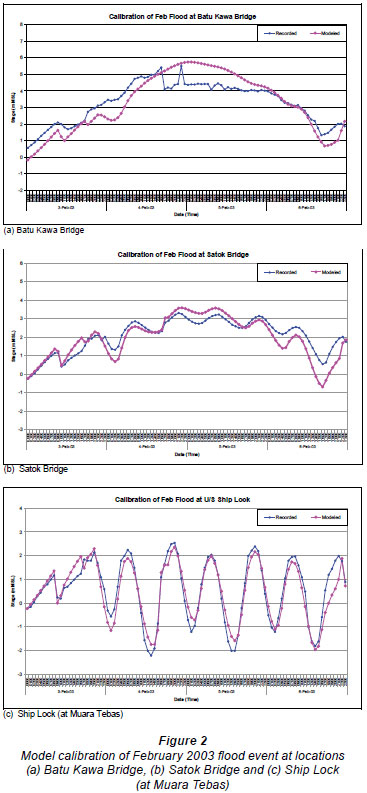
There are 24 hydrological stations along the Sarawak River, which record hourly rainfall and water level data. However, there is no direct measurement of flow data. Rating curves are available for 2 upstream stations, Buan Bidi and Kpg Git, which have been calibrated from time to time (Mah et al., 2007). The 2 upstream ends were treated as Flow-Time Boundaries. The downstream end, at the estuary, was treated as a tidal Stage-Time Boundary. Barrage gates were modelled as radial gates. With these hydrological data, a base river model simulating the existing conditions was calibrated, using channel and floodplain friction as free parameters, against recorded and modelled hydrographs of Sarawak River. A detailed description of the modelling steps can be found in Putuhena et al. (2005-2006) and Mah et al. (2010). As demonstrated in Fig. 2, the matching of the recorded and modelled hydrographs during the February 2003 flood event (DID, 2003) is acceptable, with a correlation coefficient of over 0.80. The calibrated model had been able to mimic the real river behaviours at 80% confidence before any of the intended investigations were begun (MWH Soft, 2008).
The base model, carefully calibrated against discharge for one event, can be utilised to predict discharge, using independent data for the second event, and including the flood bypass channel, a new barrage and tide levels. The bypass was modelled as an extended river channel to Salak River. A tidal Stage-Time Boundary was imposed at the outlet of the bypass.
No gauges were available at Salak River at present. However, a tide table was accessible from the marine department.
The January 2004 flood event was generally quoted as a 100-year flood event (DID, 2004). The event flood flows were run through the developed model. The Sarawak River basin did not have a any documented flood management framework, but has 2 mitigation structures, i.e. the Kuching Barrage and the upcoming flood bypass channel. Model 1 was derived for existing mitigation conditions (Fig. 3), where the Kuching Barrage was included. Model 2 incorporated the flood bypass channel (Fig. 4). Both models enabled the exploration of many engineering solutions.


For purposes of demonstration, Model 2 was utilised to produce an inundation analysis along the river corridor. The river model computed the floodwater level and flood maps at different time steps. It was proposed to extract those data resulting in a rate of floodplain submergence from river bankfull level to a depth of 2 m. Based on the assumption that a normal adult Asian has a height of about 1.6 m, human settlements were known to be close to the river, and most of the village houses outside Kuching were single-storey houses, a flood depth of 2 m was taken as a reference point, beyond which flooding would inflict drowning. Some localities, for example Batu Kawa had recorded a flood level up to 6 m.

This rate would be a reflection of the river flooding severity (see Table 1). The higher the value of this rate, the more vulnerable the location will be to rapidly rising and widespread floodwater. Table 1 presents floodwaters rising from bankfull level to 0.5 m, progressively to 1, 1.5 and 2 m, together with the associated time and affected length. The analysis shows that the Lower Sarawak River is the most vulnerable to flood risk. Kuala Maong and Pending, due to their low elevations, had the fastest time for a 0.5 m water level rise, i.e. less than an hour. Both locations would submerge at a rate of 4-5.8 km/h. The risk along the Upper Sarawak River was ranked as 'moderate' but Batu Kawa demonstrated the widest floodwater spread. Batu Kawa would submerge at a rate of 0.7-1.9 km/h. The upstream tributaries floodplain had a rate of submergence of 0.2-1.8 km/h. These data were fed into a flood management framework to enable decision support.
Flood management framework
A theoretical framework for flood management for Sarawak River system was developed using a systemic approach (Bell and Morse, 1999) known as the Logical Framework or Logframe. Logframe is a management and planning tool which links cause and effect through a hierarchy of objectives (Putuhena and Kusmulyono, 2007). The Logframe comprises of a 4 x 4 matrix. Column 1 provides a narrative summary of activities and objectives. Reading from the bottom, these steps are Activity, Output, Objectives and Ultimate Goal. Each of these has a specific definition and role. Column 2 contains the Objectively Verifiable Indicators (OVI) that provide evidence of the statements in Column 1 of the same row that have been achieved. Column 3 provides the Means of Verification (MOV) by which the OVI are measured, and is equivalent to the monitoring and evaluation system. Column 4 lists the major assumptions, which influence the progression from a lower to a higher row in the framework.
The flow of logic through the framework starts in the bottom left-hand corner at the level of activity and follows a sequence of IF AND THEN statements, as illustrated in Fig. 5. IF the Activities are completed AND the Assumptions hold, THEN the Outputs will be achieved, IF the Outputs are completed, AND the Assumptions hold, THEN the Objectives will be achieved, and so on.

The Ultimate Goal refers to the sectoral objective to which the project is designed to contribute. For this exercise, the Ultimate Goal was to reduce the excessive flood loses along the Sarawak River system. There were 4 strategies identified that needed attention, i.e.:
• New flood map
• Flood early warning system
• Flood relief programme
• Community education.
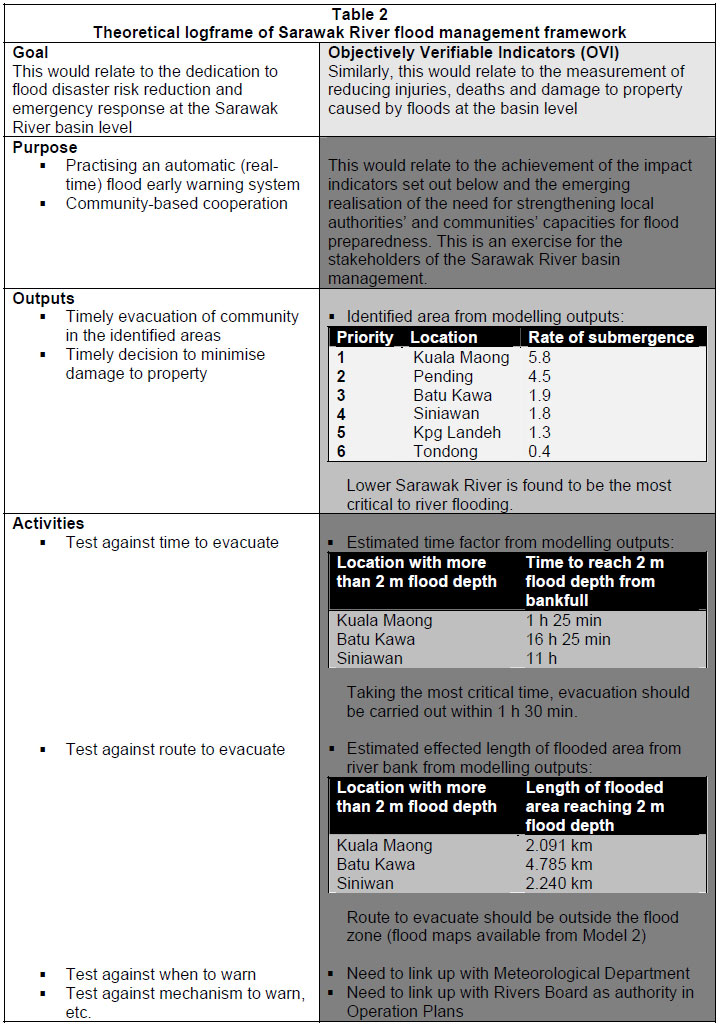
The Goal, Purpose, Outputs and Activities are 4 systemic approaches that are set out (Table 2) in 1 frame, taking into account the necessity of a 'Flood Early Warning System'. For purposes of demonstration, we applied the Logframe to the above-mentioned elements (Goal, Purpose, Outputs and Activities of a flood warning system) in the first column. Reliable detection of flood conditions was a critical component of an effective local flood warning programme (Pappenberger et al., 2008). In order to assist with this, modelling outputs were included in the second column as indicators.
This had contributed substantially (as exhibited in Table 2) to identifying the priority areas most likely to need emergency notification, critical time for evacuation, and the most effective route for relief. For example, Kuala Maong was predicted, based on a 100-year flood, to be submerged to the critical 2 m level of floodwater in 1 hour 25 min, with, on average, less than half an hour for each water rise of 0.5 m. This is a short duration of time which should warrant greater attention from the authorities. The map showing the extent of flooding per 0.5 m level rise can identify the affected households and thus separate them into zones and plan an appropriate evacuation strategy. Questions which need to be answered include: who is in the most critical zone if floodwaters were to rise continuously for the first 30 min, where should they go, how much time do they have, which agency is responsible, etc. These questions were provided with guidance. These were the data offered to support decision making, and dissemination of such information would enable its use in formulating action plans, thus allowing the responsible parties to take rapid action.
Concluding remarks
As flooding continues to affect a greater portion of the growing population in Kuching city, communities with persistent flood problems or with risk of great losses when flooding does occur, are continually seeking methods to mitigate flood losses. In this paper, a river model was developed to identify flood conditions. This information was fed into a Logical Framework for addressing issues of emergency response and flood information coordination. A clear flood framework would enable many agencies to work closely together to rectify the flood situation in the quickest and safest manner. Often there is investment into the development of river hydro-informatics systems without sufficient dissemination of data or execution of action plans. It is important that this expensively-acquired information is propagated and used in an effective way, and how it is used to influence decision making processes.
References
BELL S and MORSE S (1999) Sustainability Indicators, Measuring the Immeasurable. Earthscan Publications Ltd, London. [ Links ]
BENITO G, LANG M, BARRIENDOS M, LLASAT MC, FRANCES F, OUARDA T, THORNDYCRAFT VR, ENZEL Y, BARDOSSY A, COEUR D and BOBEE B (2004) Use of systematic, palaeoflood and historical data for the improvement of flood risk estimation, review of scientific methods. Natural Hazards 31 623-343. doi:10.1023/B:NHAZ.0000024895.48463.eb. [ Links ]
DID (DEPARTMENT OF IRRIGATION AND DRAINAGE, SARA-WAK) (2003) Flood report of Kuching and Samarahan Divisions for 2003. [ Links ]
DID (DEPARTMENT OF IRRIGATION AND DRAINAGE, SARA-WAK) (2004) Flood report of Kuching and Samarahan Divisions for 2004. [ Links ]
DYHOUSE G, HATCHETT J and BENN J (2003) Floodplain Modelling using HEC-RAS. Haestad Methods Inc., USA. [ Links ]
HÄMÄLÄINEN R, KETTUNEN E, MARTTUNEN M and EHTAMO H (2004) Evaluating a framework for multi-stakeholder decision support in water resources management. Group Decision and Negotiation 10 (4) 331-353, doi:10.1023/A:1011207207809. [ Links ]
JENNY KK, MAH DYS, PUTUHENA FJ and SALIM S (2007) Post-flood forensic analysis of Maong River using InfoWorks River Simulation (RS). Journal Institution of Engineers, Malaysia (IEM) 68 (4) 41-46. [ Links ]
JURUTERA JASA CONSULTING ENGINEERS (2003) Sarawak River flood mitigation options study. Final Report for the State Government of Sarawak, Malaysia. [ Links ]
JURUTERA JASA CONSULTING ENGINEERS (2006) The proposed flood mitigation design options for Batu Kitang and Batu Kawa urban centres along Sarawak River, Kuching, Sarawak. Final Report for the State Government of Sarawak, Malaysia. [ Links ]
KTA CONSULTING ENGINEERS (1994) Sarawak River regulation scheme. Final Report for the State Government of Sarawak, Malaysia. [ Links ]
LIANG SJ and MOLKENTHIN F (2001) A virtual GIS-based hydrodynamic model system for Tamshui River. J. Hydroinformatics 3 195-202. [ Links ]
MAH DYS, PUTUHENA FJ and SALIM S (2007) Use of InfoWorks River Simulation (RS) in Sarawak Kanan River modelling. J. Inst. Eng. Malaysia (IEM) 68 (1) 1-10. [ Links ]
MAH DYS, LAI SH, CHAN RA@RB and PUTUHENA FJ (2010) Investigative modelling of the flood bypass channel in Kuching, Sarawak by assessing its impacts on the inundations of Kuching-Batu Kawa-Bau Expressway. Struct. Infrastruct. Eng., doi:10.1080/15732471003770167. [ Links ]
MEMON A and MURTEDZA M (1999) Water Resources Management in Sarawak, Malaysia. Universiti Malaysia Sarawak, Kuching. [ Links ]
MWH SOFT (2008) Manual for InfoWorks RS version 9.5. [ Links ]
OXLEY T, MCINTOSH BS, WINDER N, MULLIGAN M and ENGELEN G (2004) Integrated modelling and decision-support tools: a Mediterranean example. Environ. Model. Software 19 999-1010, doi:10.1016/j.envsoft.2003.11.003. [ Links ]
PAPPENBERGER F, BARTHOLMES J, THIELEN J, CLOKE HL, BUIZZA R and DE ROO A (2008) New dimensions in early flood warning across the globe using grand-ensemble weather predictions. Geophys. Res. Lett. 35 L10404, doi:10.1029/2008GL03383. [ Links ]
PUTUHENA FJ and KUSMULYONO AS (2007) The monitoring and evaluation process and results for capacity building for water resources sector in Indonesia. Proc. 57th IEC Meeting of the International Commission on Irrigation and Drainage (ICID), Kuala Lumpur, 14 September 2006. Food and Agricultural Organization of the United Nations, Rome. 25-46. [ Links ]
PUTUHENA FJ, MAH DYS and LAI SH (2005-2006) Floodplain mapping and visualization for flood risk assessment and decision support in Sarawak Kanan River. J. Environ. Syst. 32 (3) 203-221, doi:10.2190/ES.32.3.b [ Links ]
SALIM S, MAH DYS, SUMOK P and LAI SH (2009) Water quality monitoring of Maong River, Malaysia. Proc. Inst. Civ. Eng. -Water Manage. 162 35-40, doi:10.1680/wama.2008.000.0.1. [ Links ]
SHARP JJ and LIM YH (2000) The Sarawak River barrage hydrotechnical and geotechnical aspects. Proc. Inst. Civ. Eng. - Water &Mar. Eng. 142 (June) 87-96. [ Links ]
SINNAKAUDAN SK, AB GHANI A, AHMAD MSS and ZAKARIA NA (2003) Flood risk mapping for Pari River incorporating sediment transport. Environ. Model. Software 18 (2) 119-130, doi:10.1016/S1364-8152(02)00068-3. [ Links ]
SINNAKAUDAN SK (2009) Integrated triangular irregular network (ITIN) model for flood plain analysis. Int. J. Geoinformatics 5 (2) 47-55. [ Links ]
YU Z, LAKHTAKIA MN, YARNAL B, WHITE RA, MILLER DA, FRAKES B, BARRON EJ, DUFFY C and SCHWARTZ FW (1999) Simulating the river-basin response to atmospheric forcing by linking a mesoscale meteorological model and hydrologic model system. J. Hydrol. 218 (1) 72-91, doi:10.1016/S0022-1694(99)00022-0. [ Links ]
Received 14 April 2010; accepted in revised form 13 December 2010.
* To whom all correspondence should be addressed. +604-5995874; fax: +604-5941036; e-mail: darrien.mah@gmail.com

