


Serviços Personalizados
Artigo
 Inglês (pdf)
 Artigo em XML
 Referências do artigo
Indicadores

Links relacionados
-
 Citado por Google
 -
 Similares em Google
Compartilhar

 Permalink
Water SA
versão On-line ISSN 1816-7950
versão impressa ISSN 0378-4738
Water SA vol.37 no.1 Pretoria Jan. 2011
A comparison between the fixture unit approach and Monte Carlo simulation for designing water distribution systems in high-rise buildings
KW Mui and LT Wong*
Department of Building Services Engineering, The Hong Kong Polytechnic University, Hong Kong, China
ABSTRACT
The fixture unit approach with an arbitrarily assumed reference flow rate is commonly used for the estimation of probable maximum simultaneous demand in many building water systems. This study evaluates such estimations for some high-rise buildings in terms of various reference flow rates. The estimation accuracies are analysed against Monte Carlo simulations with which no reference flow rate is assumed. The results reveal that the traditionally assumed reference flow rate (10 ℓ·s-1) for demand analysis should be increased to 250 ℓ·s-1 for high-rise water systems in a dense built environment similar to Hong Kong.
Keywords: Demand analysis, water supply system, fixture unit approach, reference flow rate
Introduction
Demand overload is legitimate in some water plants and piping systems provided that its occurrence is very unlikely and a small failure probability corresponding to the theoretical maximum demand is allowed (Hassanein and Khalifa, 2006; Oliveira et al., 2009). To evaluate the probable maximum simultaneous demand problems in building water supply systems, the fixture unit approach is a simple and standard method to use. The approach is based on the fact that a simultaneous reference flow rate can be produced from different numbers of identical appliances characterised by their respective operating flow rates and operating probabilities (Plumbing Services Design Guide, 2002; Wise and Swaffield, 2002). The traditional reference flow rate of 10 ℓ·s-1 in the fixture unit approach was reported without significant problems in small-scale water supply systems, but water supply at an unsatisfactory low flow rate during peak demand periods was reported in some high-rise buildings (Mui et al., 2008; Wong and Liu, 2008). An underestimated simultaneous probable maximum demand resulted in excessive pressure variations in high-rise drainage stacks (Cheng et al., 2010). While the appliance characteristics are practically measured and updated in accordance with the local context, the choice of the reference flow rate, which is arbitrarily decided (and details of its sensitivity to the simultaneous demand variability are missing, particularly for dense built environment), is based on an assumption that needs to be examined for validity.
As Monte Carlo simulation can be employed to determine the system failure probability density function, this is another technique for instant water demand assessment (Courtney, 1972). For high-rise water systems, a stochastic model was developed on this basis, to acquire modelling parameters without the assumption of a reference flow rate (Wong and Mui, 2008). In this study, the variability of probable maximum simultaneous demands in water supply installations due to different choices of reference flow rate was investigated. Demands estimated via the fixture unit approach were compared with the Monte Carlo simulation results computed by the stochastic model. Appropriate alternatives regarding water supply systems in high-rise buildings were then discussed, and reference flow rates for demand analysis of high-rise water systems in a dense built environment similar to Hong Kong were recommended.
Simultaneous demand and fixture unit approach
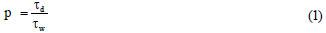
In a water supply system, simultaneous operation for a group of appliances of the same type can be evaluated using the probabilistic approach (Hunter, 1940). During the repeat cycle operation, the operating probability of an appliance p at any time with a mean operating period τd (s) and a mean time interval between the start time of 2 consecutive operations τw (s) is:
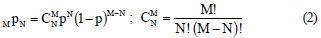
Assuming the appliance operations are binomially distributed, the probability p of N out of M (where M is the total count) identical appliances operating together in the system, MpN, is given by the following, where (1-p) is the probability of appliances not in use and  is the binomial coefficient:
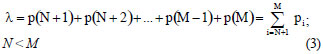
Presently, some water plants and piping systems are designed to allow a number of N (out of M; e.g. M>30) appliances to operate simultaneously for a maximum acceptable risk of failure, in order to minimise water supply system costs. They might be 'overloaded' when serving all of the M appliances concurrently at the theoretical maximum simultaneous flow rate. Regarding the acceptable level of system performance in terms of reliability, an unsatisfactory engineering state happens if more than N appliances are in use. The failure rate λ (i.e. occurrence of 'failure' as a percentage of time during peak demand periods) is determined by the sum of probabilities while this state takes place:
The selection of an acceptable failure rate is based on professional judgment, with or without verification (Mui et al., 2008). The probable number N (i.e. the number of appliances in simultaneous operation), approximated by the Sterling's formula for an 'engineeringly acceptable' limiting failure rate λ = 1% (recommended in some designs), can be expressed with z = 1.82255 as follows (Wong and Mui, 2007):

The corresponding probable maximum simultaneous demand qd (ℓ·s-1) for an installation of M appliances can then be calculated via Eq. (5), where q (ℓ·s-1) is the operating flow rate of an appliance:

Using the fixture unit approach, Eq. (5) can also be employed to determine the design operating flow rate for an installation with two or more appliance types. In this study, a reference simultaneous flow rate qref (ℓ·s-1), e.g. 10 ℓ·s-1, was produced from a number of base case appliances Ab with their respective usage characteristics. The level of qref was professionally estimated and its sensitivity to the probable maximum simultaneous demand was evaluated.
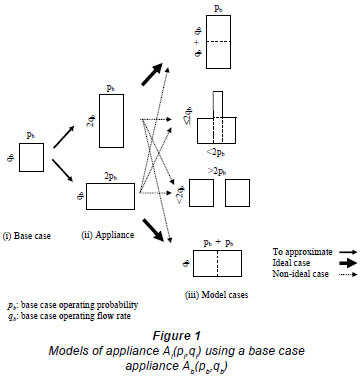
Each appliance Ai is defined by 2 characteristics, namely, the operating probability pi and operating flow rate qi, i.e. Ai(pi,qi). Since qref (ℓ·s-1) applies to both an installation of Mi number of Ai and an installation of Mb number of Ab, by taking the fixture unit of Ab as Ub = 1, the fixture unit Ui for Ai is:
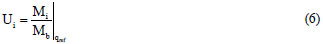
Figure 1 illustrates the notion of using the characteristics of a base case appliance Ab(pb,qb) to approximate those of an appliance Ai with Ai(pi = 2pb,qi = qb) or Ai(pi= pb,qi = 2qb). Ideally, 2 base case appliances should not be simultaneously discharging or discharging exactly in phase in order to achieve the absolute approximation as shown in Fig. 1(ii). Probable cases where a number of base case appliances discharge in random patterns are not excluded in the fixture unit approach and additional occurrence information is needed to eliminate them via mathematical treatment. These non-ideal approximations are exhibited in Fig. 1(iii). Indeed, the existing fixture unit approach depends not only on the appliance attributes pi and qi, but also on the choice of qref.
Results and discussions
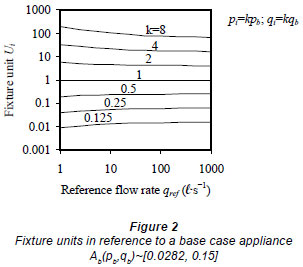
The characteristics of a base case appliance Ab(pb,qb)~[0.0282, 0.15] with the corresponding base case fixture unit Ub = 1 at a reference flow rate qref= 10 ℓ·s-1, as stated in an existing design guide, were employed for the use of discussion (Wise and Swaffield, 2002; Galowin, 2008). In order that influences of the qref choice on the sensitivity of the fixture units could be fully demonstrated, operating probabilities and operating flow rates ranging from 0.125 to 8 times the base case attributes were considered, i.e. Ai= Ai(pi,qi), where pi= kpb, qi= kqb and k∈[0.125, 8].
Figure 2 shows the fixture units Ui of Ai with reference to Ab in the qref range between 1 ℓ·s-1 and 1 000 ℓ·s-1. It was noted that a unity fixture unit Ub was defined for all qref. For k = 0.125, 0.25, 0.5, 1, 2, 4 and 8, Ui were 0.009, 0.04, 0.193, 1, 5.6, 33 and 200 at qref = 1 ℓ·s-1; 0.013, 0.054, 0.229, 1, 4.5, 21 and 101 at qref= 10 ℓ·s-1; and 0.015, 0.06, 0.243, 1, 4.2, 18 and 74 at qref = 100 ℓ·s-1, respectively. The reference flow rate choice was found to have some influences on the fixture unit values.
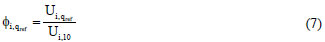
The fixture unit ratio Φ indicates the variation in Ui at a selected reference flow rate qref as compared with the base case qref= 10 ℓ·s-1:
For k = 0.125, 0.25, 0.5, 1, 2, 4 and 8 times the base case attributes, Φ = 1 = 0.67, 0.74, 0.84, 1, 1.24, 1.57, 1.98 at qref = 1 ℓ·s-1, and Φ = 100 = 1.14, 1.11, 1.06, 1, 0.92, 0.83, 0.74 at qref = 100 ℓ·s-1, respectively. In the ideal case, Φ is very close to unity over a range of qref to which the fixture unit values are not sensitive. Apparently, the choice of a smaller reference flow rate, e.g. qref = 1 ℓ·s-1, resulted in a larger variation of Φi.
Figure 3 exhibits the fixture unit ratios Φi for appliances Ai= Ai(pi,qi), where pi = kpb, qi = kqb and k∈[0.125, 8]. Fixture unit ratios determined from the results presented in Fig. 2 are illustrated in Fig. 3(a). Once again, a smaller variation of Φi was found when a larger reference flow rate was selected (e.g. qref>100 ℓ·s-1).


For an appliance running at the base case operating flow rate, i.e. qi= qb, Φi was less sensitive to the operating probability pi = kpb. This finding is shown in Fig. 3(b) and the corresponding range of Φi was from 0.94 to 1.03. For an appliance running under the base case operating probability such that pi= pb, on the contrary, Φi was sensitive to the operating flow rate qi = kqb. Figure 3(c) displays the corresponding Φi ranges: Φi = 0.67 to 2.17 at qref = 1 ℓ·s-1; Φi = 0.69 to 1.15 at qref = 100 ℓ·s-1; and Φi = 0.61 to 1.20 at qref = 1 000 ℓ·s-1.
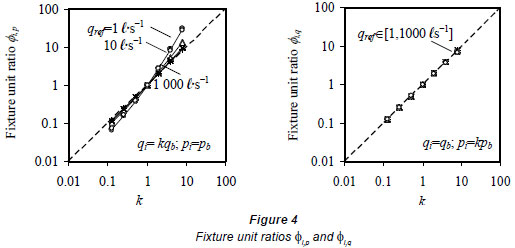
The fixture unit ratios were further evaluated in 2 conditions expressed by:
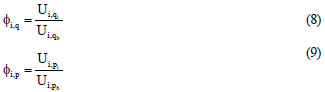
where Φi,q is the ratio of an appliance fixture unit over the fixture unit of the appliance running under the base case operating flow rate qb (ℓ·s-1) and operating probability pi= kpb, k∈[0.125, 8]. Similarly, Φ is the ratio of an appliance fixture unit over the fixture unit of the appliance running under the base case operating probability pb and operating flow rate qi= kqb, k∈[0.125, 8]. As either pi or qi was assumed constant in each of the 2 cases for the sensitivity study, the fixture unit ratio and the ratio of either pi or qi would impeccably vary by the same amount over the base case value at a preferred reference flow rate qref.
Figure 4 presents the fixture unit ratios Φi,p and Φi,q against k∈[0.125,8]. Generally, the ratios and the values of k varied by the same amount. Compared with Φi,p, Φi,q showed good agreement with the k values. It was obvious as the fixture unit ratios were more sensitive to the appliance operating flow rate qi than to the appliance operating probability pi.
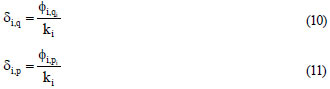
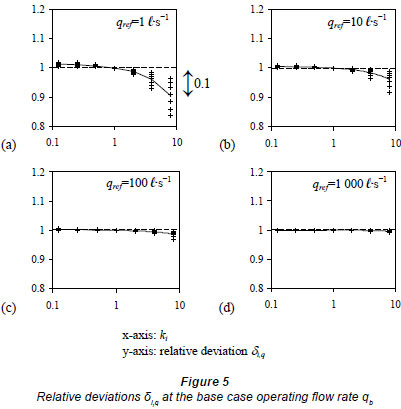
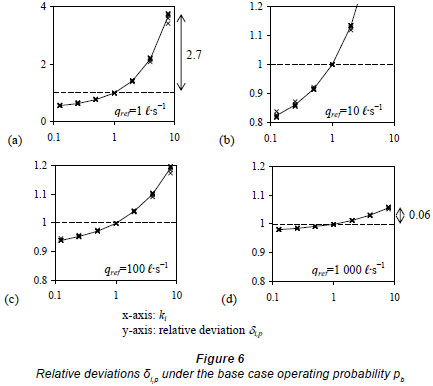
At a chosen reference flow rate qref (ℓ·s-1), the relative deviations of the response of Φi,q and Φi,p can be expressed by δi,q and δi,p, respectively:
δi,q and δi,p against Ki ∈[0.125,8] at qref = 1 ℓ·s-1, 10 ℓ·s-1, 100 ℓ·s-1Reference flow rate qref (ℓ·s-1) and 1 000 ℓ·s-1 are shown in Figs. 5 and 6. A larger qref was associated with a smaller variation in the relative deviation. When qref increased from 1 ℓ·s-1 to 1 000 ℓ·s-1, the maximum Fixture unit ratios Φ for appliances A(kp,kq), k∈[0.125, 8] average deviation was reduced from 0.1 to 0.004 at the base case operating flow rate qb (Fig. 5), and from 2.1 to 0.06 under the base case operating probability pb (Fig. 6). The results also demonstrated that the variations were more sensitive (about 15 to 30 times) to the appliance flow rate qi than to the corresponding reference flow rate qref .
Comparison with a stochastic model
For comparison, the probable maximum simultaneous water demand of an installation with a number of appliances was also evaluated by a stochastic model whose parameters can be identified from the descriptive distribution functions using a Monte Carlo sampling technique (Wong and Mui, 2008). This model has been applied to assess domestic washrooms where the usage patterns were complex.
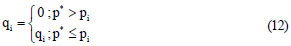
Based on the operating probability pi and operating flow rate qi (ℓ·s-1), as defined in the fixture unit approach, the operation of an appliance Ai = Ai(pi,qi), where i = 1...ni, is described by a random process with a random number p*∈[0,1]:
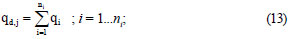
In each simulation j, the simultaneous operating flow rate qd,j (ℓ·s-1) is computed by:
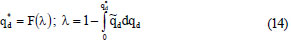
The probable maximum simultaneous demand qd* (ℓ·s-1) is determined by the distributions of all simulated simultaneous operating flow rates  (ℓ·s-1) from all simulations j = 1...ns, where the allowable failure rate is λ = 1% as adopted in some common practices:
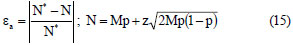
Via further simulation steps, the required number of simulations ns can be resolved through error fine tuning using 2 error terms. The first term is the absolute modelling error εa which is quantised by the modelled number of appliances in simultaneous operation for 99% of N*cases, i.e. corresponding to λ = 1% in Eq. (4):
The second term is the relative modelling error εr calculated by the change of model output due to 1 simulation increment:
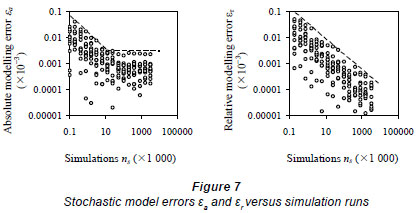
Figure 7 presents the modelling errors εa and εr versus ns simulations for installations with 1 000 to 30 000 appliances whose operating probability range set was p∈[0.01,0.05]. It was reported that the maximum absolute modelling error εa would remain unchanged for ns>10 000, at ns = 10 000, the relative modelling error εr would be 0.008 x 10⁻³.
At a reference flow rate qref ∈[1,1000], the fixture unit approach was applied to determine the probable maximum simultaneous demands qd, ref (ℓ·s-1) of M installations. Each of the installations was composed of 2 different appliance types, A1 and A2, and operating in 3 demand patterns, namely, commercial, residential and public, as listed in Table 1. The picked installation sizes ranged from 100 to 10 000 washbasin-WC pairs and the resulting qd, ref (ℓ·s-1) were compared with the qd* (ℓ·s-1) values obtained from the stochastic model. The percentage deviation δf, ref between qd, ref and qd* is given by:
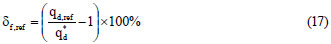
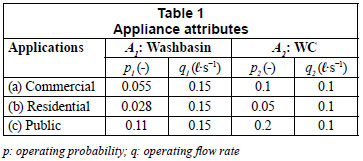
Figure 8 exhibits the percentage deviations estimated for the 3 demand patterns. In the figure, a positive value indicates an overestimation of the probable maximum simultaneous demand and should be considered as satisfactory under the maximum allowable failure rate condition, i.e. λ = 1%. The outcome showed that the choice of a reference flow rate had a significant influence on the predicted demand values. A wide range of deviations δf,ref were thus reported. The deviations varied from -9 to 5%, -7 to 5% and -12 to 5%, in the commercial, residential and public installations, respectively.
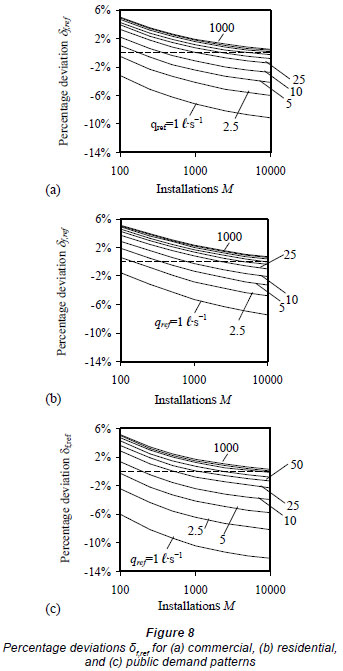
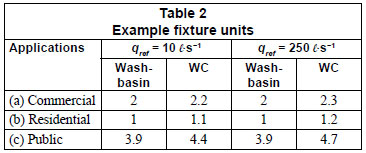
Taking a reference flow rate of 10 ℓ·s-1 (a common practice) as an example, the results of the fixture unit approach would give satisfactory maximum simultaneous demand predictions (i.e. overestimation within 2%) for installation sizes of 400, 900 and 200 washbasin-WC pairs, in commercial, residential and public applications, respectively. However, the installation sizes for an 80-storey residential building and a housing estate of 40-storey buildings in Hong Kong are about 1 200 and 10 000 washbasin-WC pairs, respectively. Besides, a high-rise commercial building of 80 storeys will require 2 000 pairs and a commercial shopping complex over 1 000 pairs. In other words, for water supply systems in high-rise buildings, the reference flow rate should be increased to meet the 1% failure allowance. This study demonstrated that for an installation size of up to 10 000 washbasin-WC pairs, reference flow rates of 100 ℓ·s-1 and 250 ℓ·s-1 would be adequate for high-rise residential and commercial buildings, respectively. Correspondingly, for the public applications, these 2 rates would be adequate for installation sizes up to 1 000 and 5 000 washbasin-WC pairs, respectively. Table 2 gives some example fixture units for appliances operating at a reference flow rate of 250 ℓ·s-1. Illustrative examples for the probable maximum simultaneous demands for typical residential buildings and commercial buildings with both reference flow rates (10 ℓ·s-1 and 250 ℓ·s-1) are shown in Appendix 1. Underestimates of 2-4% of the probable maximum simultaneous demands were illustrated in the examples. Existing fixture units used for some buildings are shown for comparison. The differences revealed why the fixture unit approach should be revised for high-rise water systems.
Conclusion
The fixture unit approach, based on a reference flow rate of 10 ℓ·s-1, has been used to estimate the probable maximum simultaneous demands in building water systems for many years. Despite the finding that it would give good estimates (at a failure rate of 1%) for installations of 400, 900 and 200 washbasin-WC pairs in commercial, residential and public applications, respectively, this study reports that the selection of a reference flow rate did have significant influence on the demand estimates, and the existing choice would underestimate the actual demands in high-rise buildings of larger installations, commonly found today. Therefore, the traditionally assumed reference flow rate should be increased for highrise water systems in a dense built environment. This study illustrated that a reference flow rate of 250 ℓ·s-1 is adequate for typical residential and commercial buildings with installations of up to 5 000 washbasin-WC pairs.
Acknowledgments
The work described in this paper was partially supported by a grant from the Research Grants Council of the HKSAR, China (PolyU5337/09E) and a grant from The Hong Kong Polytechnic University (GU551, GYG53).
References
COURTNEY RG (1972) A Monte-Carlo method for investigating the performance of a domestic water system. Proc. CIBW62 Symposium, 19-20 September, BRE, UK, 97-104. [ Links ]
CHENG CL, MUI KW, WONG LT, YEN CJ and HE KC (2010) Characteristics of air pressure fluctuations in high-rise drainage stacks. Build. Environ. 45 (3) 684-690. [ Links ]
GALOWIN LS (2008) "Hunter" fixture units development. Proc. 34th CIBW062 International Symposium on Water Supply and Drainage for Buildings, 8-10 September, The Hong Kong Polytechnic University, Hong Kong. 58-80. [ Links ]
HASSANEIN AAG and KHALIFA RA (2006) Financial and operational performance assessment: water/wastewater Egyptian utilities. Build. Serv. Eng. Res. T. 27 (4) 285-295. [ Links ]
HUNTER RB (1940) Methods of estimating loads in plumbing systems. Report BMS65. national Bureau of Standards, Washington. [ Links ]
MUI KW, WONG LT and YEUnG MK (2008) Epistemic demand analysis for fresh water supply of Chinese restaurants. Build. Serv. Eng. Res. T. 29 (2) 183-189. [ Links ]
OLIVEIRA LH, GONCALVES OM and UCHIDA C (2009) Performance evaluation of dual-flush WC cistern in a multifamily building in Brazil. Build. Serv. Eng. Res. T. 30 (1) 27-36. [ Links ]
PLUMBING SERVICES DESIGN GUIDE (2002) The Institute of Plumbing, Essex. [ Links ]
WISE AFE and SWAFFIELD JA (2002) Water, Sanitary and Waste Services for Buildings (5th edn). Butterworth Heinemann, London. [ Links ]
WONG LT and LIU WY (2008) Demand analysis for residential water supply systems in Hong Kong. HKIE Trans. 15 (20) 24-28. [ Links ]
WONG LT and MUI KW (2007) Modeling water consumption and flow rates for flushing water systems in high-rise residential buildings in Hong Kong. Build. Environ. 42 (5) 2024-2034. [ Links ]
WONG LT and MUI KW (2008) Stochastic modelling of water demand by domestic washrooms in residential tower blocks. Water Environ. J. 22 (2) 125-130. [ Links ]
Received 16 February 2010; accepted in revised form 3 November 2010.
* To whom all correspondence should be addressed. (852) 2766 7783; fax: (852) 2765 7198; e-mail: beltw@polyu.edu.hk
Appendix 1
Illustrative examples
Examples showing the simultaneous probable maximum demands using the fixture unit approach with the reference flow rates of 10 ℓ·s-1 (traditionally assumed reference flow rate) and 250 ℓ·s-1(suggested value for high-rise water systems in a dense built environment) are presented. The base case operating probability pb is 0.0282, and the base case operating flow rate qbis 0.15 ℓ·s-1 for the base case appliance assigned with a fixture unit of 1.
Example 1:
For an 80-storey residential building with an installation size of 1 200 washbasin-WC pairs
Traditional approach (at the reference flow rate of 10 ℓ·s-1):
Fixture units of a washbasin-WC pair = 1+1.1 = 2.1
Total fixture units of a building (reference to the base case appliance) M = 1 200 × 2.1 = 2520
The simultaneous probable maximum demand, qd =13.9 ℓ·s-1
Suggested approach (at the reference flow rate of 250 ℓ·s-1):
Fixture units of washbasin-WC pair = 1+1.2 = 2.2
Total fixture units of a building (reference to the base case appliance) M = 1200 × 2.2 = 2640
The simultaneous probable maximum demand, qd=14.5 ℓ·s-1
Example 2:
For a high-rise commercial building of 80 storeys with an installation size of 2 000 washbasin-WC pairs
Traditional approach (at the reference flow rate of 10 ℓ·s-1):
Fixture units of a washbasin-WC pair = 2+2.2 = 4.2
Total fixture units of a building (reference to the base case appliance) M = 2000 × 4.2 = 8400
The simultaneous probable maximum demand, qd = 41.4 ℓ·s-1
Suggested approach (at the reference flow rate of 250 ℓ·s-1):
Fixture units of washbasin-WC pair = 2+2.3 = 4.3
Total fixture units of a building (reference to the base case appliance) M = 2000 × 4.3 = 8600
The simultaneous probable maximum demand, qd = 42.3 ℓ·s-1

