


Servicios Personalizados
Articulo
 Inglés (pdf)
 Articulo en XML
 Referencias del artículo
Indicadores

Links relacionados
-
 Citado por Google
 -
 Similares en Google
Compartir

 Permalink
Water SA
versión On-line ISSN 1816-7950
versión impresa ISSN 0378-4738
Water SA vol.37 no.1 Pretoria ene. 2011
Is science enough? Examining ways of understanding, coping with and adapting to storm risks in Johannesburg
Christina Elizabeth Fatti*; Coleen Vogel
ReVAMP, School of Geography, Archaeology and Environmental Science, University of the Witwatersrand, Private Bag 3, Wits 2050, South Africa
ABSTRACT
Planning for current and future climate risks depends on more than early warning signals and technical climate information. The management and enabling of effective risk approaches, we argue, is shaped by complex contextual settings. These contexts are shaped by decisions including: What climate risks are prioritised? Who makes decisions about risk response interventions and how do they make these decisions? This preliminary study uses observed changes in storm events in the City of Johannesburg (CoJ) and the City's Climate Change Adaptation Plan as a lens through which the scope of such contexts and decisions can be interrogated. The study is used as a springboard from which to begin a dialogue on interactive approaches to adaptation and response planning for current and future climate change. We suggest that this dialogue may be required for a more proactive disaster-risk approach in the city. The major focus of the paper includes a statistical analysis of historical weather data from the OR Tambo Weather Station, located in close proximity to the city. Significant trends are identified in the frequency and intensity of thunderstorms for the period 1960-2009. This preliminary assessment shows some similarities with emerging climate change projections that suggest that heavy rainfall events may become more frequent and intense. The preliminary results presented here also concur with the recent findings contained in the CoJ's Climate Change Adaptation Plan (2009). While the study is in no way substantive and few wider generalisations and strong conclusions can be drawn from it, the study does provide a useful starting point for considering possible planning interventions. The potential value of using science and information from studies, such as this, is highlighted along with the possible ways in which such science can interact with and help inform a comprehensive planning agenda in the City. Finally, the paper calls for more attention to be paid to the contributions and perceptions of community awareness and understanding of climate risks.
Keywords: Thunderstorm trends, climate change, Johannesburg, policy response, adaption and development planning, citizen science
Introduction
Attention focussed on climate change is growing both globally and locally. One problem with much of the current discourse is that this focus is usually on long-term challenges rather than on also attempting to understand current local issues. Projected climate change is important for various planning horizons, particularly those that aim to address climate and development issues in the short and longer term. This paper aims to show that an enhanced understanding of both current and past climate phenomena (in this case thunderstorms) can be invaluable in enhancing the dialogues needed to improve adaptation to future climate change. Some practical and effective insights into current and future environmental challenges (e.g. climate change and climate variability) can potentially be gained from those already working on climate adaptation research and adaptive governance (Adger, 2001; Adger et al., 2009; Demeritt et al., 2010). Despite the wealth of such insights, we suggest that there remains a patchy understanding of how climate and climate risk assessment can be woven more effectively into everyday planning, particularly in urban planning settings.
In the late 1990s, Cohen et al. (1998) challenged those working on climate change and sustainable development to consider, amongst other things, that integration between climate change and sustainable development needs to be context specific. Integrated assessments need to be informed by local knowledge, include climate models as well as incorporate an understanding of broader social issues (Cohen et al., 1998; Roberts, 2008). Although the international literature is becoming increasingly populated by climate studies that include themes such as those raised by Cohen et al. (1998), few such studies exist for urban areas in South Africa.
One way to begin highlighting the need for a richer and more engaged dialogue on climate change and variability, in local contexts, is to illustrate the nature of a climate problem (e.g. thunderstorms) from various perspectives. This process can begin, for example, by investigating some of the climate scenarios that may accompany climate change, particularly where these may be of value to urban planners. Here the patterns and trends, which climate systems have produced in the past, can also be reflected on. From there, an assessment can be conducted on the value of possible assimilations of the findings, in a way that shows how such information can affect everyday lives and how such information may contribute to how risk perceptions are framed. To provide a context within which this debate can be articulated, the current state of intense rainfall variability also needs to be understood. This will also reveal the risks and consequences of possible changes in variability that may result from climate change (Boko et al., 2007; Christensen et al., 2007). Improving the understanding of current storm risks is not purely for the benefit of the science-policy dialogue, but for the affected communities. Efforts also need to be made to understand how flood risk is framed and perceived by those most affected by such storms. Multiple perspectives are thus required for effective local-scale climate adaptation and, as we show in this paper, this diversity needs to be acknowledged if successful planning interventions are to be designed. Before the dialogue has even begun narrowing down to a specific case, a range of issues, including discussion on the links between climate change and climate variability, must be explored.
The United States (US), for example, has good climate records of the last century that provide insight into the current state of rainfall trends in that country (CCSP, 2008a). The US Climate Change Science Program (CCSP) Synthesis and Assessment Product 3.3 (CCSP, 2008a; b) reports on precipitation trends that are apparent in the US between 1908 and 2002. Total annual rainfall, for example, shows an increase over the period. Medium and light rainfall events, however, show very little change. The report further highlights that the interdecadal variability of heavy rainfall events is also high. There is a clear trend of increasing intensity and frequency of heavy rainfall events, which is particularly evident in the central and eastern parts of the country (CCSP, 2008a). The future model projections show that the trend of increasing intensity of rainfall events is likely to strengthen further and uncommon heavy rainfall events should become more common (CSSP, 2008b).
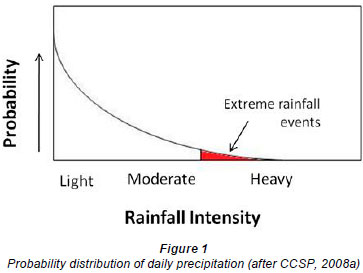
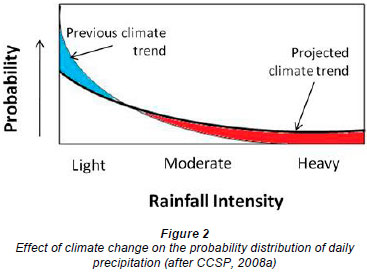
Despite modelling difficulties, general circulation models (GCMs) and regional circulation models (RCMs) climate models run by powerful computers have shown that the intensity of the global hydrological cycle is likely to show an overall increase with climate change (e.g. Christensen et al., 2007; Fauchereau et al., 2003). More specifically, some GCMs show that the frequency and intensity of heavy rainfall events are likely to increase as a result of climate change (CSSP, 2008a; Mason et al., 1999; Meehl et al., 2007). The modelled trend for heavy rainfall, moreover, shows statistically significant projections in some cases, which reveals that, although the number of dry days will increase, when it does rain both average and maximum daily rainfall are likely to increase (CSSP, 2008b; New et al., 2006). Figures 1 and 2 show the probability distribution of rainfall intensity and how climate change will influence it, in particular how extreme rainfall events will be affected. The combined effect of these changes may mean a dampening of any increases leaving total annual rainfall relatively constant over time (Engelbrecht et al., 2009; Mason and Joubert, 1997; New et al., 2006). It is therefore less likely, some suggest, for climate change to be detectable in seasonal trends or annual averages. Instead, changes in climate variability will be more obvious through heavy rainfall trends (New et al., 2006; Williams et al., 2008). These events are predicted and observed on regional scales and thus require climate models that have a higher resolution than the GCMs.
A recent study (Engelbrecht et al., 2009) for example, revealed that total rainfall in the south-western region of South Africa is likely to decrease; the eastern regions should also become drier; and the central interior is expected to receive increased total rainfall (Engelbrecht et al., 2009). The rainfall season is likely to shorten with increasing intensity of rainfall events, particularly where convective rainfall occurs (Engelbrecht et al., 2009; Mason et al., 1999).
There are few assessments in South Africa that are similar to those conducted by the CCSP. Available larger-scale assessments, however, show that, since the beginning of the 20th century, annual rainfall over South Africa has remained relatively constant. Some increases in the extremes in rainfall variability have been observed (Kruger, 2006). Similar results have also been found in a countrywide study of the long-term changes in extreme rainfall events in South Africa for the periods 1931-1960 and 1961-1990 (Mason et al., 1999). An increase in rainfall intensity was identified over significant parts of the country over the assessed time periods. The spatial resolution of this study is, however, quite coarse and gives little detailed insight into heavy rainfall events in localised areas.
The understanding of distribution and driving forces of precipitation and heavy rainfall events in Africa is also limited by the problems of being able to downscale effectively from larger GCM projections. Although work is currently underway to improve Southern African projections, the effectiveness of downscaling regional models in Africa remains relatively uncertain (Christensen et al., 2007; Engelbrecht et al., 2009; Fauchereau et al., 2003; Kruger, 2006). The uncertainty in modelling climate change further frustrates efforts to develop locally relevant coping and risk-reduction measures for future climate risks and heavy rainfall events.
Although recent climate model projects have improved the confidence in climate scenarios over Southern Africa (Engelbrecht et al., 2009), there remains uncertainty in clarifying the relationships to climate variability, e.g., seasonal climate outlooks. El Niño is such an example. El Niño is a global phenomenon that is driven by changes in sea surface temperatures and pressure systems over the Pacific Ocean. These changes shift weather patterns across the earth. South Africa tends to receive less summer rainfall in El Niño years (Tyson and Preston-Whyte, 2000). January 2010, although predicted to be within an El Niño season, saw a large amount of rainfall through the eastern parts of South Africa. This pattern is typical of normal summer rainfall (Tyson and Preston-Whyte, 2000). Notwithstanding the range of issues associated with climate science and forecasting, opportunities are emerging from some of the assessments of current climate variability and their linkages to climate change projections.
Beginning a discourse on climate risk reduction the case of storms in Johannesburg
Following this brief background on some of the 'drivers' of rainfall in the region, attention now turns to an investigation of current and past storm characteristics for Johannesburg. Recently, the City of Johannesburg (CoJ) experienced severe flooding, which had devastating consequences, including loss of life, and resulted in a disaster being declared for parts of Soweto (February 2009; Mail and Guardian, 2009). These events highlighted the need for increased disaster planning and risk reduction approaches for heavy rainfall events, including thunderstorms. Of interest in the results emerging from the investigation of storms in Johannesburg, is the pattern of storm occurrences and the implications such patterns may have for planning in the City. We also reflect on the value added by such technical assessments and call for more nuanced assessments that may be required to build resilience to future storms.
The City of Johannesburg
The CoJ is situated in the Gauteng Province on the interior highveld plateau of South Africa, at an altitude of 1 740 m. Convective thunderstorms bring the majority of precipitation to the highveld region. These storms account for the major flooding and heavy rainfall events that affect the CoJ and can cause much damage to livelihoods and infrastructure (Tyson and Preston-Whyte, 2000). A number of recent studies have examined daily rainfall in and around the CoJ over the past few decades, in order to gain a better understanding of rainfall variability and change (Dyson, 2009; CoJ, 2009).
In this paper, rainfall events have been classified according to intensity for Gauteng Province. Dyson (2009) uses the top 10% of average daily rainfall to categorise heavy rainfall events (the 90th percentile was 9 mm, but 10 mm was used for simplicity). Dyson (2009) defined a significant rainfall event as one where the average rainfall for the area is over 10 mm in a 24 h period. A heavy rainfall event is classified as one where at least 15 mm of rain falls in one day and a very heavy rainfall event is one where at least 25 mm of rain falls in a day (Dyson, 2009). 'Heavy rainfall events', which surpassed the 5% (more than 13 mm in a day) threshold comprised only a very small number of events. The process of classifying heavy rainfall events is dependent on a historical range of average daily rainfall. This process is based on the assumption that the frequency and intensity of heavy rainfall events remains within a constant band of variability. This assumption becomes problematic if rainfall variability changes over time, as may occur under various climate change scenarios.
Using the approaches briefly outlined above, Dyson (2009) analysed daily rainfall for Gauteng from 1977-2009 in order to improve understanding of heavy rainfall characteristics for forecasting. The focus of the study was specifically on heavy rainfall statistics and not on causative weather systems for the benefit of climate forecasters. The results of Dyson's study show that in Gauteng January is the month with the highest average rainfall. It is also the month with the highest number of days where heavy and very heavy rain falls. A trend analysis was conducted on seasonal rainfall from 1977-2009. However, no statistically significant trend was found for either the early or late rainfall seasons (Dyson, 2009). There is evidence that if very heavy rainfall is measured at a single station, it is more likely to be an isolated downpour rather than a widespread heavy rainfall event (Dyson, 2009).
A second study that was conducted on daily rainfall in the region was included in the CoJ's Climate Change Adaptation Plan (CCAP). The study investigated rainfall data from the Krugersdorp weather station for 1961-2006. It assessed rainfall trends over the period. There were no observable trends in monthly rainfall, rainfall per rain-day or the number of days with over 10 mm of rainfall. There was, however, a significant decrease in the number of rain days with at least 2 mm of rain. This decrease equates to between half and one less rain day per decade (CoJ, 2009).
Intense, small-scale storms are difficult to predict but often result in flooding, which can have dire consequences for livelihoods and infrastructure of various types and scales. It remains unclear how changes in rainfall patterns will affect runoff and the hydrological cycle as a whole for the region and for more local cases (Christensen et al., 2007; Tadross et al., 2005). If runoff increases in association with changes in rainfall, there will be severe impacts on already vulnerable communities (Mason and Joubert, 1997).
Detecting storm patterns: understanding the risk for Johannesburg
Some assessments of climate change projections suggest that thunderstorms in Gauteng may decrease in frequency and increase in intensity (Engelbrecht et al., 2009). Heavy storms, which occur relatively infrequently, are likely to increase as the average storm intensity increases.
Given some of these assessments, this particular study for Johannesburg found that the total number of storms has decreased over the study period. The number of heavy storms, however, has remained constant through the period. By inference, this means that heavy storms make up a bigger proportion of storms later in the period compared to the earlier years. This is indicated in the average storm rainfall, which shows an increasing trend through the period. These preliminary conclusions are, however, tentative. Similar assessments of drying and drought periods would also be informative but these fall outside the scope of this study. To date, the results of the study show that there is a highly significant decrease in the number of thunderstorms, from 1960-2008, at the OR Tambo Weather Station. There is also a highly significant increase in average rainfall per storm. These observed changes link closely to some preliminary climate change projections (Engelbrecht et al., 2009). Both the number and intensity of storms link to the anticipated change. This study classifies a heavy storm as one with more than 10 mm of rainfall. Heavy storms are expected to increase in frequency; yet there is no evidence, in this study, of a change in heavy storm frequency over the period.
Given the wider provincial backdrop provided by Dyson's (2009) study, South African Weather Service (SAWS) weather data were examined to find possible patterns at a local scale (e.g. Johannesburg). Data for this study were taken from the OR Tambo Weather Station, for the period 1960-2009. This period was used because it comprises the full set of observation data available. Due to the requirements of the airport there is always a human observer monitoring the weather at the station, so cloud and weather data are available for the entire period. This information is crucial for identifying storms, as thunder-storm occurrence is associated with a combination of specific weather.
The weather and cloud data comprised 3 daily-recorded observations, at 08:00, 14:00 and 20:00. In contrast to these datasets, rainfall data are stored as daily totals. For the purpose of this study, a thunderstorm is identified by the fulfilment of 3 criteria at a specific time on a day, namely cloud type being cumulonimbus, the human observation of a thunderstorm, and the occurrence of rain during that day.
Cloud data are stored as a list of 9 digits where the second digit refers to low cloud type. Cumulous cloud is a low cloud and is identified by the numbers 3 and 9. Weather data are recorded as a number from 0 to 99 where each number refers to a possible weather phenomenon. Thunderstorm observations are limited to the numbers 13, 29 and 90 to 99. Rainfall data are recorded as a daily total rainfall, measured in millimetres. A maximum of 1 thunderstorm is counted per day due to the availability of only 1 value for daily rainfall. This minimises the data inconsistencies between rainfall, cloud and weather types. This method also prevents a single storm, which extends across observation times, from being counted more than once.
This study focuses on the summer season, from October to March, in line with other summer rainfall studies in the region (e.g. CoJ, 2009; Dyson, 2009). Following the identification of thunderstorms during this period, the frequency of these events is investigated. The total number of storms per season is calculated by summing the storms identified during each year's rainfall season. Further analysis of the data includes assessments of storm frequency, total rainfall, total storm rainfall, average storm rainfall and heavy storm frequency. In line with Dyson's (2009) rainfall study and a study from the Krugersdorp Weather Station, heavy rainfall is classified as the top 10% of daily rainfall, which equates to a daily rainfall of at least 10 mm. The greatest potential inaccuracy in this study is underreporting of storm events.
Storm frequency
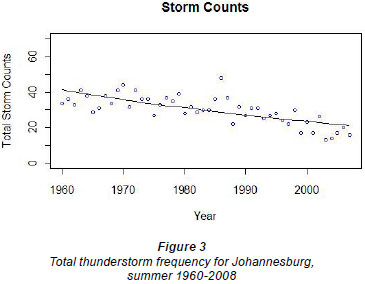
Following the identification of thunderstorms over the summer seasons between 1960 and 2008, an analysis of storm frequency over time was conducted. Figure 3 shows the trend of summer thunderstorms for the period. The distribution across the period shows a decreasing trend. There is 1 outlier value in the 1986/1987 season. This is likely due to the deep low-pressure system over Botswana that drew moisture through to Gauteng in late October 1986. This system resulted in the highest daily rainfall for Gauteng between 1977 and 2009 (Dyson, 2009). A Poisson regression model was applied to the distribution as shown in Fig. 3. The regression indicates a highly significant (p < 0.0001) decreasing trend over time in the frequency of storms. At the beginning of the period, storm count is roughly between 30 and 45 per year. By the end of the period, the range has decreased to between 10 and 25 storms per year.
Total storm rainfall
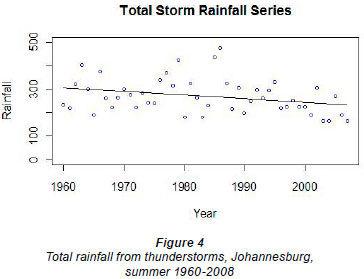
Continuing with the assessment of thunderstorms between 1960 and 2008, the total rainfall produced specifically by thunderstorms was the next focus of the research. The rainfall produced by individual thunderstorms was extracted from the daily rainfall data. This set of data was plotted as a time series as shown in Fig. 4. The range of total storm rainfall for the summer season over the period of the study lies between 150 mm and 450 mm. The 1986/1987 summer storm season was the only year in which storm rainfall exceeded this band. The total rainfall produced by thunderstorms showed a slightly decreasing trend over time, which is just significant at the 5% level (p = 0.04).
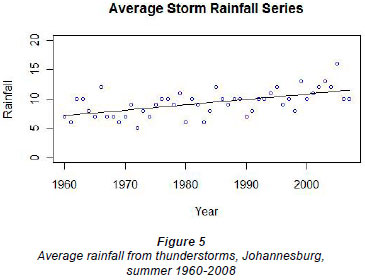
Average storm rainfall
The average rainfall per storm was analysed by dividing the total storm rainfall by the number of storms in the respective season. These values are then plotted on a graph (Fig. 5). A linear regression fitted to the series indicates a highly significant (p < 0.0001) increase in the average rainfall per storm over the period. In the 1960s, the average rainfall per storm ranges between 5 mm and 12 mm. By the 2000s, this has increased to between 10 mm and 16 mm per storm. This mirrors the results found by Kruger (2006), where an increase in rainfall intensity was observed over the past century in Southern Africa.
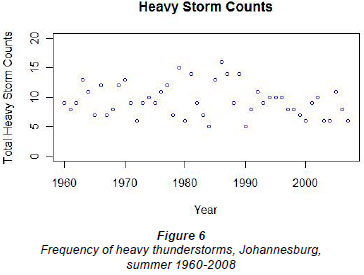
Heavy storm frequency
Due to the highly significant increase found in the average rainfall per storm over the period 1960-2008, heavy storms were also analysed to determine if this relates to an increase in the frequency of heavy storms. A key challenge in studying past heavy rainfall events is defining what constitutes a heavy rainfall event (classified here as the top 10% of rainfall events, i.e. when 10 mm or more fell in a 24-hour period). These storms were extracted from the total storm count and their frequency is plotted over the period as shown in Fig. 6. The Poisson regression model is applied to this distribution. The number of heavy storms averaged around 10 per year over the whole period. The season with the highest number of heavy storms is 1986/1987, where 16 heavy storms are noted.
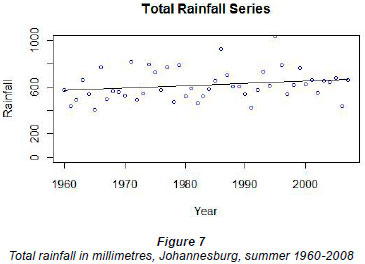
Total rainfall
The final analysis conducted is of total rainfall (thunderstorms and other rainfall) for the summer season across the period as shown in Fig. 7. A regression model was applied to the distribution. The model showed no significant statistical trend over the period.
The results from this study are corroborated by those of the Krugersdorp study (CoJ, 2009). The decrease in thunderstorm frequency identified in this study, links well to the increase in number of dry days in Krugersdorp. Both studies found there to be no trend in rainfall events where more than 10 mm of rain fell in a 24-hour period. Neither of these 2 studies can be easily linked with Dyson's study as it searched for daily rainfall characteristics rather than trends. The isolated heavy rainfall events noted in this study are however, also identified in Dyson's study (Dyson, 2009).
As noted above, the results of such isolated studies should not be used to infer trends for broader scales (Denault et al., 2006). Although these changes cannot be explicitly attributed to anthropogenic climate change, the results of this study link well with some climate change projections. Nevertheless, the findings of the investigation into thunderstorm variability in the CoJ reveal some very interesting and potentially significant changes over time. Uncertainties and limitations are inherent in climatic studies of this nature.
Uncertainties and limitations
Uncertainties and limitations are inherent in climatic studies of this nature. A key uncertainty in the study relates to the classification of thunderstorms and significant rainfall events. Three criteria are used to make this classification and are based on the available information from the SAWS. The SAWS data is assumed correct and thus this study indicates the minimum number of storms for the period. The data includes cloud type, rainfall and the observation of a thunderstorm by an observer. Cloud type and thunderstorm observations are both subject to error. There might have been occasions where a storm or the cloud type was not recorded due to a more dominant weather event at the time of observation. Storms may have been missed if one occurred between observation times but was not present at the recorded time. Both situations imply the possibility that more storms occurred than were recorded. The results from these datasets are tested by dropping the cloud type and thunderstorm observation respectively from the 2 tests. The resulting trends are essentially the same in all situations.
The results of this study are fundamentally dependent on the construction and interpretation of what classifies a thunderstorm and of particular importance is the classification of heavy rainfall events. The social implication of such events is usually perceived to be greater than less intense events. Although the most intense storms (in this study, those with rainfall over 10 mm) can potentially cause great damage, much smaller storms, however, can also lead to similar amounts of damage (Satterthwaite et al., 2007). The impacts of thunderstorms over the past 50 years are not investigated in this study. It is suggested that such studies should be conducted to improve the understanding of thunderstorm impacts. These studies could use an integrated approach using insurance loss data, interviews with affected people as well as runoff, drainage and flow data.
Notwithstanding the caveats and limitations of this study, the results of this research provide useful information on possible changing rainfall with respect to thunderstorms in the CoJ. This study should not be viewed as conclusive or comprehensive in its analysis of thunderstorms in the CoJ. As is noted in the Fourth Intergovernmental Panel on Climate Change (IPCC) Assessment, Working Group 1 report, climate change research is inherently uncertain and thus further study in this field is required to verify the results (Christensen et al., 2007). The results of this study, nonetheless, provide some evidence that thunderstorm patterns at the OR Tambo Weather Station are not stable and some change is apparent.
Discussion
The results of the climate study show that trends in frequency and intensity of storms are evident in the CoJ for the period 1960-2008. Although these findings enhance the current understanding of the local climate and recent variability, the results are only from 1 station. It is therefore difficult to link the results to a wider policy response.
Notwithstanding the limitations of the 'size' of the data set, the study provides an interesting entry point to begin a discussion with city officials on the possible implications of climate change and other development challenges in the city. Flooding in the recent past (2009) has had severe impacts on residents in Johannesburg including loss of life (Mail and Guardian, 2009). As indicated at the outset of this paper, parts of Soweto were declared disaster areas due to intense flooding. City officials made site inspections and emergency meetings were held to create solutions. Such seemingly ad hoc responses are at odds with the Disaster Management Act (RSA, 2002), which calls for vulnerability assessments and a more proactive response to risk reduction. Storm events, such as those that occurred in 2009, should therefore not be viewed as surprise and isolated shock events but should rather form part of a sustainable planning and development dialogue in the City (e.g. stormwater planning and infrastructure). As Rayner points out in the foreword to Hulme's (2009) recent book, the purpose of dialogue about the possibility of climate change is not to scare people about a physical 'threat' but to use climate change as a vehicle to begin to examine a range of other issues that are 'unveiled' as one tries to better 'manage' climate threats such as storms:
'...climate change debates are more than merely a peg on which different interest groups can hang their particular agendas. Rather climate change provides a much needed arena and stimulus for public discussion of the big issues of our time.' (Rayner in Hulme, 2009: xxiii)
Many communities depend on their local municipality to provide risk reduction strategies to enable adaptation and recovery from the effects of heavy rainfall events. Several other dimensions also need consideration when gearing up for, and ensuring resilience to, periods of potential climate stress. These include assessing the governance structures and processes of various institutions designed to intervene. Policies and institutions, for example, require a level of flexibility in their approach to disaster response as the extent and type of risks as well as the needs of the affected communities are likely to change from one disaster to the next (Dietz et al., 2003).
In the case examined here, we argue that it is not sufficient to only communicate technical risk information; there is also the need for those affected (e.g. policy-makers and civic society) to understand the nature of the issues they are dealing with. It is important for scientists to also listen to and embrace, where applicable, other perceptions and insights on the problems, so that solutions can be co-designed. To aid this process in the CoJ, particularly regarding storm risk management, we suggest that improved knowledge of the past and future climate and environment for the city, on the one hand, is necessary. It is also important, on the other hand, for city planners (e.g. stormwater drainage and spatial planners) to understand how storm variability affects urban and environmental systems (CCSP, 2008b). Combining knowledge, which includes how storm variability is likely to change together with the sensitivity of the affected urban and environmental systems to such changes, we suggest, may enable the development of comprehensive plans to reduce the vulnerability of these systems to the associated risks of thunderstorms.
In addition, city officials and wider civic society (e.g. NGOs and various communities) also need to be able to assess critically the credibility of models and risk scenarios that they are provided with. Rayner and Malone (1998) note, for example, that climate change should be joined to issues of societal resilience including development and other issues. The challenge, they argue, is to make climate change information and knowledge more politically relevant. Rather than isolating the science of storms and their occurrence into an academic silo and an academic paper, the way forward is through a more meaningful involvement of the potential uses of scientific and local knowledge. By working closely with the users of this knowledge and those affected by the outcomes of climate science, the public, many useful insights can be gained, which can complement the science of climate change. Co-produced information can feed into the routine decision-making frameworks of governments (Cohen et al., 1998).
A detailed assessment of governance and perceptions of climate change, including an assessment of policy processes and products, is required to understand how and why certain aspects of the 'climate story' are being raised as focal points while others are possibly allowed to remain silent. This is particularly important, given South Africa's role in international climate change negotiations, where mitigation measures and adaptation projects are debated. Mitigation measures may have serious knock-on impacts for local energy production and usage. A range of issues and questions arise from the paper presented here. For example: how does the CoJ perceive and frame climate risks with respect to climate change, climate variability and storms? Who is driving this agenda and for what ends? In an attempt to show the current need to develop the climate dialogue, to be one that contains reflections of sustainable development, we include an initial examination of the recently completed plan that focused specifically on climate change adaptation themes, namely, the CoJ CCAP (2009). Other related policy could also be included (e.g. National Environment Management Act; Integrated Development Plans, etc). The advantage of an initial assessment of the CoJ adaptation plan is that is shows the processes of gathering information and enables an examination of a range of issues that are being used in framing the City's potential response to climate change.
The method used here for an initial interrogation of current climate policy in the City was a simple one. A comprehensive study would require a much more targeted assessment of governance and justice dimensions in the City (e.g. Adger, 2001; Adger et al., 2009; Demeritt et al., 2010). The approach used here was to look at the language and discourse that is used and to tease out how and in what ways storm risk is being articulated. Is the language mostly technical in nature or is there reference to some of the crosscutting and related issues that are linked to climate risks (i.e. those factors that shape vulnerability to climate risks)? How are communities most at risk included in such assessments, if at all? As Jasanoff (2010) suggests, the framing, vulnerability, distribution and deliberative learning associated with risk assessments (e.g. storms) also require attention. Thus, while we have begun to explore such notions in this simple assessment, more probing is clearly required to answer the questions that Jasanoff (2010) poses: 'What do we know about the risk and how do we know it? Who is likely to be hurt? How will the losses be distributed? And how can we reflect most effectively on our collective experiences of vulnerability and loss?' (Jasanoff, 2010: 31, emphasis added).
While the technical risk assessments are evident in the CoJ's CCAP, the document is notably silent on the 'collective experiences of vulnerability and loss'. According to the CoJ CCAP (2009), Johannesburg is likely to see an increase in annual rainfall, characterised by an increase in the frequency of heavy storm events and a longer storm season (much like the data assessment for thunderstorm occurrence that is profiled in this paper). The systems that are likely to be most affected by climate change are those that are already under stress in the current climatic conditions (CoJ, 2009). The document states that the CoJ's rainfall season is characterised by an average of 713 mm of rainfall, which falls mainly from October to April. The nature of rainfall characteristic of the region (thunderstorms) makes the city more susceptible to flooding events due to the high volumes of runoff that can be produced in a short period of time (CoJ, 2009). According to more detailed climate model predictions, occurrences of heavy storms (those with a minimum of 10 mm of rainfall) are expected to increase in frequency (CoJ, 2009). The analysis and prediction of trends are mostly limited to model projections, except for a study that was conducted in Krugersdorp (referred to above) (CoJ, 2009).
It is noted in the CCAP that the past few rainy seasons have placed great pressure on the Johannesburg Road Agency (JRA) and have had negative impacts on informal settlements and the transport sector in particular. It observes that '[t]he impact on the CoJ due to climate change ... is one issue that cannot be adequately addressed without an in depth study of projected rainfall and temperature changes' (CoJ, 2009: 37). The impacts to the city's environment are then discussed and briefly summarised in a few key points. These include the damage to sanitation and water supply infrastructure that can lead to health risks, the economic consequences of damage to property and infrastructure, traffic accidents, traffic congestion and power supply issues (CoJ, 2009). These are only some of the many consequences of heavy storm and flood events in the city.
The complexities relating to thunderstorms and their impacts are mentioned throughout the CoJ's adaptation plan. The impacts and projected thunderstorm changes are discussed in most of the document. There is, however, a lack of detail and focus within these areas, especially in light of their potential to increase risk and vulnerability in the city. The document focuses largely on a technical assessment of climate risks and is silent on the perceptions of risk of the most vulnerable or indeed of how the City authorities themselves frame and view climate risks as a result of storms.
The CCAP and strong reference to storm water management resonates with the assessment of storm characteristics presented in this paper. The plan is very good at highlighting such technical dimensions of risk and goes so far as to categorise the key risks that no doubt will have influence in how the City plans interventions into the future. The document profiles key strategic adaptations, namely, integration of adaptation into planning; developing alternative financing options for funding adaptation, developing a climate information system and improving stakeholder engagement. The document is silent, however, on the wider framings of risk, including those perceptions of risk and even observed climate variations from the most vulnerable in the City. This dimension, we argue, also requires attention, particularly if we as a community in the City are to reduce risks, particularly for the most vulnerable.
Decisions made now may compound or reduce future climate risks. A key difficulty in making these decisions is in both dealing with the uncertainty inherent in climate science (e.g. modelling a complex climate system from a physical sciences perspective), and considering the required responses to future climate risks (e.g. risk communication, governance approaches and what may be termed '... the politics of intervention') (Lakoff, 2010) (see also Dow and Carbone, 2007; Moser and Dilling, 2007; Demeritt et al., 2010). The IPCC, for example, highlights the high level of uncertainty in climate change projections that makes it difficult to incorporate climate projections directly into policy (Ha-Duong et al., 2007; Le Treut et al., 2007). Others have also more recently begun to seriously interrogate and probe other dimensions of the interface between the science of climate change and the varied discourses on 'what to do about climate change and disaster risk interventions' (see for example Hulme, 2009; Lakoff, 2010; Jasonoff, 2010).
Conclusion
In this paper, we have shown how a focus on thunderstorms, and their characteristics over time, can be used as an entry point in trying to begin a wider dialogue on climate change, one which goes beyond a technical climate change debate. Recent presentations of this work have, for example, prompted press coverage and generated interest from the City and resonate with some of the climate outlooks in the cities adaptation plan. Is this enoughm however, for effective adaptation to climate stress in the City?
There is evidence from this study that the frequency and intensity of thunderstorm events in the CoJ appear to be changing over time. Such possible changes raise a range of issues that are of relevance for city managers, planners and residents in the city. Statistical assessments of storm characteristics are important, as we have shown, but so too are the lived experiences of those who experienced, for example, one of the most recent flooding events in the City (the event of 2009). We suggest that more details are required to inform 'adaptation plans for the city'. This requires information on: what the narrative from citizens (e.g. planners and residents) is regarding storm frequency and storm pattern; how flood risks are perceived and what responses are taken to 'manage' and live with flooding risks; and what resources residents have to cope with such events. Finally, what has been learnt, by the city and its residents, from such events to ensure that we are prepared for such occurrences in the near and more distant future? (Such an assessment is being undertaken by the authors in other municipal contexts as part of a Water Research Commission Project, and, we suggest, should also be undertaken for Johannesburg).
This paper has attempted to show that it is important to understand the range of issues that are brought to discussions on climate risk management, including 'thunderstorm' impacts and responses. These include improved assessments of climate data and storm patterns, but also, equally, understanding factors that influence climate risks and the myriad factors that compound the possible impacts associated with such risks. One single paper cannot hope to cover all aspects of climate change and the associated risks, as the discourse is highly complex and developing a language and means of navigating it is equally complex. Some elements have been profiled in this paper. Others associated with thunderstorms include urban flood risks, arising from a range of interacting factors such as the type, magnitude and frequency of the storm events, land cover changes, high population density and, in some cases, poor urban planning and disaster-risk reduction practises. Poor stormwater management systems and concrete surfaces, for example, can increase the chance of flooding events. People who live on floodplains, however, often occupy marginal areas because of a range of socio-political factors including poverty (Satterthwaite et al., 2007). These people, however, are not passive victims exposed to potential risks and usually possess a range of coping and other response strategies, which accumulate over time.
The process of deciding on the 'best' interventions to reduce disasters in complex urban settings is therefore not simple. Increasingly, policy makers are urged to consider effective adaptation and mitigation plans (e.g. responses to flooding) through an improved understanding of climate variability and change (e.g. Demerit et al., 2010). It is not sufficient, however, to rely only on climate change projections to inform a risk response. It is equally important to find effective ways to improve the capacity of decision makers (here we include not only city mangers but also residents that are impacted by flooding). There remains much scope to improve our understanding and our negotiation of climate risk management. This includes improving our understanding of past and current storm patterns as well as possible future climate changes. It is also important to increase our efforts to improve understanding the context in which adaptation decisions are being made e.g. city adaptation plans. Effective risk interventions require both improved technical knowledge and knowledge of how institutional and social capabilities can be 'cultivated so as to ensure that bad events, when they invariably happen, do less damage to human solidarity and human lives' (Jasanoff, 2010: 28).
Acknowledgments
We would like to thank the South African Weather Service for providing the climate data. A special thanks to Mark Dowdeswell and Prof. Paul Fatti from the Statistics department at the University of the Witwatersrand for your help and advice. Thanks also to those anonymous reviewers and others who gave their comments and suggestions for the paper; your help was invaluable.
References
ADGER WN (2001) Scales of governance and environmental justice for adaptation and mitigation of climate change. J. Int. Dev. 13 921-931. [ Links ]
ADGER WN, LORENZONI, I AND O'BRIEN K (eds.) (2009) Adapting to Climate Change: Thresholds, Values, Governance. Cambridge University Press, Cambridge [ Links ]
BOKO M, NIANG I NYONG A, VOGEL C, GITHEKO A, MEDANY M, OSMAN-ELASHA B, TABO R and YANDA P (2007) Africa. In: Parry ML, Canziani OF, Palutikof JP, Van der Linden PJ and Hanson CE (eds). Climate Change 2007: Impacts, adaptation and vulnerability; Contribution of Working Group II to the Fourth Assessment Report of the Intergovernmental Panel on Climate Change. Cambridge University Press. Cambridge. [ Links ]
CCSP (CLIMATE CHANGE SCIENCE PROGRAM, UNITED STATES) (2008a) Weather and climate extremes in a changing climate. Regions of focus: North America, Hawaii, Caribbean and US Pacific Islands. Karl TR, Meehl GA, Miller CD, Hassol SJ, Waple AM and Murray WL (eds). A Report by the US Climate Change Science Program and Subcommittee on Global Change Research. Washington DC. [ Links ]
CCSP (CLIMATE CHANGE SCIENCE PROGRAM, UNITED STATES) (2008b) Decision-Support experiments and evaluations using seasonal-to-interannual forecasts and observational data: A focus on water resources. Beller-Simms N, Ingram H, Feldman D, Mantua N, Jacobs KL and Waple AM (eds). A Report by the U.S. Climate Change Science Program and the Subcommittee on Global Change Research. Asheville. [ Links ]
CHRISTENSEN JH, HEWITSON B, BUSUIOC A, CHEN A, GAO X, HELD I, JONES R, KOLLI RK, KWON W-T, LAPRISE R, MAGÑA RUEDA V, MEARNS L, MENÉNDEZ CG, RÄISÄNEN J, RINKE A, SARR A and WHETTON P (2007) Regional climate projections. In: Solomon S, Qin D, Manning M, Chen Z, Marquis M, Averyt KB, Tignor M and Miller HL (eds.) Climate Change 2007: The Physical Science Basis in Contribution of Working Group I to the Fourth Assessment Report of the Intergovernmental Panel on Climate Change. Cambridge University Press, Cambridge and New York. [ Links ]
CoJ (CITY OF JOHANNESBURG) (2009) Climate Change Adaptation Plan. Vol. 1. Johannesburg. City of Johannesburg, South Africa. [ Links ]
COHEN S, DEMERITT D, ROBINSON J and ROTHMAN D (1998) Climate change and sustainable development: towards a dialogue. Global Environ. Change 8 (4) 341-371. [ Links ]
DEMERITT D, NOBERT S, CLOKE H, and PAPPENBERGER F (2010) Challenges in communicating and using ensembles in operational flood forecasting. Meteorol. Appl. 17 209-222. [ Links ]
DENAULT C, MILLAR RG and LENCE BJ (2006) Assessment of possible impacts of climate change in an urban catchment. J. Am. Water Resour. Assoc. 42 (3) 685-697. [ Links ]
DIETZ T, OSTROM E and STERN P C (2003) The struggle to govern the commons. Sci. 302 1907-1912. [ Links ]
DOW K and CARBONE G (2007) Climate science and decision making. Geogr. Compass 1/3 302-324. [ Links ]
DYSON LL (2009) Heavy daily-rainfall characteristics over the Gauteng Province. Water SA 35 (5) 627-638. [ Links ]
ENGELBRECHT FA, McGREGOR JL and ENGELBRECHT CJ (2009) Dynamics of the Conformal-Cubic Atmospheric Model projected climate-change signal over South Africa. Int. J. Climatol. 29 (7) 1013-1033. [ Links ]
FAUCHEREAU N, TRZASKA S, ROULAULT M and RICHARD Y (2003) Rainfall variability and changes in Southern Africa during the 20th century in the global warming context. Nat. Hazards 29 139-154. [ Links ]
HA-DUONG M, SWART R, BERNSTEIN L AND PETERSEN A (2007) Uncertainty management in the IPCC: Agreeing to disagree. Global Environ. Change 17 8-11. [ Links ]
HULME M (2009) Why we Disagree about Climate Change: Understanding Controversy, Inaction and Opportunity. Cambridge University Press. Cambridge [ Links ]
JASANOFF S (2010) Beyond calculation A democratic response to risk, in Lakoff A. (ed.) Disaster and the Politics of Intervention. The Columbian University Press and Social Science Research Council Series on the Privatisation of Risk, New York. 14-40. [ Links ]
KRUGER AC (2006) Observed trends in daily precipitation indices in South Africa: 1910-2004. Int. J. Climatol. 26 2275-2285. [ Links ]
LAKOFF A (ed.) (2010) Disaster and the Politics of Intervention. The Columbian University Press and Social Science Research Council Series on the Privatisation of Risk, New York [ Links ]
LE TREUT H, SOMERVILLE R, CUBASCH U, DING Y, MAURITZEN C, MOKISSIT A, PETERSON T and PRATHER M (2007) Historical overview of climate change. In: Solomon S, Qin D, Manning M, Chen Z, Marquis M, Averyt KB, Tignor M and Miller HL (eds.) Climate Change 2007: The Physical Science Basis in Contribution of Working Group I to the Fourth Assessment Report of the Intergovernmental Panel on Climate Change. Cambridge University Press, Cambridge and New York. [ Links ]
MAIL AND GUARDIAN (2009) Two children die in Soweto floods. Mail and Guardian, 27 Feb 2009. [ Links ]
MASON SJ and JOUBERT AM (1997) Simulated changes in extreme rainfall over Southern Africa. Int. J. Climatol. 17 291-301. [ Links ]
MASON SJ, WAYLEN PR, MIMMACK GM, RAJARATNAM B and HARRISON JM (1999) Changes in extreme rainfall events in South Africa. Clim. Change 41 249-257. [ Links ]
MEEHL GA, STOCKER TF, COLLINS WD, FRIEDLINGSTEIN P, GAYE AT, GREGORY JM, KITOH A, KNUTTI R, MURPHY JM, NODA A, RAPER SCB, WATTERSON IG, WEAVER AJ and ZHAO Z-C (2007) Global climate projections. In: Solomon S, Qin D, Manning M, Chen Z, Marquis M, Averyt KB, Tignor M and Miller HL (eds.) Climate Change 2007: The Physical Science Basis in Contribution of Working Group I to the Fourth Assessment Report of the Intergovernmental Panel on Climate Change. Cambridge University Press, Cambridge and New York. [ Links ]
NEW M, HEWITSON B, STEPHENSON DB, TSIGA A, KRUGER A MANHIQUE A, GOMEZ B, COELHO CAS, MASISI DN, KULULANGA E, MBAMBALLAL E, SALEH H, KAYANGA J, ADOSI J, BULANE L, FOTUNATA L, MODOKA LM and LAJOIE R (2006) Evidence of trends in daily climate extremes over southern and west Africa. J. Geophys. Res. 111 D14102. [ Links ]
RAYNER S and MALONE EL (eds.) (1998) Human Choice and Climate Change. Batelle Press. Columbus. [ Links ]
RSA (REPUBLIC OF SOUTH AFRICA) (2002) Disaster Management Act (Act No. 57 of 2002). Government Gazette No. 24252. Cape Town. [ Links ]
ROBERTS D (2008) Thinking globally, acting locally institutionalizing climate change at the local government level in Durban, South Africa. Environ. Urbanization 20 521-537. [ Links ]
SATTERTHWAITE D, HUQ S, PELLING M, REID H and LANKO PR (2007) Adapting to climate change in urban areas: The possibilities and constraints in low- and middle-income nations, IIED Human Settlements Discussion Paper Series. URL: http://www.iied.org/HS/topics/accc.html (Accessed 20 July 2009). [ Links ]
TYSON PD and PRESTON-WHYTE RA (2000) The Weather and Climate of Southern Africa. Oxford University Press, Cape Town. [ Links ]
WILLIAMS CJR, KNIFETON DR and LAYBERRY R (2008) Influence of South Atlantic sea surface temperatures on rainfall variability and extremes over Southern Africa. J. Clim. 21 6498-6520. [ Links ]
Received 15 April 2010; accepted in revised form 22 December 2010.
* To whom all correspondence should be addressed. +2711 717 6502; fax: +2711 788 9943; e-mail: tina.fatti@gmail.com

