


Services on Demand
Article
 English (pdf)
 Article in xml format
 Article references
Indicators

Related links
-
 Cited by Google
 -
 Similars in Google
Share

 Permalink
Water SA
On-line version ISSN 1816-7950
Print version ISSN 0378-4738
Water SA vol.37 n.1 Pretoria Jan. 2011
Application of the mixture design to decolourise effluent textile wastewater using continuous stirred bed reactor
Lamia AyedI,*; Sami AchourII; Amina BakhroufI
ILaboratoire d'Analyse, Traitement et Valorisation des Polluants de l'Environnement et des Produits, Faculté de Pharmacie, Rue Avicenne, 5000 Monastir, Tunisie
IIUnité de recherche Génome Humain, Diagnostic Immunitaire et Valorisation à l'Institut Supérieur de Biotechnologie, 5000 Monastir (Tunisie)
ABSTRACT
Important pollutants in textile effluents are mainly recalcitrant organics, colours, toxicants and inhibitory compounds, surfactants, chlorinated compounds (AOX), pH and salts. An aerobic system using a continuous stirred bed reactor (SBR) was continuously operated at constant temperature and fed with textile wastewater (pH 7 and total chemical oxygen demand (COD) 1 700 mg/ℓ).This report is focused on the decolourisation treatment of effluent by a bacterial consortium (Sphingomonas paucimobilis, Bacillus sp. and filamentous bacteria). The influence of the different mixtures of 3 strains on the decolourisation of effluent (cell density fixed at OD600 = 1) was studied using an equilateral triangle diagram and mixture experimental design to assess colour and COD removal during species evolution. With the aid of analysis software (Minitab 14.0), the formulation of pure culture was optimised for several responses and the best formulation obtained. The results suggested that the highest predictable specific decolourisation rate and chemical oxygen demand (COD) were 86.72% and 75.06%, respectively. Regression coefficients between the variables and the responses of decolourisation and COD removal were, respectively, R2 = 72.48% and 54.28%, which indicated excellent evaluation of experimental data by the polynomial regression model. UV-visible analysis confirmed biodegradation of effluent.
Keywords: textile wastewater, bacterial decolourisation, response surface, mixture design, SBR
Introduction
Textile industries consume a considerable amount of water in their manufacturing processes. Considering both the volume and the effluent composition, textile industry wastewater is rated as the most polluting among all industrial sectors. Important pollutants in textile effluents are mainly recalcitrant organics, colours, toxicants and inhibitory compounds, surfactants, chlorinated compounds (AOX), pH and salts (Sen and Demirer, 2003). From the environmental point of view, the textile industry is also one of the most water- and chemical-intensive industries worldwide (Arslan Alaton et al., 2006). Isolation of anaerobic bacteria species capable of degrading dyestuff indicated that anaerobic decolourisation is a simpler and efficient colour removal technology, compared to other physical/chemical and biological methods (Nigam et al., 1996; Chang et al., 2001; Chen et al., 2003; Idaka et al., 1987). Colour can be removed from wastewater by chemical and physical methods including absorption, coagulation-flocculation, oxidation and electrochemical methods. These methods are quite expensive, have operational problems (Forgas et al., 2004), and generate large quantities of sludge (Kapdan and Kargi, 2002). Among low-cost, viable alternatives available for effluent treatment and decolourisation, the biological systems are recognised by their capacity to reduce biochemical oxygen demand (BOD) and chemical oxygen demand (COD) by conventional aerobic biodegradation (Sandhaya et al., 2005; Balan and Monteiro, 2001; Dubin and Wright, 1975; Chung et al., 1992). Colour removal under anaerobic condition could be by biodegradation of dyestuff by azoreductase activity (Craliell et al., 1995) or by non-enzymatic azo reduction of dyestuff (Flores et al., 1997; Brown and DeVito, 1993; Knapp and Newby, 1995). However, azoreductase cleavage of azo bonds may result in formation of aromatic amines, which induces melanomas in humans and experimental animals (Chung et al., 1992; Brown and DeVito, 1993). But, some reports showed that the effluent of the anaerobic decolourisation process was completely non-toxic (Flores et al., 1997). Another problem with anaerobic colour removal is the reverse colourisation of anaerobic degradation products upon exposure to oxygen. This could be because of unstable characteristics of biodegradation products, aromatic amines, which deteriorate to give colour (Knapp and Newby, 1995; Chinwetkitvanish et al., 2000).
In this research, we used the mixture design in the experimental design (Minitab 14.0) to optimise the formulation of the predominant strains isolated from a textile wastewater plant. After biodegradation, the chemical oxygen demand (COD) and percentage of decolourisation were measured. The relationships between the different combinations and products were analysed by Minitab to select the optimal bacterial combination and to investigate the aerobic degradability of a textile industry waste-water in Tunisia by an aerobic stirred bed reactor (SBR).
Materials and methods
Materials
The microbial strains were microcapsules of Sphingomonas paucimobilis (14×107 cfu), Bacillus sp. (4.2×10⁸ cfu) and filamentous bacteria (6×10⁹ cfu), which were isolated from a textile wastewater plant in Ksar Hellal, Tunisia. Sphingomonas paucimobilis and Bacillus sp. were isolated in previous studies by Ayed et al. (2009a; b), and have the ability of degrading azo and triphenylmethane dyes (Congo Red, Methyl Red, Malachite Green and Crystal Violet). All chemicals used were of the highest purity available and of analytical grade.
Nutrient agar preparation
Nutrient agar was used as the growth medium for microbial isolation. For this purpose, 28 g of nutrient agar was dissolved in 1 ℓ of distilled water, and was then autoclaved at 121ºC for 20 min. After autoclaving, the agar was left to cool at room temperature for 15 min, and was then poured out into Sterilin© disposable petri dishes.
Microbial strain
The culture was cultivated and maintained by weekly transfers on to nutrient agar slants. For production experiments, the culture was revived in nutrient broth (pH 7.0) and freshly prepared 3 h old culture (λ600 nm= 1) prepared in mineral salt medium (MSM) at 37ºC, 150 r/min (New Brunswick Scientific Shaker, Edison, NJ) was used as the inoculum. The used medium was composed in 1 000 mℓ of distilled water: glucose (1 250 mg/ℓ), yeast extract (3 000 mg/ℓ), MgSO4 (100 mg/ℓ); (NH4)2SO4 (600 mg/ℓ); NaCl (500 mg/ℓ); K2HPO4 (1 360 mg/ℓ); CaCl2 (20 mg/ℓ); MnSO4 (1.1 mg/ℓ); ZnSO4 (0.2 mg/ℓ); CuSO4 (0.2 mg/ℓ); FeSO4 (0.14 mg/ℓ). The medium was maintained at a constant pH of 7 by the addition of phosphate buffer (Ayed et al., 2010a; b; c).
Acclimatisation
The acclimatisation was performed by gradually exposing Sphingomonas paucimobilis, Bacillus sp. and filamentous bacteria to the higher concentrations of effluent (Kalme et al., 2006). These bacteria were grown for 24 h at 30ºC in 250 mℓ Erlenmeyer flasks containing yeast extract (3.0 g/ℓ) and glucose (1.25 g/ℓ) (pH 7.0). During the investigation, nutrient broth concentration was decreased from 90% (w/v) to 0% (w/v), and finally the organism was provided with effluent as sole source of nutrient. Acclimatisation experiments were carried out at optimum temperature (Kalme et al., 2006).
Operational conditions of laboratory bioreactors
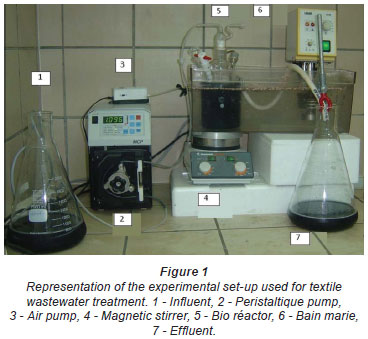
A laboratory-scale aerobic bioprocess, as shown in Fig. 1, was used in this study. The aerobic system used was an SBR bioreactor. The system was operated continuously at a constant temperature of 30ºC, using an external water bath. A continuous stirred tank reactor with a 500 mℓ working volume was used. Mixing was assured by the continuous rotation of the magnetic stirrer. The system was first inoculated with a microbial consortia (Sphingomonas paucimobilis, Bacillus sp. and filamentous bacteria) obtained from a textile wastewater treatment plant. These inocula were selected because of the large variety of microorganisms that could be found in the biomass, degrading dyes in textile wastewater, and because the use of mixed cultures offer considerable advantages over the use of pure culture. In fact, individual strains may attack the dye molecules at different positions or may use decomposition products produced by another strain for further decomposition. It has been reported that adaptation is important for successful decolourisation, and as acclimation occurred the decolourisation time becomes constant (Buitron and Quezada Moreno, 2004). The system was fed by a peristaltic pump with the textile effluent obtained from a textile wastewater plant in Ksar Hellal (Tunisia); pH was maintained at approximately 7. Air was provided using diffusers and an air pump. Bioreactor operating conditions were: COD - 1 700 mg O2/ℓ; BOD5 - 400 mg O2/ℓ; colour - 3 600 (U.C); pH - 7; MES - 810 mg/ℓ.
Analytical methods
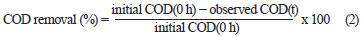
The effluent from each bioreactor was collected daily, centrifuged at 6 000 r/min for 10 min and analysed for colour, COD, pH, volatile suspended solids (VSS) and colony forming units (cfu). COD and colour measurements were carried out on the clear supernatant. Colour was measured by a UV-vis spectrophotometer (Spectro UV-Vis Double Beam PC Scanning spectrophotomètre UVD-2960) at a wavelength of 275 nm, at which maximum absorbance spectra were obtained (Fig. 1). The decolourisation and COD removal were calculated according to the following formulation (Eq. (1) and Eq. (2)) (Ayed et al., 2009a; b).
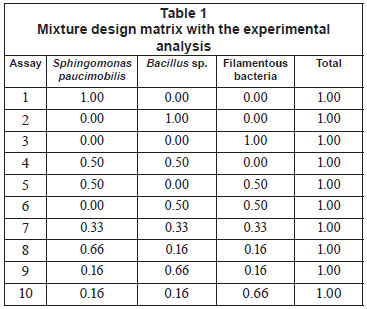
In this study, Sphingomonas paucimobilis, Bacillus sp. and filamentous bacteria were used as mixture starters, with different proportions ranging from 0 to 100%, as shown in Table 1. Decolourisation experiments were conducted according to the ratio given by the experimental design, and 10% of mixed culture were inoculated into the effluent (3.0 g/ℓ yeast extract and 1.25 g/ℓ glucose) at 37ºC for 10 h under shaking conditions (150 r/min) (Ayed et al., 2010a; b; c).

where
I was the initial absorbance and
F the absorbance at incubation time t
The pH was measured using a digital calibrated pH-meter (Inolab, D-82362 Weilheim Germany). All assays were carried out in triplicate.
UV-vis spectral analysis
Decolourisation of effluent (diluted 5%) was followed by monitoring the change in its absorption spectrum (200-700 nm) using a Hitachi UV-vis spectrophotometer (Hitachi U-2800) and comparing the results to those of the respective controls. The metabolites produced during the effluent biodegradation (after decolourisation of medium) were centrifuged at 15 000 r/min for 30 min, after complete degradation of adsorbed dye, to remove any bacterium remaining, and metabolites were extracted from the supernatant by adding an equal volume of ethyl acetate; the samples were used for UV-vis spectral analysis.
Results and discussion
Model establishment
Through linear regression fitting, the regression models of the 2 responses (COD % and decolourisation %) were established. The regression model equations were as follows:
Ydecolourisation% = 86.60 S1 + 57.42 S2 + 68.42S3+ (-3.068) S1*S2+ (3.409) S1*S3+ (-0.320) S2*S3
R2= 72.48%; 0,245
YCOD% = 65.995 S1 + 75.309 S2 + 69.297 S3 + (-0.649) (S1*S2) + (-298) (S1*S3) + (-0.808) (S2*S3)
R2 = 54.28%; P = 0,535
where:
S1 is Sphingomonas paucimobilis
S2 is Bacillus sp. and
S3 is filamentous bacteria.
Effect of formulation on the percentage of decolourisation and COD removal of effluent
The mixture design is now used widely in formulation experiments for food, chemicals, fertilisers, pesticides, and other products. It can estimate the relationship between formulation and performance through regression analysis (Zhang et al., 2006). Zhang et al. (2006) studied the formulation of a plant protein beverage using the mixture design, obtaining the optimised combination of walnut milk, peanut milk, and soy milk. In the mixture design, the effect of the change of variables on the responses can be observed on the ternary contour map. Figure 1 shows the effect of the interaction of Sphingomonas paucimobilis, Bacillus sp. and filamentous bacteria on the decolourisation of effluent; Fig. 2 shows the effect of the interaction of Sphingomonas paucimobilis, Bacillus sp. and filamentous bacteria on the variation of COD. The statistical significance of the ratio of mean square variation due to regression and mean square residual error was tested using analysis of variance (ANOVA).

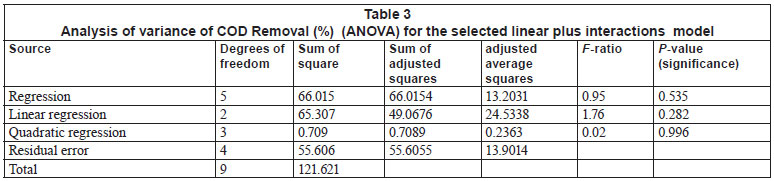
Only results obtained for decolourisation and COD removal are presented herein. According to the ANOVA (Tables 2 and 3), the regression adjusted average squares was 156.402 and the linear regression adjusted average squares was 238.445, allowing for the calculation of the Fisher ratios (F-value) for assessing the statistical significance. The model F-value (2.11) implies that most of the variation in the response can be explained by the regression equation.
The P-value for the regression obtained (R2= 72.48%; P=0.245) for decolourisation was greater than 0.1; thus at least one of the terms in the regression equation was significantly correlated with the response variable.
The non-significant value of lack of fit (>0.05) at the 95% confidence level revealed that the quadratic model was statistically significant for the response and could therefore be used for further analysis (Zhou et al., 2007). The ANOVA test also shows a term for residual error, which measures the amount of variation in the response data left unexplained by the model (Xudong and Rong, 2008). The collected data were analysed using Minitab® 14 Statistical Software in order to evaluate the effect of each parameter on the optimisation criteria. In order to determine which process parameters have a significant effect on dye removal, an analysis of variance was performed.
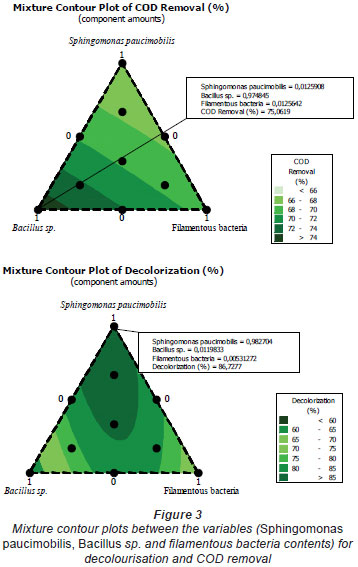
Colour removal from the textile wastewater was investigated under different experimental conditions. The mixture contour plots between the variables, such as Sphingomonas paucimobilis, Bacillus sp. and filamentous bacteria, are given in Fig. 3. The lines of contour plots predict the values of each response at different proportions of Sphingomonas paucimobilis, Bacillus sp. and filamentous bacteria. These values are more or less the same as the experimental values.
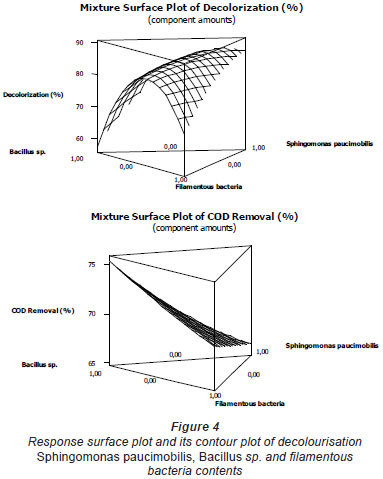
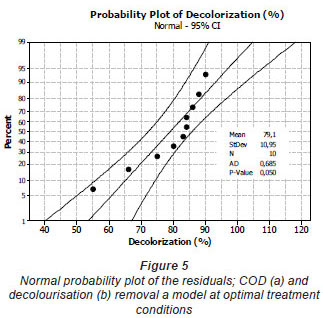
The mixture surface plots (Fig. 4), which are 3-dimensional graphs, were represented using decolourisation and COD removal based on the simultaneous variation of Sphingomonas paucimobilis, Bacillus sp. and filamentous bacteria in the consortium composition ranging from 0 to 100% for each strain. The mixture surface plot also describes individual and cumulative effects of these 3 variables and their subsequent effect on the response (Liu et al., 2009; Ayed et al., 2010b;c). Adequacy of the model was also checked by means of constructing the normal plot of the residuals (Fig. 5). The values of residuals (i.e. observed minus predicted values of YCOD) can then be plotted in a normal probability plot for COD removal (Fig. 5a). All points from this residual plot lie close to the straight line, confirming the conjecture that effects other than those considered in the model may be readily explained by random noise. Adequacy of the model was also checked by means of constructing the normal plot of the residuals (Ydecolourisation) for decolourisation removal (Fig. 5b). Once again, all points from this residual plot lie close to the straight line, confirming the conjecture that effects other than those considered in the model may be readily explained by random noise (Deligiorgis et al., 2008).

Biodecolourisation analysis
Decolourisation of effluent was followed by monitoring changes in absorption spectrum (200-700 nm) and comparing the results to those of the respective controls. The UV-vis spectrum (Fig. 2) of effluent showed a decrease in optical density after 72 h. Peaks observed (275, 365 and 255nm) at the initial time of zero hours were decreased without any shift in λ max, up to complete decolourisation of the medium.
Conclusion
In this study, the mixture design method was used for the multi-objective optimisation of bacterial consortium, with the decolourisation in biodegradation process as response. The results suggest that decolourisation by mono- and constructed mixed cultures showed that Sphingomonas paucimobilis accounted for the majority of decolourisation activity for bio-treatment of dye pollutants. Moreover, Bacillus sp. accounted for the majority of COD removal. Through the establishment of the regression model and the analysis of the interaction between the variables, and by combining the optimisation functions of the mixture design software, the mixture design was proven to be effective for the optimisation of mixed decolourising starter involving several species. This method will shorten the development cycle of novel culture starter and improve the accuracy of the experimental design. Thus, UV spectral data confirm the observed experimental results on COD and colour reduction. The demonstrated ability of these organisms to decolourise various textile dyes indicates their commercial applicability.
References
ARSLAN ALATON I, INSEL G, EREMEKTAR G, GERMIRLI BABUNA, F and ORHON D (2006) Effect of textile auxiliaries on the biodegradation of dye house effluent in activated sludge. Chemosphere. 62 1549-1557. [ Links ]
AYED L, CHAIEB K, CHEREF A and BAKHROUF A (2009a) Biodegradation of triphenylmethane dye Malachite Green by Sphingomonas paucimobilis. World J. Microbiol. Biotechnol. 25 705-711. [ Links ]
AYED L, CHERIAA J, LAADHARI N, CHEREF A and BAKHROUF A (2009b) Biodegradation of Crystal Violet by an isolated Bacillus sp. Ann. Microbiol. 59 267-272. [ Links ]
AYED L, ACHOUR S, KHELIFI E, CHEREF A and BAKHROUF A (2010a) Use of active consortia of constructed ternary bacterial cultures via mixture design for Congo Red decolorization enhancement. Chem. Eng. J. 162 495-502. [ Links ]
AYED L, CHAIEB K, CHEREF A and BAKHROUF A (2010b) Biodegradation of triphenylmethane dyes by Staphylococcus epidermidis. Desalination. 260 137-146. [ Links ]
AYED L, KHELIFI E, BEN JANNET H, MILADI H, CHEREF A, ACHOUR S and BAKHROUF A (2010c) Response surface methodology for decolorization of azo dye Methyl Orange by bacterial consortium: Produced enzymes and metabolites characterization. Chem. Eng. J. 162 495-502. [ Links ]
BALAN DSL and MONTEIRO RTR (2001) Decolourization of textile indigo dye by ligninolytic fungi. J. Biotechnol. 89 141-145. [ Links ]
BROWN MA and DEVITO SC (1993) Predicting azo dye toxicity. Crit. Rev. Environ. Sci. Technol. 23 249-324. [ Links ]
BUITRON G and QUEZADA MORENO M (2004) Aerobic degradation of the azo dye acid red 151 in a sequencing batch biofilter. Bioresour. Technol. 92 143-149. [ Links ]
CHANG JS, CHOU C, LIN Y, LIN P, HO, J and HU TL (2001) Kinetic characteristics of bacterial azo-dye decolorization by Pseudomonos Luteola.Water Res. 35 2842-2850. [ Links ]
CHEN K, WU JY, LIOU DJ and HWANG SJ (2003) Decolorization of the textile dyes by newly isolated bacterial strains. J. Biotechnol. 101 57-60. [ Links ]
CHINWETKITVANISH S, TUNTOOLVEST M and PAAANSWARD T (2000) Anaerobic decolorization of reactive dyebath effluents by a two stage UASB system with topica co-substrate. Water Res. 34 2223-2232. [ Links ]
CHUNG KT, STEWANS SE and CARNIGLIA EC (1992) The reduction of azo dyes by the intestinal microflora. Crit Rev Microbiol. 18 175-190. [ Links ]
CRALIELL CM, BARCLAY SJ, NIDOO H, BUCKLEY CA, MULHOLLAND DA and SENIOR E (1995) Microbial decolorization of a reactive azo dyes under anaerobic conditions. Water SA 21 61-69. [ Links ]
DELIGIORGIS A, XEKOUKOULOTAKIS NP and DIAMADOPOULOS E (2008) Electrochemical oxidation of table olive processing wastewater over boron-doped diamond electrodes: Treatment optimization by factorial design. Water Res. 42 1229-1237. [ Links ]
DUBIN P and WRIGHT KL (1975) Reduction of azo food dyes in cultures of Proteus vulgaris. Xenobiotica 5 563-571. [ Links ]
FLORES ER, LUIJTEN M, DONLON B, LETTINGA G and FIELD J (1997) Biodegradation of selected azo dyes under methanogenic conditions. Water Sci. Technol. 36 65-72. [ Links ]
FORGAS E, CSERHATI T and OROS G (2004) Removal of synthetic dyes wastewaters: a review. Environ. Int. 30 953-971. [ Links ]
IDAKA E, HORITSU H and OGAWA T (1987) Some properties of azoreductase produced by Pseudomonas cepacia. Bull. Environ. Contam. Toxicol. 39 982-989. [ Links ]
KALME SD, PARSHETTI GK, JADHAV SU and GOVINDWAR SP (2006) Biodegradation of benzidine-based dyes direct blue 6 by Pseudomonas desmolyticum NCIM 2112. Bioresour. Technol. 98 1405-1410. [ Links ]
KAPDAN IK and KARGI F (2002) Biological decolorization of textile dyestuff containing wastewater by Coriolus versicolor in a rotating biological contractor. Enzyme Microb. Technol. 30 195-199. [ Links ]
KNAPP JS and NEWBY PS (1995) The microbiological decolorization of an industrial effluent containing a diazo-linked chromophore. Water Res. 7 18071809. [ Links ]
LIU L, LINA Z, ZHENG T, LIN L, ZHENGA C, LIN Z, WANG S and WANG Z (2009) Fermentation optimization and characterization of the laccase from Pleurotus ostreatus strain 10969. Enzyme Microb. Technol. 44 426-433. [ Links ]
NIGAM P, BANAT IM, SINGH D and MARCHANT R (1996) Microbial process for the decolorization of textile effluent containing azo, diazo and reactive dyes. ProcessBiochem. 31 435-442. [ Links ]
SANDHAYA S, PADMAVATHY S, SWAMINATHAN K, SUBRAHMANYAM YV and KAUL SN (2005) Microaerophilic-aerobic sequential batch reactor for treatment of azo dyes containing simulated wastewater. Process Biochem. 40 885-890. [ Links ]
SEN S and DEMIRER GN (2003) Anaerobic treatment of real textile wastewater with a fluidized bed reactor. Water Res. 37 1868-1878. [ Links ]
XUDONG L and RONG J (2008) Decolorization and biosorption for Congo red by system rice hull - Schizophyllum sp. F17 under solid-state condition in a continuous flow packed-bed bioreactor. Bioresour. Technol. 99 6885-6892. [ Links ]
ZHANG C, TONG HR, ZHANG DM and LI HN (2006) Study on optimization of the formula for vegetable protein drink. J. Southwest Agric. Univ.(Natural Sci.) 28 197-200. [ Links ]
ZHOU JZ, LIOU XL, HUANG KH, DONG MS and JIANG HH (2007) Application of the mixture design to design the formulation of pure cultures in Tibetan kefir. Agric. Sci. China. 6 1383-1389. [ Links ]
Received 23 December 2009; accepted in revised form 13 December 2010.
* To whom all correspondence should be addressed. +21 67 346 1000; fax: +21 67 346 1830; e-mail: alym712@yahoo.fr

