


Servicios Personalizados
Articulo
 Inglés (pdf)
 Articulo en XML
 Referencias del artículo
Indicadores

Links relacionados
-
 Citado por Google
 -
 Similares en Google
Compartir

 Permalink
Water SA
versión On-line ISSN 1816-7950
versión impresa ISSN 0378-4738
Water SA vol.36 no.5 Pretoria oct. 2010
COMMENT ON
Winde (2010) Uranium pollution of the Wonderfonteinspruit, 1997-2008: part 1: uranium toxicity, regional background and mining-related sources of uranium pollution: part 2: uranium in water - concentrations, loads and associated risks (Water SA 36 (3) 239-278)
Gunter Wendel
Address: PO Box 420, Stilfontein, 2550, South Africa Tel: +2782 459 4188; e-mail: wendelg@mweb.co.za
The Linear No threshold Theory (LNT)
Winde makes reference to the 'linear non-threshold theory', with reference to Part 1, Fig. 1 (p. 243):
Unfortunately the scales on Fig. 1 are logarithmic. (The 0% on the Y-Axis is an editorial error?) The 'linear' theories normally refer to linear scales. If one plots harm against exposure, the linear no threshold theory (LNT) holds that the line passes through the origin. This implies that every exposure is harmful. The LNT can be applied to many substances. In the case of uranium exposure, there is no evidence that small exposures might be beneficial. Arsenic, by comparison, is an essential trace mineral, and harmful only at high concentrations.
The jury is out on radiation exposure. There is a school of thought, and considerable literature on, the Radiation Hormesis Hypothesis, which posits that small doses of radiation are beneficial. The International Commission on Radiological Protection's recommendations (ICRP 60; 1990, para. 46), acknowledge the Hormesis phenomenon, but this is statistically inconclusive, and data are not sufficient to take into account in radiological protection.
The data are also insufficient to support either the LNT or the Hormesis hypothesis. The LNT is basically a conservative tool for regulating the safety of radiation exposures.
To my knowledge there are no estimates of South African background radiation exposure, but based on worldwide data from sources such as UNSCEAR (1988) the exposure range of 2-5 mSv per annum is probably realistic. Additional doses in the WCA from uranium exposure are in the 1 mSv/a range and fall within the range of natural variation. Humans have evolved with natural background radiation, and this provides the genetic variation on which selection can operate in the evolutionary process.
Misuse of statistics
In Fig. 12 (p. 274) of Part 2, the correlation coefficient in this graph is clearly affected by a single point. Any conclusions drawn from this inference should be rejected.
References
ICRP (INTERNATIONAL COMMISSION ON RADIOLOGICAL PROTECTION)(1990) 1990 Recommendations of the International Commission on Radiological Protection. ICRP Publication 60. Pergamon Press (for the ICRP), Oxford. [ Links ]
UNSCEAR (1988) Sources, Effects and Risks of Ionizing Radiation. United Nations Scientific Committee on the Effects of Atomic Radiation. 1988 Report to the General Assembly of the United Nations. [ Links ]
Response to comments made by Gunter Wendel
Frank Winde
North-West University, School of Environmental Sciences and Development, Private Bag X6001, Potchefstroom, 2520, South Africa Tel: +2718 299 2582; fax: +2718 299 2582; e-mail: frank.winde@nwu.ac.za
Response to comments on 'The Linear No threshold Theory (LNT)'
It is not clear how these comments relate to the paper in question. At no point in the paper was the Linear Non-threshold Theory (LNT) mentioned or discussed.
Figure 1 merely displays graphically the relation between U concentration in domestically used water and the associated number of U-related cancer deaths (expressed as a percentage of the exposed population) as used in the Water Quality Guidelines of the Department of Water Affairs (domestic use). Whether or not this relationship falls into the LNT category is of little, if any, relevance to the argument presented in the article.
Wendel also changes the context in which Fig. 1 is presented, from risks being associated with different U concentrations in water to risks caused by external radioactive radiation. The latter is fundamentally different in its potential health effects and irrelevant to the discussed figure.
Wendel's statement that As is an essential trace mineral, i.e. a necessary ingredient of the human metabolism, needs to be substantiated as the metalloid is most famous for its outstanding toxicity, based on which it has been widely used as an agricultural insecticide and wood preservative. Despite the fact that As traces are used in tonics, chronic exposure to As-contaminated drinking water has been linked to mortality in humans (e.g. http://en.wikipedia.org/wiki/Arsenic , accessed 6.10.2010).
A much better example for an essential trace element would have been Zn, which is also a heavy metal like U but, in contrast to the non-essential U, Zn fulfils a range of important biological functions, including healing of wounds, to such extent that many people suffer from a Zn deficiency, To treat the latter many dietary supplement products such as vitamin and mineral tablets contain zinc underlining the essential character of the heavy metal (e.g. http://en.wikipedia.org/wiki/Zinc , accessed 6.10.2010).
Response to comments on 'Misuse of statistics'
This strong remark of Wendel presumably alludes to the known phenomenon that the correlations of data series can produce highly significant relations (i.e. high correlation coefficients) which, in fact, do not exist and are only caused by a single outlier value.
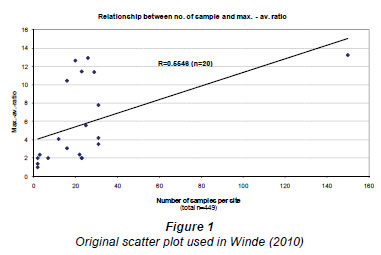
In such cases, graphically displaying the actual relationship between the data series in scatter plots commonly reveals that no linear regression exists. For this very reason the scatter plot was shown in the paper (Fig. 1).
While I admit that indeed, at first glance, it may seem that a single data point dominates the linear regression displayed in the diagram, this is by no means as 'clear' as Wendel asserts.
Figure 2 displays the same scatter plot after this single data point (Sample No. 150; max.-av.-ratio: 13.2) has been removed.

Apart from the persistence of a reasonably linear relationship displayed in Fig. 2, the associated decrease of the correlation coefficient from 0.5546 to 0.4866 can certainly not be regarded as large and still suggests the persistence of the stated linear relationship (in this case between the number of samples and the ratio between the maximum and average uranium concentration found in these samples).
Since the underlying assumption for exploring this relationship in the first place is that the chance of measuring extreme values (in this case maximum U concentrations) in naturally fluctuating systems increases with the number of samples taken, it would defeat the purpose of the correlation to leave out the largest study (150 samples) merely because it is an outlier amongst studies that mostly comprise much fewer samples.
The fact that the inclusion of this large study improves the correlation coefficient does not render the correlation invalid simply because it represents an outlier value, but in fact strengthens the robustness of the finding (even though the correlation itself is still comparatively weak as indicated in the paper).

