


Servicios Personalizados
Articulo
 Inglés (pdf)
 Articulo en XML
 Referencias del artículo
Indicadores

Links relacionados
-
 Citado por Google
 -
 Similares en Google
Compartir

 Permalink
Water SA
versión On-line ISSN 1816-7950
versión impresa ISSN 0378-4738
Water SA vol.36 no.5 Pretoria oct. 2010
The defouling of membranes using polymer beads containing magnetic micro particles
David McLachlan*
UNESCO Associated Centre for Macromolecules and Materials, Department of Chemistry and Polymer Science, University of Stellenbosch, Private Bag X1, Matieland 7602, South Africa
ABSTRACT
Polymer membranes provide a good method of obtaining potable water but, as membranes always foul during water purification, the flux drops with time. Methods of physical cleaning of the polymer membranes, which do not require the plant to be shut down for lengthy periods, are very attractive and also do not generate any waste fluids. This paper reports on an investigation into the possibility of obtaining flux enhancement during the filtration process, as well as the cleaning of membranes, using magnetic polymer beads moving under the influence of an AC magnetic field. Methods, procedures and results for cleaning membranes using magnetic beads, at zero trans-membrane pressure, are described.
Keywords: membrane cleaning, magnetic particles
Introduction
Membrane filtration of aqueous effluents is a technique widely used in water purification in the food industry, to clean industrial effluents prior to discharge or reuse and to obtain potable water from various sources (Porter, 1990). The fouling of membrane filters during the filtration process of all aqueous effluents is a well known phenomenon. Fouling of the membranes causes a decrease in permeate flux and eventually the filtration process becomes so inefficient that a cleaning procedure must be initiated.
The fouling of the membranes is characterised by a rapid initial decrease of flux followed by a medium or slow decrease in the permeate flux (Song, 2000; Czekaj et al., 2001). It is mainly the sub-micron proteins and polyphenols, i.e. particles smaller than the membrane pores, which are considered to be the cause of the initial rapid membrane fouling (Czekaj et al., 2001). After this the flux decreases due to the formation of a caking layer. When necessary, in order to restore permeate flux, the filtration process has to be interrupted to clean or replace the membrane filters. For economic reasons, a membrane cleaning procedure which does not seriously interrupt the process, or use chemicals which are hard to dispose of, is preferable. Cleaning by the use of scouring polymer-coated magnetic beads, which can be rotated and manipulated by magnetic fields, offers both of the above advantages.
There is no previous work of this nature to review. However an internet literature search found numerous references to magnetic beads used in drug delivery, magnetic beads carrying water purification chemicals and, more controversially, to the ability of magnetic fields (AC and DC) to prevent fouling in reverse osmosis (RO) systems. Therefore, this review will be limited to a brief mention of the other physical methods for cleaning membranes..
A number of 'physical' membrane cleaning techniques have already been investigated, which include back flushing, cross flushing, and back pulsing (or back shocking) (Redkar and Davis, 1995; Wetten, 1995; Parnam and Davis, 1996; Kuberkar et al., 1998; Redkar et al., 1996; Tanaka et al., 1995; Kuruzonovich and Piergiovanni, 1996). Although these techniques, applied in a non-continuous way, could be successfully used to clean membranes and partially or completely restore the original flux, they seem to be inefficient in the removal of some adhesive foulants (Czekaj et al., 2000). Czekaj et al.(2000; 2001) found rapid continuous back pulsing from the permeate space into the feed space to be very effective in maintaining an enhanced equilibrium flux. For instance, Czekaj et al. (2000; 2001) used infrasonic back pulsing at frequencies of 5-10 Hz and achieved, with standard cross-flow filtration, continuous permeate fluxes which were 3 to 4 times greater than those for fully fouled membranes.
This paper concentrates on the cleaning of membranes at zero TMPA. A more detailed account of this work, and a description of the largely unsuccessful attempts to obtain flux enhancement by continually passing the beads over the membrane, are given in McLachlan et al. (2009).
The experimental systems
Magnetic materials used in the beads
It is known that strong permanent magnetic particles would give stronger torques in a uniform field and larger forces in an inhomogeneous field than soft magnetic particles. Therefore magnetically hard hematite was used to make permanentmagnet polymer beads. No established method for producing nano-hematite was found in the literature but, if small enough, hematite particles will become super-paramagnetic. However, experiments using hematite powder (approx. 10 μm in diameter) showed that it retained a more than adequate permanent moment. Therefore, the beads and particles produced and tested in this report all contain hematite powder (which is mined in South Africa). Other possible fine permanent magnetic particles were investigated but found to be not suitable or too expensive for practical use (McLachlan, 2009).
Preparation of magnetic beads and particles
Commercial hematite powder was successfully compounded, with and without surface coatings, into polyethylene, by Dr. Breeksting from Tshwane University of Technology. The volume percentages of hematite powder needed to give beads which rotated in a magnetic field, but did not clump together in a magnetic field, was determined experimentally using 3 mm epoxy beads into which hematite had been embedded, and these became the target volume fractions. The volume percentage for the 2 extruded hematite/polyethylene materials was 8.15 and 8.16%. As the compounded materials were almost spongy, due to having been quenched into water, sheets of the materials (about 0.1 mm thick) were prepared in a hot press. These sheets were cut into small sections, which were then reduced in size by cryogenic milling and separated into 38-75, 75-150 and 150-218 μm batches of granular particles. It was then attempted, without success, to make these irregularly shaped particles more spherical. As this was not successful, and it was felt that the sharp edges may damage the membranes, only a limited number of experiments were done using these magnetic particles.
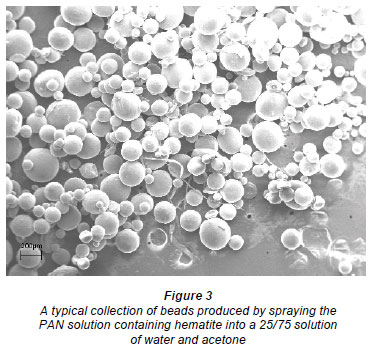
The most successful method of bead preparation was to encapsulate the SA hematite into poly acryl nitrile (PAN) beads. All experimental results reported here were obtained using PAN beads, for which a spraying procedure was developed to create magnetic microspheres from a dissolved polymer solution. The actual method used was to spray a PAN-dimethyl formamide solution, in which the correct amount of hematite was suspended, into a bath of a non-solvent liquid phase. This solution was placed in a glass tube with a fine (± 2 mm) point, with a ±1 mm orifice at the bottom. This tube was surrounded by another annular glass tube, which also had a reduced diameter at the bottom, to match the tip of theinterior tube. Nitrogen flowed in the annular space between the 2 tubes. A fine spray was created by the fast-flowing stream of nitrogen over the point where the solution exited the inner tube. (The shape of the tip, combined with the fast flowing stream of nitrogen over it, produced an aerosol effect.) The small droplets that formed were allowed enough 'falling' time from the tip, before they fell into the bath containing a non-solvent phase, for the surface tension to cause the formation of spherical droplets. The time needed for this sphere formation necessitated the tip of the spraying device to be 1 m above the surface of the non-solvent phase, which was usually a 75% acetone:25% water mixture.
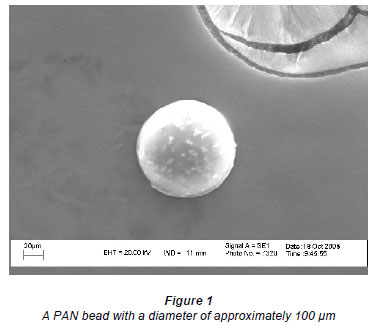
Beads, with diameters ranging from 15 μm up to 600 μm, were produced. Wet sieving was used to separate out the various fractions. Most of the beads were between 100 |m and 300 |m in size. In the initial experiments the size range used was 50 to 100 μms, as very fine beads could more easily be passed through membrane elements. Unfortunately only a small fraction of the product lay in this range. In later experiments the size range used was 100 to 180 μm, as the proof of concept using flat test cells was more important at this stage than the necessity for the beads to pass through the spiral wrap membrane element feed space cloth.
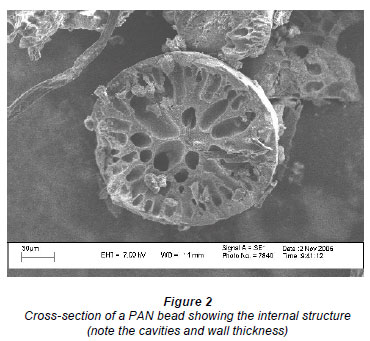
Scanning electron micrographs (SEM) (Fig. 1) showed the beads to be almost perfectly round. Cross-sections of the beads (Fig. 2) showed the beads to be inhomogeneous and to contain a large fraction of water. Figure 3 shows a collection of beads produced by this process.
After preparation, the beads had to be poled in a high magnetic field, in order to induce a permanent magnetic moment. A M-H loop of some of the beads was made, using a vibrating sample magnetometer (by Professor Doyle of the University of KwaZulu-Natal); this showed that the field (4 000 G) available from our permanent magnet was insufficient to fully magnetise the hematite. Therefore the beads and particles were poled in an electromagnet, giving in excess of 8 000 G, at the Physics Department of the University of Cape Town. The remnant magnetisation in the hematite after this was 2.5 x 10⁵A·m-1. Poled hematite loaded beads could be easily activated by the magnetic fields described in the next section.
The magnetic field configurations
Initially the AC magnetic fields were provided by a pair of Helmholz coils, which gave 57 G·A-1. The maximum continuous current was found to be 3 A (170 G), but 5 A (285 G) could be used for short periods. (In preliminary tests on a flat sheet in air and in water, all the magnetic spheres and particles started to move in a root mean squared (RMS) AC field of less than 57 G.)
In order to increase the AC magnetic field and to create a downward inhomogeneous field (to create a force on the particles) 'transformer' cores were used.
The E core field magnet: A transformer coil consists of an E and an I section which, when placed together (EI), provide a closed magnetic circuit. A single winding was wound around the central section of the E piece, which had a cross section of 55 mm x 45 mm, and the centre of the membrane was placed directly 11 mm above this section. For a current of 1 A, the field at the centre of the membrane was found to be close to 80 G and to drop to 60 G at the corners. The vertical gradient at the centre was found to be 0.75 G·mm-1 or 0.75 T·m-1. Most of the experiments done in this project used this E field magnetic configuration.
The rotating magnet: The calculations given below show that there is a possibility that the beads were flipping (i. e. changing direction or spinning in a very small fraction of the period of the AC field after the field was reversed) and therefore not able to effectively clean the membrane, using the E field magnet described above. In order to overcome this, a rotating field system was constructed. This consisted of 2 pairs of strong permanent magnets mounted at the tips of an aluminium 'U' shaped frame. The field at the centre was found to be just over 500 G. The 'U' was rotated by a variable speed stirrer motor and the revolutions per minute were measured, using an adapted bicycle speedometer. The highest rotational speed used was 126 r-min-1, as above this value the apparatus became unstable. The inputs and outputs of the cell (described below) were adapted so that all the tubes entered and exited through the upper section of the flat cell and the open section of the 'U'. This enabled the cell to be placed horizontally on the axis of the 'U' and for the beads to be rotated about the central axis of the U, being locked onto the rotating B field, so that there was no spinning. The field provided by this system was in effect an AC one. Note that the 500 G field is fairly uniform so no downward force was exerted on the beads. In all the other field configurations used the magnetic field was always perpendicular to the membrane.
Calculations of the torques and forces exerted on the beads
As it was not possible to measure quantities such as the torque exerted on the beads and the resulting angular acceleration, as well as the magnitude of the downward force, these are calculated below. The calculations will be made for a 200 |m spherical bead, which is a bit larger than the ideal size, but the radius of 100 |m, can easily be scaled. All calculations are in SI units.
Density of bead (20 mass % hematite)
2000 kg·m-3.
Volume (V) of bead (5 volume % hematite)
Mass of bead
Saturation magnetization of hematite
Remnant magnetization of hematite
Remnant magnetization (MR) of above bead = 12.5 x 10³A·m-1
Magnetic moment (MRV) = 5 x 10⁻⁸A·m2
Force on a dipole particle in a magnetic field: F = μ( MrV) δB/δL N
For an inhomogeneous field of 1 G·mm-1 (δB/δL)(or 10-1 T·m-1): F
Acceleration (F/M)
(a
Torque on bead τ = MRVB
Moment of inertia of bead I = 2Mr2/5
Angular acceleration of bead τ/I
After 0.01 s angular velocity ω
Speed on surface = ωr
Conclusions
These calculations show that that the magnetic fields exert a more than adequate torque to rotate the magnetic particles on the membrane. The above calculations also indicate that, with most of the fields used in this report, the beads were probably spun through 180º very shortly after the applied field changed sign (i.e. in a fraction of a quarter cycle), and remained aligned with the new direction of the magnetic field for the rest of the half cycle, after which the bead again spun through 180º. The calculations also show that the inhomogeneous fields used in these experiments provided a significant downward force on the particles. In most instances this force was greater than that provided by gravity.
The flat cells used in the project
A rectangular, flat-bed micro filtration module of 100 mm length, 32 mm width and 38 mm ( two 19 mm plates) height, was used in all the flat-cell experiments. The modules were made of polymethyl methylacrylate (perspex) for the low pressure experiments and polycarbonate for the RO studies. Each consisted of 2 plates (each 19 mm thick, 200 mm long and 94 mm wide). The feed space cavity in the top plate (2 mm deep, 88 mm long and 30 mm wide) had three 2 mm inlet pipes at each end which, through separate manifolds, were connected to the input and output feed lines. The membrane rested on a sintered brass plate, set in the lower perspex plate, and below this was another cavity, 13 mm deep, 88 mm long and 30 mm wide, to collect the permeate. The effective membrane area was 0.0032 m2 (100 mm x 32 mm), which was the area of the brass sintered plate. The membrane was placed on the sintered plate and the 2 halves were clamped together by a system of 12 nuts and bolts and sealed with an O-ring.
The low pressure flat cell filtration plant
A schematic diagram of the plant used is given in Fig. 4. Either the clean RO water or the fouling solution (for the alumina powders, the reservoir was placed on a magnetic stirrer) was used to feed to the pump by the appropriate choice of valves (V1 or V2). The flow rate and applied pressure were controlled by the bypass (V3) and exit valve (V4) from the pump, in conjunction with the cell exit valve (V9). The feed entered the cell through V5. The TMP in the cell, which was largely determined by V9, was read on a pressure meter. The permeate flowed into a beaker on an electronic balance and the mass was measured and recorded, as a function of time, by a computer connected to the balance. Valves 5 to 8 were used to introduce beads for cleaning at zero TMP, as will be described below. Valve 7 was used to introduce the beads when it was attempted to use a continuous flow of beads over the membranes to obtain cleaning at non-zero TMPs (McLachlan et al., 2009) and V6 was a seldom-used bypass valve.
The RO flat cell filtration plant
An existing RO plant was modified to carry out this project. The layout of this plant was very similar to the layout given in Fig. 4, but the piping was all made from stainless steel, rated at over 5 000 kPa. The pump used could give a maximum pressure of 5 000 kPa and also had an excessively high flow rate. Therefore, the pressure and flow rate were controlled using Valves 3 and 9 (see Fig. 4). To readily access the cell inside the available magnetic fields, it was decided to link the high pressure stainless steel part of the plant to the cell using 1 000 kPa flexible pipes and very convenient snap-in connections. Therefore this system limited the testing to low pressure membranes, designed for brackish water. In this plant the pressure was measured at the input of the cell and the flow rate after the throttling valve (V9). When running the plant, it was found that the feed pressure tended to oscillate. Therefore, to dampen this oscillation, an 800 kPa ballast tank was installed. The presence of the ballast tank meant that it took up to 20 min to adjust the feed flow and pressure to the desired values. The beads used to clean at zero TMP were introduced into the polycarbonate cell through V8. Unfortunately, due to the high pressures, a simple continuous flow system was not practical and the one-shot system meant that there was limited time to see the effect of the beads on the fouling of the RO membrane.
The membranes and foulants used in the cleaning of foulant layers
Membranes:
• PALL Biodyne 0.20 μm pore size nylon membranes (Pall Corporation)
• PALL Biodyne 0.45 μm pore size nylon membranes (Pall Corporation)
• Polysulphone membranes (PSM) made in the laboratory
The surface pore size of the polysulphone membrane was examined with a SEM microscope and the pore sizes were found to be much less than a micron. Also, as its clean water flux lay between that of the above 2 nylon membranes, the polysulphone membrane is obviously also a micro membrane.
Foulants:
• Dextrin (0.5 g·l-1). (Sigma Aldrich CAS# 9004-53-9) Note that the concentration of 0.5 g·l-1 used for the dextrin solution was the same as that used in concurrent experiments on cleaning a spiral wrap polysulphone element using backpulsing. The dextrin, which was produced from cornstarch, had a wide range of molecular weights.
• Alumina powder (1 g·l-1) with a mean diameter of 1.0 μm and a small size spread
The membranes and foulants used in the cleaning of RO membranes
The membranes used in this work were cut from a small commercial low pressure brack water RO element. This was a FILMTEC RO Element XLE-2521, designed to operate at 690 kPa, with a maximum salt concentration of 500 mg·kg-1.
As the feasibility of this cleaning method had to be established fairly quickly, initial trials were done using a rapid fouling solution (RFS), as used by Lisitsin et al. (2005). When using this foulant solution, the pH and temperature were important and so had to be kept within the bounds for rapid fouling specified by Lisitsin et al. (2005). The standard RFS was made up using 22 g CaCl2, 1 g MnSO4 and 14 g NaHCO3 in 100  of RO water.
Procedures for low pressure fouling layer and RO filtration cleaning experiments
The procedures used at finite TMP
As the experimental results were very unsatisfactory and no significant improvement was observed, please refer to McLachlan et al (2009) for a description of the modifications to the plant and the procedures used to obtain a continual flow of beads, at finite TMPs.
The procedure used for the cleaning of fouling layers at zero TMP
This procedure or routine was used in all the experiments on cleaning and was performed at zero TMP. The experiments themselves are reported on in the 'Results' section.
To introduce the beads for zero TMP experiments, a large syringe was used to inject a suspension of beads into the cell cavity, through an aperture (V8 in Fig. 4) in the top plate, directly into the feed space. The water (and beads) contained in the large syringe flushed the feed space during the introduction of the beads. The beads were kept from moving off the membrane by a sieve that was inserted to cover the exit pipes. As the feed side valves (V5, V6 & V7 in Fig. 4) were closed during this procedure, virtually no beads moved towards the feed pipes. After this the beads could be spread using a small permanent magnet until a fairly uniform layer of dispersed beads fully covered the active area of the membrane and also filled the feed space. At this stage, the feed space (2 mm deep, 88 mm long and 30 mm wide) was estimated to contain about 2.5 m of beads (comprising 50%, by volume, of the feed space). With a density this high, the motion of the beads in the confined space, and the continuous collision of the beads with each other and the walls of the cell, meant that some of the spinning beads were always in contact with the fouled membrane. After cleaning, the beads were flushed off the membrane, using a RO-containing syringe, via the entry port, which was not covered by a sieve. The 'best' procedure/sequence, described below, was the result of many trials and variations, which are therefore not reported on in this paper.
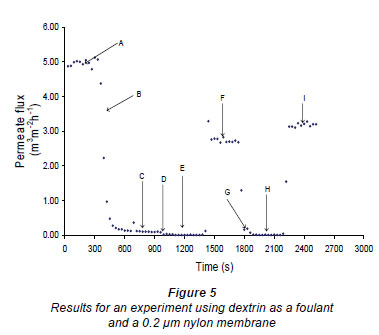
The plant filtration system was operated as follows (a typical flux-time plot, Fig. 5, illustrates this procedure). First the membrane was mounted in the cell and the cell connected to the system. The clean water value was then measured for 5 min using RO water at 50 kPa (A in Fig. 5). The retentate flow rate was found to be about 70 m·min-1 (i.e. at the bottom end of the membrane) and about 70 m·min-1, plus the permeate flow, at the top (input end) of the membrane. The cross-flow velocity at the exit end of the membrane was about 0.0233 m·s-1. The feed to the pump was then changed to the fouling solution/suspension and the membrane was fouled (B) until the permeate flow rate was less that 10% of the clean water value, or for 5 mi, whichever occurred first. Reverse-osmosis water was then passed over the membrane for 5 to 10 min to remove any loose foulant from the system (C). After this period the pump was switched off and the valve in the feed line was closed. The beads were introduced (D) into the cell, at zero feed pressure, using a syringe, through the entry port into the feed space of the cell. The excess water flowed out through the retentate ports, which were covered by a fine sieve. After the surface of the membrane had been covered with beads the entry port was closed and the bead density on the surface of the membrane was made more uniform using a small permanent magnet. The E field electromagnet (or in some cases the rotating magnet) was then re-activated (E) for 5 min. This was the period during which the cleaning took place. After 5 min the electromagnet (or rotating magnet) was deactivated and the beads were withdrawn from the system using the syringe. This also resulted in all or most of the foulant that had been cleaned off by the beads being removed from the feed cavity. Reverse-osmosis water at 50 kPa was then reintroduced (F) for 5 min to measure the new RO flow rate. After this period beads were again introduced (G), using the same procedure as before, and the magnetic field reactivated for 5 min to further clean the membrane. After this 5 min period, the field was again turned off (H) and the beads and any foulant in suspension were removed. Finally, the flow was again measured using RO water (I) for 5 more minutes.
It must be emphasized that it was no trivial exercise to introduce the beads onto the membrane, so that they covered the membrane completely and contained no air pockets. Repeatability is further hindered by the distribution of the beads which changed as a result of the AC magnetic fields. This gave rise to what was initially a reasonably uniformlycovered membrane, having more- and less-densely covered regions during the cleaning cycle.
A computer was connected to an electronic scale, upon which a beaker was placed to collect the permeate, and logged the mass registered on the scale every 30, 60 or 120 s. The permeate flow and then the flux were calculated from these results and plotted as a function of time to create the figures given in this report.
The procedure used for the RO cleaning experiments at zero TMP
As these tests involved introducing the beads onto the active area of the membrane, after it had been fouled, a port (V8 in Fig. 4) was placed in the top plate of the cell, over the input side of the active membrane area (sintered bronze support area). For these tests, sufficient beads were then introduced through this port, using a modified syringe, to cover the active area of the membrane. In order to confine the beads to this area, a vertical sieve (made of fine-mesh stainless steel and anchored to the polycarbonate top of the feed space) was placed at the exit of the flat cell.
The procedure was to first measure the clean water or RO flow rate. A RFS (Lisitsin et al., 2005) concentrate was then rapidly added to the feed tank which was continually being stirred. After this the fouling was monitored until no further drop in the permeate flow rate was observed. To add the beads after fouling the pump was stopped, and the water in the feed tank replaced with pure RO water. The system was then briefly flushed with RO water at a low pressure. With the pump off the beads were then added as described above, after which the magnetic field was switched on, with the desired amplitude and for the selected period. Note that the cleaning of the membrane was done at zero TMP. The beads were then withdrawn using the same syringe through port V8. This port was then closed, the pump started and a new RO flow rate measured.
Results and discussion
Cleaning of the membranes at finite TMP
Considerable effort (McLachlan et al., 2009) was put into modifying the systems so that a continual flow of beads could pass over the membrane, together with the fouling solution, resulting in a continual flux enhancement. At best during continual flow the beads coved 5% of the membrane surface. At relatively low TMPs the beads were observed to remove the surface layer, but not to improve the flux. Subsequent SEM examination showed the foulant to still be present close to and in the pores of the membranes. Therefore it had to be concluded that the flow into the pores was providing a binding force for the foulant. At higher TMPs it was found that some of the beads became embedded in the surface layer.
Cleaning of the membranes at zero TMP
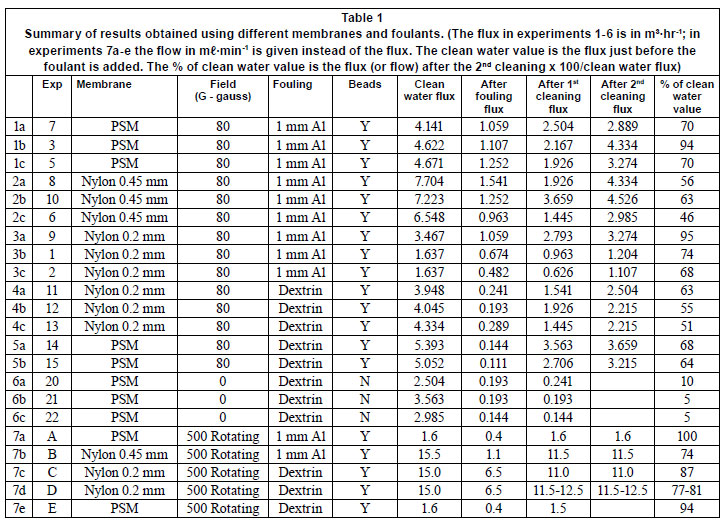
The foulant/membrane combinations for all the experiments performed are listed in Table 1 and some of the results are given in Figs. 5 to 8. Table 1 presents a summary of the results obtained in this paper. The units of all fluxs are m3m-2h-1. The last column is obtained by dividing Column 9 by Column 6 and multiplying by 100. The experimental results reported are for those using the E field magnet (1a to 5b in Table 1) and the rotating magnet (7a to 7e). Note that during the cleaning period the foulant was mixed back into the water in the feed space, but most of this was washed out, using a syringe, before the TMP was reapplied. The results given are for the E magnet, where the field at the centre of the membrane was 80 G, experiments were all repeated 3 times (see Table 1). (Note that the E magnet was used when attempting to clean membranes with flowing beads and a positive TMP.) A few results using the rotating magnetic field are also given in Table 1.
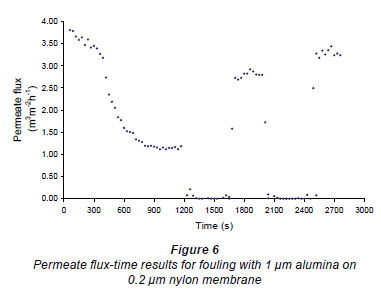
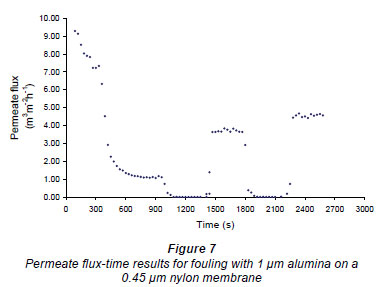
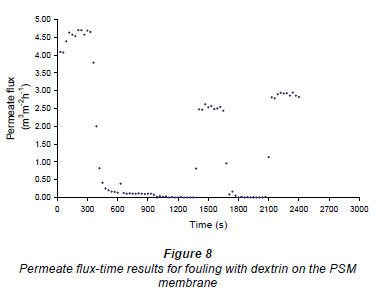
Figures 6 and 7 show fouling curves for alumina, which was a fine, chemically inert, particulate foulant, using both the nylon membranes and the polysulphone membranes (PSM) discussed above. The decline in the permeate flow rate during initial clean-water periods for the nylon membranes was attributed to conditioning of the membrane. Figure 8 shows fouling curves for dextrin, which is a far more 'sticky' foulant than alumina, using the PSM, which has smaller pores and is more suitable for dextrin. Table 1 summarises the results. From Table 1 it can be seen that the results were not very reproducible, especially when using the 2 nylon filters.
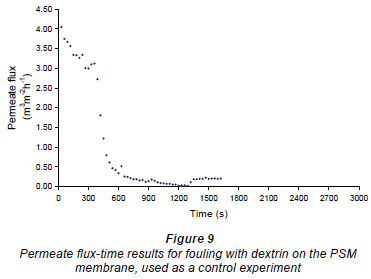
A control experiment (see Fig. 9) was carried out to see if flushing RO water in and out of the cell had a cleaning effect. In this experiment the membrane was first fouled, after which RO water was added to the cell above the membrane, where it was left for 5 min at zero TMP. The water was then removed, as in the previous experiments. After this, RO water, at 100 kPa, was passed over the membrane and the flow rate re-measured. The results for this experiment are shown in Fig. 9, where it can be seen that no improvement in the RO flux was observed, so introducing and removing the RO water had no cleaning effect. It should also be noted that, unlike observations in the previous cases presented in this section, no foulant was seen in the water flushed from the system, indicating that the fouling layer was still intact.
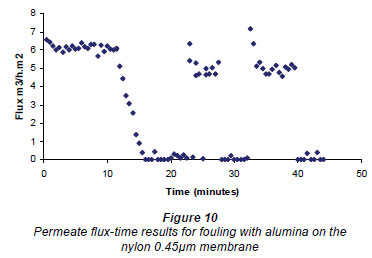
An example of the results obtained when cleaning the membrane, using the rotating magnetic system, is given in Fig. 10. The results for all these experiments are given at the bottom of Table 1. The flux values for the nylon membranes showed a preliminary spike after cleaning. It would appear that the cleaning obtained using the rotating field was better than for the fields obtained using the E field magnet, but as a rotating field (as used in these experiments) is very difficult to implement around a membrane element, a large amount of experimental data was not acquired.
All the results showed an increase in the flux or flow rate after an initial bead cleaning treatment and sometimes an additional improvement in the permeate flux or flow rate after a secondary treatment. From the experiments reported here, it can be seen that the permeate flow rate can be significantly improved by the cleaning action of the PAN beads, at zero pressure, either in the alternating field of the E magnet or the rotating field. However, an examination of Table 1 shows that the rotating field is probably more efficient.
Cleaning RO membranes at zero TMP
Bearing in mind the fact that magnetic beads had been found to effectively clean the fouling layer only when the TMP was close to zero, it was decided as a first step to see if the beads could remove a scaling layer at zero TMP, so as to give an improved permeate flow. This necessitated the introduction of a large number of beads onto a scaled membrane and setting them in motion for the required time, at a frequency of 10 Hz using the E field magnet. The cleaning of the membranes and all subsequent measurements were done using RO water. Only results for membranes cleaned at zero TMP, using this procedure, are given in this report. In all these experiments the membranes are cleaned twice after which 500 mg·kg-1 salt water solution was reintroduced and the permeate flux logged for a further period.
Figure 11 gives a plot of the permeate flux versus time and shows the initial conditioning of the membrane for 3 h and then the change in flux when a 2 x RFS fouling solution was introduced for 1 h. After this the figure records where the first cleaning (zero flux) was made between 454 and 5 h. The subsequent measurement of the RO flux was done between 5 and 6% h. Figure 11 then shows a repetition of the cleaning procedure for 15 min and the subsequent RO flux measurement from 64 to 7 h . Finally the figure records the effect of introducing a 500 mg·kg-1salt solution at 7 h. The RMS field for all these experiments was 80 G from the E field magnet. From this figure one observes that the cleaning procedure actually decreased the flux.
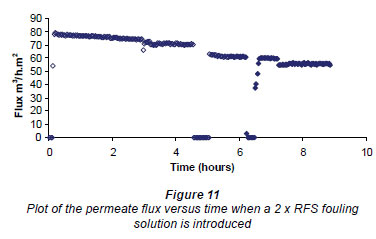
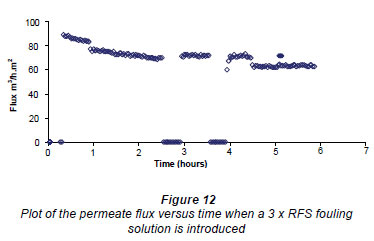
Figure 12 shows the initial conditioning of the membrane for 1 h and then the change in flux when a 3 x RFS fouling solution was introduced between 1 and 3 h, After this the figure records where the first cleaning (zero flux) was made for 30 min and the subsequent measurement of the RO flux. The figure then shows a repetition of the 30 min cleaning procedure after 4 h and subsequent RO flux measurement. Finally the figure records the effect of introducing a 500 mg·kg-1salt solution after 5 h. Note that the drop in the flux upon adding the 3 x RFS foulant was considerably larger than in the case where 2 x RFS concentration was used. This figure shows that the cleaning procedure improved the flux slightly after the first clean but that it returned to the first fouled value (3 h value) after the second clean.
The above results were obtained using a AC field of 80 G. The results (not shown) obtained when using a 3 x RFS concentration and RMS fields of 48 and 24 G in the E field magnet were very similar to those shown in Fig. 14. This indicates that the slight improvement of the flux after the first fouling is nearly constant between 24 and 80 G.
In order to try to understand what is happening, the images obtained from a series of SEM micrographs are presented and discussed.
Figures 13a-e all show images at a magnification of 50 x. Figure 13a is an image of a conditioned membrane, Fig. 13b is after 2 x RFS fouling and Fig. 13c is after cleaning the fouled membrane. Note that these images are all very similar and it has to be assumed that 2 x RFS fouling is mainly in the nanopores. Figure 13d shows that a cloud-like pattern of light on dark areas was obtained after 3 x RFS fouling and Fig. 13e shows the light cloud-like areas to have gone after cleaning. It would appear that the 'clouds' indicated a thicker flakier fouling layer, which could be partially cleaned by the beads.
Figure 14a is an image of a conditioned membrane and Figs. 14b and 14c were taken from a 2 x RFS fouled and cleaned membrane, respectively.
There may just be a discernable difference between these 3 images but it must be concluded that 2 x RFS fouling did not produce a fouling/ scaling layer which could clearly be seen using even high magnification for the SEM micrographs.
Figure 14d shows an enlargement of a light cloudlike area in Fig. 13d, which clearly shows a heavy scaling layer. Figure 14e is an enlargement made from a dark area in Fig. 13d and shows that less fouling had occurred here than was observed in Figs. 13d and 14e.
Figures 14f and 14g show images as seen at 500 x magnification, after a 3 x RFS fouling and bead cleaning. Figures 14f and 14g are from the more heavily- and more lightly-scaled areas, respectively. The remnant scaling is seen to be somewhat heavier in Fig. 14f than in Fig. 14g and both are similar to what is observed for Figs. 14b and 14c. Note that no thick fouling layers, as seen in Fig. 14d, were observed on any of the cleaned membranes.
These images (Figs. 14d to 14g) allow the conclusion to be made that the beads are capable of cleaning off heavy, probably flake-like, scaling layers but do not remove the finer scaling layers/particles, which are more firmly bonded to the membrane and embedded in the membrane pores.
From the above, it must be concluded that the cleaning of fouled RO membranes with magnetic beads is not practical, as only the flux through heavily-fouled membranes can be somewhat improved.
Conclusions
This research has shown that beads, suitable for cleaning in conjunction with an AC magnetic field, can be made by blending hematite into polyethylene and poly acryl nitryl (PAN).
However, as the polyethylene beads are not spherical, all the reported work was done with PAN beads. As the experiments all showed that cleaning could only be done at zero TMP, it had to be concluded that beads could not continuously keep membranes from fouling and that the plant would have to be shut down in order to have the beads clean the membrane. From the flux-time curves it was concluded that the magnetic beads could only partially clean the membranes and that material in the pores and firmly bonded to the surface could not be removed.
The report also concludes that chemical-free cleaning of a filtration element at zero TMP, using beads, is possible but not practical in a spiral wrap membrane. One reason is that the feed space (which includes a spacer cloth) would have to be reasonably well filled with beads for the cleaning process to work and that after the cleaning the beads would have to be removed.
Unfortunately no enhanced flux is observed for a lightlyfouled RO membrane. Experiments also showed that an enhanced flux for a badly-fouled RO membrane cleaned by rotating beads was obtainable but that the resulting flux was similar to that obtained for a lightly-fouled membrane. This, plus the SEM images, allows one to conclude that while the beads are able to remove thick flaky layers, they are incapable of removing the initial scaling layers, part of which lies in the pores and is therefore inaccessible to the cleaning action of the beads.
In future experiments it may be worthwhile examining the use of magnetic beads in the partial cleaning of capillary membranes and elements. The beads are recoverable in a magnetic trap and the cleaning method does not use any chemicals. The beads would also be more closely confined on all sides by the membrane material and would therefore strike the membrane more often. Note that the size of the beads available determines the inner diameter of the capillaries that can be used as the beads must be able to be flushed in and out of the system without clogging. First experiments could use larger beads and capillaries to establish proof of concept. With the confined geometry in a capillary, it may even be possible to keep the membrane partially clean while passing the beads continually over it, with a low TMP.
Due to the porous nature of the PAL beads they could be impregnated with reagents or even drugs. The beads could then be manipulated magnetically to where they are needed. Experiments have been made to see if such chemically impregnated beads can be used to reduce fouling and as a boron-selective resin (Bryjak et al., 2009). (Note that Boron fouling causes problems in some RO plants).
References
BRYJAK M, WOLSKA J, DURAJ D and McLACHLAN D (2009) Polymer-hematite microspheres in pressure driven membrane processes. Unpublished report; can be obtained from Professor Marek Bryjak, Wroclaw University of Technology, 50-370, Wroclaw, Poland. [ Links ]
CZEKAJ P, LOPEZ F and GUELL C (2000) Membrane fouling during microfiltration of fermented beverages. J. Membrane Sci. 166 199-212. [ Links ]
CZEKAJ P, LOPEZ F and GUELL C (2001) Membrane fouling by turbidity constituents of beer and wine: characterization and prevention by means of infrasonic pulsing. J. Food Eng. 49 25-36. [ Links ]
KUBERKAR V, CZEKAJ P and DAVIS RH (1998) Flux enhancement for membrane filtration of bacterial suspensions using high frequency backpulsing. Biotechnol. Bioeng. 60 77-87. [ Links ]
KURUZONOVICH JN and PIERGIOVANNI PR (1996) Yeast cell microfiltration: optimization of backwashing for delicate membranes. J. Membr. Sci. 112 241-247. [ Links ]
LISITSIN D, YANG Q, HASSON D and SEMIT R (2005) Inhibition of CaCo3 scaling on RO membranes by trace amounts of zinc ions. Desalination 183 289-300. [ Links ]
McLACHLAN DS, BESTER F, SAUTI G, ELTHABET W, DU TOIT X, BASSON N, HAMANN A and CLOETE L (2009) The defouling of membranes using polymer beads containing magnetic micro particles. WRC Report No. 1592/1/09/ Water Research Commission, Pretoria, South Africa. [ Links ]
PARNAM CS and DAVIS RH (1996) Protein recovery from bacterial cell debris using crossflow microfiltration with backpulsing. J. Membr. Sci. 118 259-268. [ Links ]
PORTER MC (1990) Handbook of Industrial Membrane Technology. Noyes Publications, Westwood, USA. [ Links ]
REDKAR SG and DAVIS RH (1995) Crossflow microfiltration with high-frequency reverse filtration. AI Chem. Eng. J. 41 501-508. [ Links ]
REDKAR SG, KUBEKAR V and DAVIS RH (1996) Modeling of concentration polarization and depolarization with high-frequency backpulsing. J. Membr. Sci. 121 229-242. [ Links ]
SONG L (1998) Flux decline in crossflow microfiltration and ultrafiltration: mechanisms and modelling of membrane fouling. J. Membr. Sci. 139 183-200. [ Links ]
TANAKA T, ITOH H, NAKANISHI K, KUME T and MATSUMA R (1995) Crossflow filtration of baker's yeast with periodical stopping for permeation flow and bubbling. Biotechnol. Bioeng. 46 401-404. [ Links ]
WENTEN IG (1995) Mechanisms and control of fouling in crossflow microfiltration. Filtr. Sep. 32 (3) 252-253. [ Links ]
Received 21 January 2010; accepted in revised form 12 October 2010.
* To whom all correspondence should be addressed. +27 (21) 808 3905; fax: +27 (21) 808 4967; e-mail: davidsm@sun.ac.za

