


Servicios Personalizados
Articulo
 Inglés (pdf)
 Articulo en XML
 Referencias del artículo
Indicadores

Links relacionados
-
 Citado por Google
 -
 Similares en Google
Compartir

 Permalink
Water SA
versión On-line ISSN 1816-7950
versión impresa ISSN 0378-4738
Water SA vol.36 no.5 Pretoria oct. 2010
Multi-criteria decision making for water resource management: a case study of the Gediz River basin, Turkey
Baris YilmazI,*; Nilgun B HarmanciogluII
ICelal Bayar University, Golmarmara Vocational School, 45410, Turgutlu, Manisa, Turkey
IIDokuz Eylul University, Department of Civil Engineering, 35160, Buca, Izmir, Turkey
ABSTRACT
In this study, a water resource management model that facilitates indicator-based decisions, with respect to environmental, social and economic dimensions in a multiple criteria perspective, is developed for the Gediz River Basin in Turkey. The basic input of the proposed model is the quantity of surface water that is mainly allocated to irrigation purposes. The model has been applied under 3 different hydro-meteorological scenarios that reflect baseline as well as better and worse conditions of water supply and demand, not only to reach a comprehensive assessment of the water budget in the Gediz Basin, but also to evaluate the impacts of proposed management alternatives under different conditions. The Water Evaluation and Planning (WEAP) software is used as a simulation and evaluation tool to assess the performance of possible management alternatives; performance is measured by 9 indicators representing economic, social and environmental sustainability. The study has delineated the best management alternative on the basis of 3 different multi-criteria decision making (MCDM) methods, including simple additive weighting (SAW), compromise programming (CP) and technique for order preference by similarity to ideal solution (TOPSIS). Each method is also applied with 7 different sets of criteria weights that represent objective judgements as well as subjective preferences of decision makers. The results of the study indicate that the decision on the best alternative is basically independent of the MCDM method used, but slightly sensitive to the weights assigned to the criteria as well as the data used in the analyses.
Keywords: MCDM, water resource management, WEAP, Gediz River Basin
Introduction
As freshwater resources are declining in quantity and deteriorating in quality, water resource management is of greater importance than ever before, and it is widely agreed that integrated water resource management (IWRM) is the way forward. IWRM is the concept of managing water sectors subject to various objectives in an integrated manner, while considering social, economic and environmental dimensions. It includes the management of both the water supply and the demand to reduce projected gaps and meet future needs in a river basin. This is a difficult task that requires sound and reliable information about the river basin in terms of physical, hydrological and demographic characteristics. It is also quite a difficult decision-making process, especially in highly developed basins, due to the very complex socio-economic systems with different interest groups pursuing multiple and conflicting objectives. On the other hand, inherent hydrological variability causes uncertainties that complicate the decision-making process. Scenario analyses using computer simulation models have commonly been used in water resource management to overcome these uncertainties. The indicators, obtained directly by models and/or from a post-process of model results, serve to test the performance of alternative management policies. Since there has been a pronounced need for coping with water crises in recent years, the future states of water supply and water demand have been assessed under varying climatic and hydrological conditions (e.g.Varis et al., 2004; Jeong et al., 2005; Pallottino et al., 2005), water resource development plans (e.g. Koch et al., 2005; Loukas et al., 2007) and water demand management practices (e.g. Chen et al., 2005; Levite et al., 2003). However, decisions in water management are characterised by multiple objectives and multiple stakeholders, and the objectives cannot be easily traded off with each other. This multiplicity overburdens decision makers (DMs) in finding the best decision; thus, a powerful tool is desired for the final selection. Therefore, many researchers employ multi-criteria decision making (MCDM) methods to cope with water-related problems in their studies, as well as in research projects that foresee the establishment of decision support systems (DSS) in acquiring sustainable development strategies. MCDM has been used in water resources literature as a major component of decision support systems (e.g. Qureshi and Harrison, 2001; Hamalainen et al., 2001; Fassio et al., 2005; Jaber and Mohsen, 2001; Maia and Schumann, 2007; Makropoulos et al., 2008). It has been applied to an array of problems in water resources, including river basin planning (e.g. Qin et al., 2008; Raju et al., 2000; Eder et al., 1997), water supply/allocation and reservoir operation (e.g. Srdjevic et al., 2004; Flug et al., 2000; Mahmoud and Garcia, 2000), urban water management (e.g. Zarghami et al., 2008, Joubert et al., 2003; De Marchi et al., 2000), design of monitoring networks (e.g. Harmancioglu and Alpaslan, 1992), wastewater treatment alternatives (e.g. Kholgi, 2001; Khalil et al., 2005), water quality (e.g. Heilman et al., 1997), groundwater management (e.g. Pietersen, 2006), flood control (e.g. Tkach and Simonovich, 1997), wetland management (e.g. Janssen et al., 2005), and irrigation planning (e.g. Tiwari et al., 1999; Gupta et al., 2000).
Like many rive basins in Mediterranean countries, the Gediz River Basin (GRB) suffers from water scarcity due to rapid demographic and economic development, urbanisation, industrialisation and inefficient irrigation activities. It is regarded as an agriculture-dominant basin, and domestic, industrial and agricultural water use ratios are about 15%, 10% and 75%, respectively. Since irrigation augments agricultural production, irrigation and wealth have been closely linked. Current analyses on the hydrological budget of the basin indicate that the overall supply of water for various uses is approximately equal to the overall demand (Harmancioglu et al., 2005). This means that limited water resources become a key factor in socioeconomic development, and a comprehensive assessment of the water budget in the GRB and evaluation of management plans in terms of economic, social and environmental criteria have become imperative.
In this study, a water resource management model that facilitates indicator-based decisions, with respect to environmental, social and economic dimensions, from a multiple criteria perspective is developed for the GRB. Although the model is intended for the entire basin, due to lack of adequate and reliable data on domestic and industrial water users who consume groundwater resources, the main targets of the study were limited to the surface water resources used for irrigation purposes. The supply and demand processes are simulated under 3 different climate scenarios to reflect baseline as well as better and worse conditions. After the simulation process, the performance of management alternatives under proposed economic, social and environmental criteria are determined. The study has delineated the best management alternative on the basis of 3 different MCDM methods. Each method is also applied with 7 different sets of criteria weights that represent objective judgements as well as subjective preferences of decision makers. The use of such weights facilitated a sensitivity analysis towards deriving conclusive recommendations for robust decisions.
The study is presented in 5 sections. The 2nd section introduces the methodological framework, in which the modelling tool and MCDM processes are explained. Section 3 presents the application of the methodology to the GRB. In Section 4, the performance evaluation of management scenarios under optimistic, business-as-usual, and pessimistic conditions is presented, along with the multi-criteria decision-making process based on various criteria weights. Section 5 covers the general conclusion of the study.
Methodology
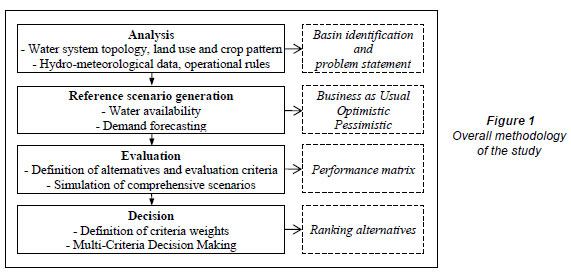
Figure 1 presents the overall methodology, which is divided into 4 successive phases: analysis, scenario generation, evaluation and decision, each referring to a major step. The analysis phase essentially describes the representative water problems of the basin and produces the basic inputs for the next phase. Here, the topology of the water system (e.g. main rivers, reservoirs, lakes, transmission links, and demand sites), historical hydro-meteorological data, and changes in land use as well as crop pattern are the essential inputs for water supply/demand features. In the scenario generation phase, reference scenarios are developed as 'developments which cannot be directly influenced by the decision makers', i.e., changes such as hydro-meteorological variability or population growth. Since such changes influence the water balance in terms of demand and supply, it is significant to demonstrate different scenarios, especially representing the baseline, best and worst cases, not only to evaluate the outcomes of alternative management practices, but also to estimate future basin conditions. In the evaluation phase, there are 2 main modules:
• Defining possible alternatives (with their reasonable time frame of application) and evaluation criteria
• Simulating the comprehensive scenarios which combine reference scenarios and alternatives. The performance matrix obtained is the basic instrument for decision making. The decision phase aims to rank alternatives through the use of MCDM methods. The criteria weights are another important component that can manipulate the decisions. Therefore, in order to reach robust decisions, more than one MCDM method and different criteria weight sets are used in this phase.
Water Evaluation and Planning System (WEAP )
Accomplishment of the above water management model requires computer software (simulation model) as an essential tool to account for water availability and demand scenarios, and also to evaluate possible management plans based on supply enhancement and/or demand management. In this study, the Water Evaluation and Planning System (WEAP), developed by the Stockholm Environment Institute, is used, as it is compatible with the approach proposed. WEAP, which is free for academic use, is also user-friendly, easyuse software, and its applications generally involve the following steps (SEI, 2007):
• Problem definition, including time frame, spatial boundary, system components and configuration
• Establishing the 'current accounts' which provide a snapshot of actual water demand, resources and supplies for the system
• Building scenarios based on different sets of future trends, based on policies, technological development, and other factors that affect demand, supply and hydrology
• Evaluating the scenarios with regard to criteria such as adequacy of water resources, costs, benefits, and environmental impacts
WEAP operates on a monthly time step, starting from the first month of the 'current accounts' year and continuing up to the last month of the last scenario year; it computes water mass balance for every node and link in the system for the simulation period. Due to the space limitations, the detailed features, calculation algorithms and explanations of WEAP are not given here, but can be found in the user guide of the model (SEI, 2007).
Evaluation criteria
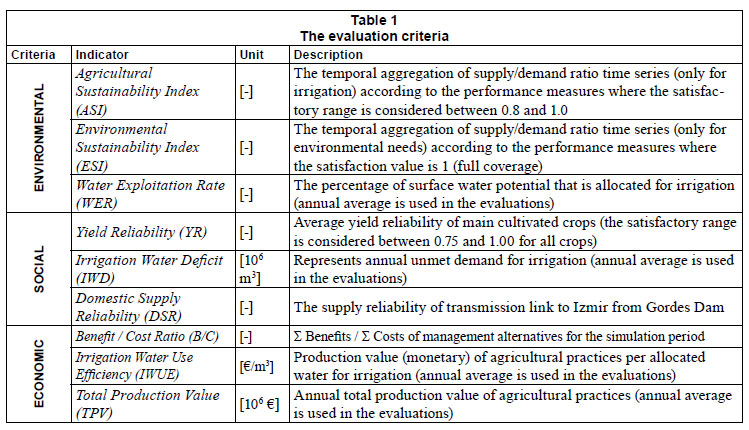
In order to evaluate the management alternatives, 9 criteria that are relevant to environmental, social and economic sustainability are developed (Table 1). The methodology for calculating criteria values is based on 2 approaches. The first one is the use of average values for indicator time series that is obtained annually during the simulation period. The second approach, which has been recommended by the American Society of Civil Engineers and the International Hydrological Programme (working group of UNESCO), is the temporal aggregation of indicator time series using performance measures of reliability, resilience and vulnerability (ASCE, 1998). This procedure can be illustrated by considering any selected indicator, C, whose time series of values is denoted as Ct, where the simulated time period, t, extends to some future time, T (Fig. 2). To define performance measures, the lower limit (LL) and the upper limit (UL) of satisfactory range should be identified. These limits may change within a year and over multiple years, and are based on the decision maker's judgements.
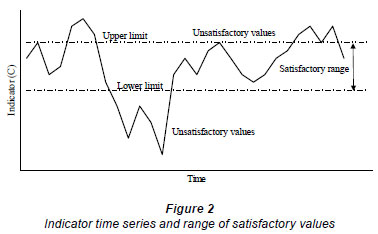
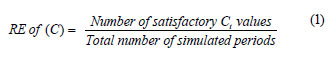
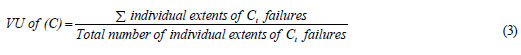
Reliability (RE) is defined as the probability that any particular Ct value will be within the range of values considered satisfactory (Eq. (1)). Resilience (RS) is an indicator describing the speed of recovery from an unsatisfactory condition. It is the probability that a satisfactory value Ct+ 1 will follow an unsatisfactory Ct value (Eq. (2)). Vulnerability (VU) is a statistical measure of the extent (magnitude) or the duration of failures in a time series. The extent (magnitude) of a failure is the amount by which a value Ct exceeds the upper limit, UL(Ct), of the satisfactory values or the amount by which the value falls below the lower limit, LL(Ct), of the satisfactory values. In this study, vulnerability is defined as expected extent-vulnerability (Eq. (3)), and the durations of failures are excluded.

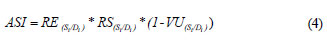
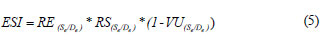
Sustainability Index that ranges from 0, for its lowest and the worst possible value, to 1, as its highest and the best possible value is computed by multiplying the reliability, resilience and (1-vulnerability) values since reliability and resilience are the maximising, while vulnerability is the minimising, criteria for sustainability. Thus, the agricultural sustainability index (ASI) and environmental sustainability index (ESI) are calculated with Eq. (4) and Eq. (5), respectively. The indicator used for ASI is the supply/demand ratio (S/D) of irrigation districts as well as of the environmental needs for ESI.
In this study, the satisfactory range in Fig. 2 is selected between 0.80 and 1.00, which are the LL(Si/Di) and UL(Si/Di), respectively, for irrigation purposes. However, for environmental needs, it is desired to meet all the water demand; thus, the LL(S/D) and UL(S/D) are both fixed to 1.
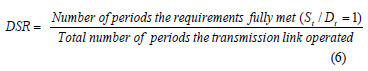
The reliability (Eq. (1)) is solely used to determine the domestic supply reliability (DSR), which indicates the percentage of time the requirement (the expected amount of water from a transmission link to domestic uses, Dt) is fully met with water allocated to the transmission link, St, (Eq. (6)). Here again, the LL(St/Dt) and UL(St/Dt) are both fixed to 1 while developing the indicator for this study.
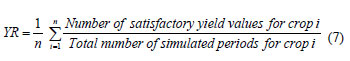
The yield reliability (YR) is another core social indicator that represents the probability of achieving at least a % of maximum yield. Here, a is a subjective constant and indicates the satisfactory level. The YR is formulated in Eq. (7), where the crop type and the number of crops are i and n, respectively.
Here, it should be noted that, since the crop yield, or more generally agricultural productivity, is largely influenced by the irrigation water deficit, the response of yield to water deficit is quantified through the yield response factor (k) which relates relative yield decrease to relative evapotranspiration deficit (Eq. (8)):
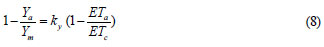
where:
Ya , Ym , ETa ETc and ky represent actual yield, maximum yield, actual evapotranspiration, crop (potential) evapotranspiration and yield response factor, respectively.
The k values differ according to the crops as well as to the ETa that differs according to the irrigation system. Accordingly, the YR indicator is a valuable indicator to address the performance of management alternatives with socio-economic aspects, and it is incorporated in the analyses with a reasonable satisfaction level (α=0.75).
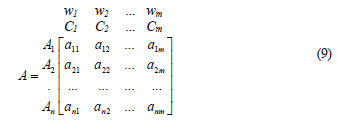
Performance matrix
The major element of the decision-making process is the performance matrix (PM), A, where the columns correspond to criteria (C1, C2, ..., Cm) and rows correspond to alternatives(A1, A2, ..., A,), with the entries (aij) being the indicators forall alternatives across all criteria (Eq. (9)). Once the matrix is set up, the next step for the decision process is to define the weights (w1, w2, ..., wm ) of the criteria, which reflect the DMs' subjective preferences:
Defining criteria weights
The criteria weights are usually assigned by the DMs, based on their own experiences, knowledge and perception of the problem. This assignment may be made via a preference elicitation technique such as the analytic hierarchy process (AHP). However, the DMs involved in the decision process usually have different attitudes and can rarely reach an agreement on the relative importance of criteria. Another difficulty is the inconsistency problem in subjective weighting. These problems can be overcome by using an objective weighting process, which is carried out independently from the subjective preferences of the DMs. The logic behind such a weighting process is that each alternative is objectively described by its performance scores, and these scores in the performance matrix represent the sources of information provided to the DM. In this study, different criteria weights obtained from various approaches are applied for ranking the alternatives.
Entropy method (EM)
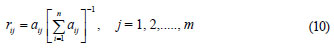
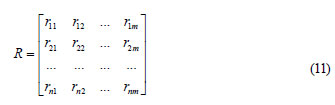
Entropy is generally understood as a measure of uncertainty in the information, as defined by Shannon and Weaver (1947). It indicates that a broad distribution represents more uncertainty than does a sharply peaked one (Deng et al., 2000). To determine objective weights by the entropy value (ej), the performance matrix in Eq. (9) needs to be normalised by Eq. (10). Then, a new matrix, Eq. (11), is derived, containing relative scores of alternatives across criteria.
The information contained in matrix R can be considered as the 'emission power' of each criterion Cj (j =1, 2,...., m) and is used to compute an entropy value ej:
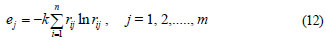
A constant k, k = 1/ ln n, is used to guarantee that 0 < ej < 1. The degree of divergence (fj) of the average intrinsic information contained in each criterion is calculated as:
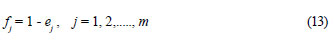
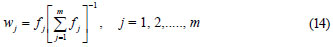
It means that the more divergent the initial scores a of alternatives Ai (i = 1, 2,..., n) are for a given criterion Cj, the higher is its fj and the more important is the criterion Cj for the problem. Consequently, if all alternatives have similar scores for a given criterion, this criterion is less important for the specific problem, and if all scores against this criterion are the same, the criterion can be eliminated because it transmits no information to the DM (Zeleny, 1982). If f is considered as the specific measure of inherent contrast intensity of the criterion Cj, the final relative weights for all criteria can be obtained by simple additive normalisation:
Because the criteria weights are obtained directly from the performance matrix, i.e., independently of the DM, this qualifies the entropy method (EM) as an unbiased evaluation procedure, and the same holds true for the results obtained with that criteria weight set.
CRITIC method (CM)
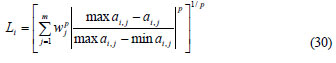
In addition to the entropy method, any other method of measuring the divergence in performance ratings can be used to determine the objective weights. Diakoulaki et al. (1995) has proposed the CRITIC (The CRiteria Importance Through Intercriteria Correlation) method that uses correlation analysis to detect contrasts between criteria. If we assume the normalised matrix, Eq. (11), by examining the jth criterion in isolation, we generate a vector rj denoting the scores of all n alternatives considered (Eq. (15)):
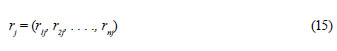
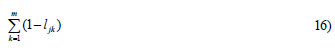
Each vector r is characterised by the standard deviation (σj), which quantifies the contrast intensity of the corresponding criterion. So, the standard deviation of rj is a measure of the value of that criterion to be considered in the decision-making process. Next, a symmetric matrix is constructed, with dimensions m x m and a generic element ljk, which is the linear correlation coefficient between the vectors rj and rk. It can be seen that the more discordant the scores of the alternatives in criteria j and k are, the lower is the value ljk. In this sense, Eq. (16) represents a measure of the conflict created by criterion j with respect to the decision situation defined by the rest of the criteria:
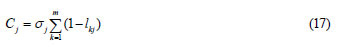
The amount of information Cj conveyed by the jth criterion can be determined by composing the measures which quantify the above 2 notions through the multiplicative aggregation formula (Eq. (17)). According to the previous analysis, the higher the value Cj is, the larger is the amount of information transmitted by the corresponding criterion and the higher is its relative importance for the decision-making process. Objective weights are derived by normalising these values to unity (Eq. (18)).

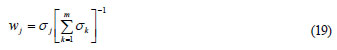
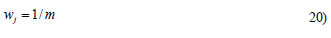
It is worth mentioning that Diakoulaki et al. (1995) and Deng et al. (2000) also recommended the standard deviation weight (SDW) and mean weight (MW) methods to obtain objective weights. The SDW method calculates the weights by Eq. (19), where σj is the standard deviation of the performance rating vector rij: The MW method derives objective weights by Eq. (20), where m is the number of criteria. Assignment of equal weights to the decision criteria reflects a completely neutral attitude of the decision maker, and it is often considered that such an attitude guarantees the objectivity of the evaluation process.
Analytic Hierarchy Process (AHP)
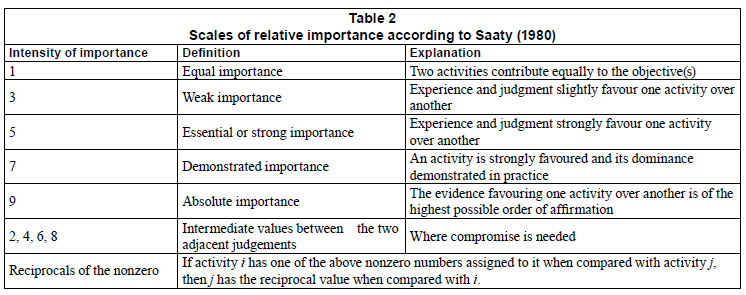
The AHP developed by Saaty (1980) is a method of converting subjective assessments to a set of weights by pairwise comparisons between all criteria. The pairwise comparisons are quantified by using a linear scale as in Table 2.
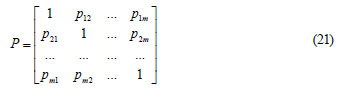
In accordance with Table 2, the DM is asked to define the pairwise comparison matrix, P, where the entries pij are described as the relative importance of the ith criterion with respect to the jth criterion (Eq. (21)):
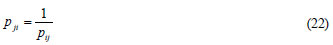
In the comparison process, once the upper triangular matrix is determined, the lower triangular matrix can be defined by Eq. (22):
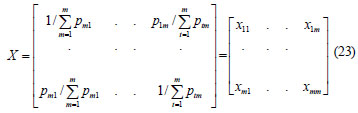
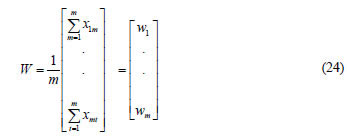
The normalised pairwise comparison matrix (X) is obtained by dividing each element in P by its column sum (Eq. (23)). Then, the principal eigenvector λ that defines the criteria weight vector (W) is obtained by averaging across the rows of X (Eq. (24)), where the wj (j=1,.. m) shows the relative weights among the criteria that are compared, and the sum of criteria weights is 1.
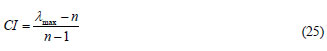
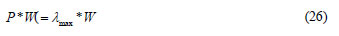
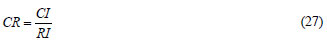
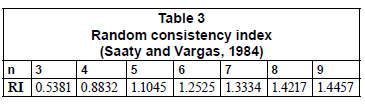
On the other hand, the consistency of weights must also be checked (Triantaphyllou, 2000). Saaty (1980) expresses the inconsistency of the pairwise comparison matrix in terms of the consistency index (CI), which is defined as in Eq. (25), where λmax is the maximum eigenvector of the pairwise comparison matrix, and n is the order of that matrix. Saaty (1980) also claims that one should find an eigenvector corresponding to λmax , as in Eq. (26), where λmax > n. Then, the consistency ratio (CR), which is the comparison between the consistency index (CI) and the random consistency index (RI) given in Table 3, is determined as in Eq. (27) to measure the inconsistency of subjective judgements of DMs. If this approach yields a CR value smaller or equal to 10%, the inconsistency is acceptable.
The AHP method is relatively simple to determine the criteria weights; however, the DM needs to define a total of n (n-1) subjective judgements among n criteria. Since this process is not easy, the DM may be overburdened to obtain reliable weights. Thus, in this study, the AHP is used to determine the weights of a few numbers of criteria which relate to the main management objectives.
MCDM methods
Simple Additive Weighting (SAW), Compromise Programming (CP) and Technique for Order Preference by Similarity to Ideal Solution (TOPSIS) can be cited as the methods that directly use the PM to rank the alternatives. 'ELimination Et Choice Translating Reality' (ELECTRE) and Preference Ranking Organisation Method for Enrichment Evaluation (PROMETHEE) are the other important MCDM methods found in the literature. Generally, the first group is known as the distance type methods (excluding SAW), and the second group is the outranking type methods. However, the outranking type methods, which are based on the pairwise comparison between alternatives via selected criteria, need more subjective judgements, like indifference, preference and veto thresholds, to be determined by the DMs. Since an objective evaluation of management alternatives is foreseen, the 2 distance type methods (CP and TOPSIS) and SAW method are applied in the decision-making process of this study.
Simple additive weighting (Saw )
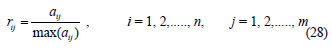
In the SAW method, with a normalisation procedure (Eq. (28)) for each criteria j, the performance values (ai,j) are transformed onto a scale between 0 and 1, where 1 represents the best performance. The selection of alternatives is made on the basis of ui, which is determined by Eq. (29). The higher utility values (ui) correspond to better alternatives. In this method, a complete compensation among the criteria is possible. In addition, for the minimising criteria lower values are better, and the reciprocals of ai,j (1/ai,j) are to be used in the normalisation procedure (Pomerol and Barba-Romero, 2000).
Compromise programming (CP)
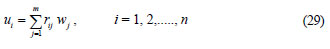
The CP ranks alternatives according to their closeness to the so-called 'ideal' point. The best alternative in a set of efficient solutions is the one whose location is at the least distance from the ideal point. The weighted distance measure used in CP is the family of Li metrics (Eq. (30)) defined in a special way by Zeleny (1982). A parameter p is used to implicitly express the DM's intent to balance the criteria (p = 1), to accept decreasing marginal utility (p > 1), or to search for an absolutely dominant solution (p = ∞). Accordingly, the measurement of the distance is based on the p parameter, where p = 1, p = 2 and p = ∞ correspond to Block distance, Euclidean distance and Tchebycheff distance, respectively (Pomerol and Barba-Romero, 2000). The most common value is p = 2, where larger distances from the ideal solution are penalised more than the smaller distances from the ideal. Whichever parameter value (p) is used, an alternative with the minimum Li metric is considered as the best. It should be mentioned that max a refers to the ideal point whereas min ai,j refers to an anti-ideal point. However, if the DM can define the specific points for each criterion as ideal and anti-ideal, the relevant values can be shifted with the recommended ones. Where no such points exist, as in this study, they may be drawn from within the performance matrix (Hajkowicz and Higgins, 2008).
Technique for Order Preference by Similarity to Ideal Solution (TOPSIS)
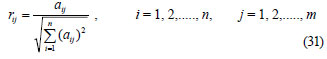
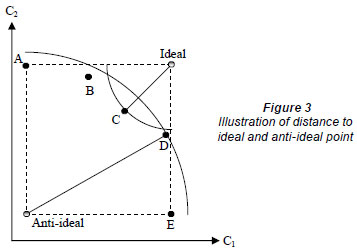
The TOPSIS method developed by Hwang and Yoon (1981) is based on order preference by similarity to the ideal solution. It is a rational and relatively simple method where the underlying concept is that the most preferred alternative should not only have the shortest distance from 'ideal' solution, but also the longest distance from an 'anti-ideal' solution. As an illustration, Fig. 3 shows 5 alternatives, A, B, C, D and E, with a choice of 2 criteria; it also shows the ideal and anti-ideal points. It is obvious that, if we use the usual Euclidean distance (p = 2) with equal weights, point C is the closest to the ideal and D is the furthest. TOPSIS solves this dilemma in the choice between the ideal and the anti-ideal. To apply the TOPSIS method, the performance matrix needs to be normalised by Eq. (31):
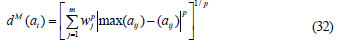
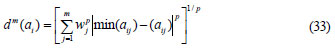
For each alternative ai, the weighted distances dM(ai) and dm(ai) corresponding to the ideal and the anti-ideal are computed by Eq. (32) and Eq. (33), respectively, according to the chosen metric p:
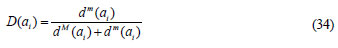
The similarity ratio (Eq. (34)) can be computed, using the above equations, and this varies from D(min(ai))=0 for the anti-ideal point to D(max(ai))=1 for the ideal point. The alternative with the highest ratio is the best option.
Application
The Gediz River Basin
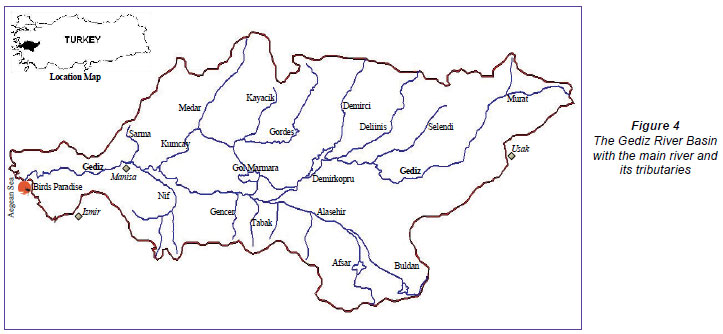
The Gediz River, with a length of 275 km, drains an area of some 18 000 km2 and flows from east to west into the Aegean Sea just north of Izmir in western Turkey. The main tributaries of Gediz River are Deliinis, Selendi, Demirci, Nif, Kumcay and Alasehir creeks (Fig. 4). The Gediz River Basin (GRB) is surrounded by mountains in the north, south and east directions, and is located geographically at the interval of 38º 01'- 39º 13' northern latitude and 26º 42'-29º 45' eastern longitude. The GRB has a typical Mediterranean climate with hot, dry summers and cool winters. The mean annual temperature is 15.6ºC, and average annual precipitation is 635 mm.
The GRB includes large fertile plains which are subject to extensive agricultural practices with large irrigation schemes covering an area of about 110 000 ha. The main crops cultivated are cotton, maize, grape, vegetables and cereals. Due to climatic conditions, irrigation is the most important requirement of agriculture, which is the main economic activity in the basin; therefore a great portion of surface water resources, i.e., 75%, is allocated to irrigation. The Demirkopru Dam is the main reservoir in the basin while the Gol Marmara Lake is operated for the additional supply of water for irrigation in summer season. Afsar and Buldan Dams are two small dams in the southeastern part of the basin. Two new dams, Gordes and Yigitler, will be operated in a few years' time.
The population of the basin was about 1.7 million in 2000, with an annual growth rate of 1.5%. However, the internal migration from rural to urban areas and the rapid urbanisation in the major cities exert pressure on domestic water demand, which increases at an annual rate of 2% (SMART, 2005). Izmir is the third largest city in Turkey and consumes a significant portion of the groundwater resources of the basin, which is almost 108T06m3/yr. In addition, the projected withdrawal from the Gordes Dam to Izmir is 60T06m3/yr. Since the amount of surface water that is allocated to irrigation will decrease in favour of domestic water supply, in fact, this new plan for Izmir is disturbing to the farmers as well as the irrigation associations (IAs) who are responsible for distributing irrigation water to the farmers under the State Hydraulic Works' (DSI) authority.
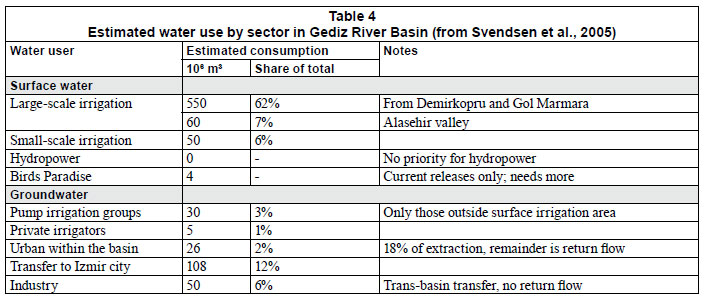
Birds Paradise, covering 8 000 ha, is part of the Gediz River delta and forms the main feeding and breeding location within the delta. In fact, the area receives excess water from the Gediz River for much of the year, but since 1990, with restrictions on irrigation releases, it suffers from water shortages. The summer months are the critical times for providing water specifically to the nature reserve due to the intensive irrigation practices. As presented in the working paper of the International Water Management Institute (IWMI), the water demand of Birds Paradise is 14.2T06 m3 and 7.9T06 m3 in a dry and a wet year, respectively (De Voogt et al., 2000). This environmental water demand is also incorporated into the analyses with monthly variations of an average annual demand (12-106m3), and the coverage of this water demand also constitutes an important criterion to identify the best management alternative.
It is obvious that irrigation uses a large share of the surface water resources of the basin, and withdrawals total about 660-106 m3, with 83% of that going to large-scale irrigation systems (Table 4). On the other hand, it is well known that the current use of water for irrigation purposes is inefficient, due to the antiquity of water conveyance systems (open channel) which lead to high water losses, non-adapted type of crops, lack of maintenance of irrigation systems, and farmer's lack of knowledge about appropriate irrigation practices. The canal losses are approximately 32%, and the irrigation efficiency is 60%. Therefore, the modernisation of irrigation techniques should be encouraged, and more productive use of water should be a fundamental objective, not only for agriculture but also for other water demanding sectors.
Management alternatives
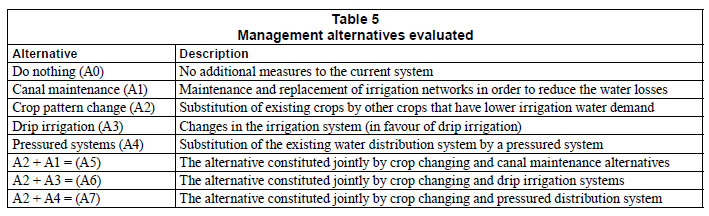
Although a large number of alternatives can be proposed in water resources management, all alternative management plans may not be compatible with basin features, and the acceptability of an alternative depends on the socio-economic realities of the country. In Table 5, the alternatives are proposed in accordance with the aim of the study; that is, to increase the water supply for irrigation and the irrigation efficiency and decrease the demand. The management alternatives are explained below along with their main assumptions, schedules and their relevant areas of application. Since the performance of these alternatives differs with respect to changing hydro-meteorological conditions, they are evaluated under each reference scenario.
Alternative A1 addresses the gradual reduction of losses from 32% to 15% in 6 years, with an even distribution of costs throughout this period. This alternative assumes that the interventions will be implemented evenly in all transmission links. This is a reasonable way to ensure the same investment priority.
After the severe drought between 1989 and 1994, cultivation of maize instead of cotton had been the only response of farmers to the water scarcity problem. Alternative A2 is designed and applied to each irrigation district according to their existing trends. The main focus of the alternative setup is, in general, increasing the cultivation area of maize while decreasing cotton cultivation. The slow increase of grape cultivation is also added to the analyses.
In recent years, the farmers in the basin are offered some significant incentives with subsidies to construct water-saving irrigation technologies (e.g. drip irrigation systems). The policy is to promote irrigation efficiency, which is currently estimated to be in the range of 60%. In accordance with this policy, Alternative A3 that is evaluated for improvement of irrigation methods is developed in 2 parts. The 1st part is the replacement of the current water distribution network by a pressured (piped) system. The investments are scheduled to be implemented in 6 years (2004-2010). The water loss in the piped system is assumed to be 2% of water passing through the link. The 2nd part refers to a transition from the currently used furrow irrigation methods to drip irrigation systems in all irrigation districts. The drip irrigation alternative is introduced to the model by assuming that the share of drip irrigation will be in the order of 80% of the irrigated area in 2030 and that the initial implementation will begin after 2010 (the operation year of the pressured system).
Alternative A4 evaluates only the 1st part of A3 which considers the use of drip irrigation. That is, it focuses only on the replacement of the current water distribution network by a piped one without the option of a transition to drip irrigation methods. In so doing, it is possible to evaluate how the performance indicators improve if high conveyance losses are reduced to a negligible size. It is also a reasonable way to evaluate a lower-cost alternative relative to A3.
The alternative combinations, A5, A6 and A7, are also developed to evaluate the results of aggregated management plans. The crop pattern change alternative (A2) is considered together with canal maintenance (A1), drip irrigation (A3) and pressured systems (A4) alternatives to develop the A5, A6 and A7 alternatives, respectively.
Reference scenarios
The reference scenarios developed are based on changing hydro-meteorological conditions, and simulations are run to identify the possible impacts of changing conditions on basin water budget in terms of water supply and demand. Accordingly, 3 main reference scenarios are developed with combinations of water availability and demand scenarios. The demand scenarios are based only on temperature increases leading to increases in crop irrigation water requirement due to higher potential evapotranspiration. Since the Gordes Dam will be in operation within the simulation period (2003-2030), the planned water withdrawal to Izmir is also incorporated into the reference scenarios. Here, it should be noted that the starting point of the simulation period is 2003, which is the last year of published data records.
The Business as Usual (BAU) scenario foresees the preservation of long-term averages with respect to water availability and water demand. In order to formulate the BAU scenario, the monthly average stream flows which were monitored between 1977 and 2003 are replicated for the simulation period. The water demand computations, where the monthly averages of temperature and precipitation are used, are carried out, considering constant irrigation areas as well as the same crop patterns for all irrigation districts.
The Pessimistic scenario (PES) focuses on low water availability and high demand. The project report dealing with the climate change effects in Gediz River Basin estimates the decreases in stream flows as well as in precipitation, and increases in the average monthly temperatures (SUMER, 2006). In this report, the expected future variations in these hydro-meteorological parameters are determined, using different climate change scenarios for the years 2030, 2050 and 2100. The results for 2030 in the B2-SRES scenario, which emphasises local solutions to economic, social and environmental sustainability with moderate population growth and economic development, are used to formulate the pessimistic scenario. Since the decrement in runoff is estimated to be about 23%, the monthly runoff time series used in the BAU scenario are decreased with this ratio to obtain pessimistic water availability conditions. Accordingly, the changes in precipitation and temperature with respect to the B2 scenario are used to set up the demand side of the water system. Since the estimations are given for 2030, a value in any given month within the simulation period is computed by linear interpolation.
The Optimistic scenario (OPT) foresees high water availability and stable water demand. In this scenario, the river flows are represented by the monthly runoff data that are increased by 23%. In so doing, the runoff series are considered not only as wet-year averages, but also as the reversed conditions of the pessimistic scenario. Temperature and precipitation as well as the irrigation area are assumed constant in defining the stable water demand.
Results
The performance matrixes and criteria weights
For the Gediz case, the performance matrix (PM) is set up with 9 performance indicators versus 8 alternatives (including A0, the do-nothing alternative). Since the entries of PMs differ with hydro-meteorological conditions, 3 PMs are obtained for 3 reference scenarios. In Table 6a, where the best values are highlighted, performance evaluation under the BAU scenario is presented. A0 and A2 alternatives are not seen as feasible alternatives since they are dominated by the others; in other words, indicators for these alternatives are less than for all other alternatives. A1, A4 and A7, which focus on the reduction of water losses in the conveyance system, as well as A3 and A6, which improve irrigation efficiency, are considered as the alternatives which are worth analysing in depth. Since increased water availability is foreseen in the optimistic scenario, similar results with higher performance values are observed (Table 6b). In the pessimistic scenario, the performance indicators are worse than those in BAU and OPT, as expected (Table 6c).
After the performance matrix is obtained, the next step in the decision-making process is the determination of criteria weights. With respect to the methods explained previously, objective criteria weights are obtained by the performance matrix of each reference scenario as in Table 7, where EW, CW and SDW are the criteria weights derived by the entropy method, critic method and the standard deviation method, respectively. Reasonably, the MW represents the idea of equal weighting, and also an objective weighting procedure where the weight of each criterion is 0.111(=1/9), the sum being 1.
The objective weights show that IWD, ESI and ASI are the most important criteria to assess the alternatives' overall performance, and that the other criteria do not have a powerful impact on decision making. In other words, the alternative scores for the aforementioned criteria are more divergent and, consequently, are more important for the problem. The sum of these 3 criteria weights derived by the entropy method is almost 0.90 for all scenarios. It is interesting to note that when the worsening conditions are considered (from OPT to PES) the ESI gain more importance.
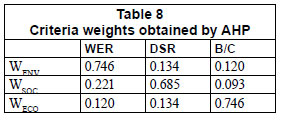
The subjective criteria weight sets, namely WENV , WSOC and WECO, are developed by the AHP method to illustrate the subjective preference of the DM who is concerned with environmental, social and economic criteria. The AHP method is arranged among the criteria WER, DSR and B/C, which demonstrate the categories with respect to environmental, social and economic issues. In so doing, not only is the number of required pairwise comparisons between the criteria (9*(9-1)/2=36) reduced to a manageable size (3*(31)/2=3), but the alternatives are evaluated by the criteria that are not considered important in the objective weighting methods. With respect to the preference judgements of DMs who gave priority to environmental effects, WER was regarded to have 'strong importance' over DSR and 'demonstrated importance' over B/C; and 'equal importance' between DSR and B/C criteria was considered. In the preference matrix constituted according to the DM who gave priority to social criteria, DSR was regarded to have 'intermediate importance' over WER and 'weak importance' over B/C, and again 'weak importance' was considered between DSR and B/C. Considering the DMs who gave priority to economic criteria, B/C was regarded to have 'strong importance' over WER and 'demonstrated importance' over DSR, and 'equal importance' was assumed between DSR and B/C. Table 8 summarises the preference judgements converted to numbers where WENV ,WSOC and WECO represent the criteria weights of DMs who prioritise the environmental, social and economic sides, respectively.
Decision making
The CP and TOPSIS, in which the distance is measured by the Euclidean distance (p=2), and the SAW method is applied to rank the alternatives. Respectively, the alternative rankings with regard to CP, TOPSIS and SAW methods are given in Table 9a, which summarises the results obtained by relevant criteria weights for the BAU scenario.
If we consider EW, CW, SDW and MW, A3 is identified as the most preferred alternative for all MCDM methods, followed by A6 and A7. The worst alternatives are A0, A2 and A5, which is easy to see by reviewing the data in Table 6a. Although the subjective weights, WENV and WSOC, have similar ranks, this is not true for WECO , in which significant weight is assigned on B/C. Alternatives A1 and A5 are identified as the most preferred alternatives according to the DM who is concerned with economic criteria, while the alternatives including the drip irrigation method (A3 and A6) appear to be the worst. Similar results are obtained when the optimistic conditions are considered (Table 9b).
Regarding the pessimistic scenario, the rank of alternatives is, again, consistent with respect to not only the MCDM methods but also to the criteria weights considered. The only noticeable difference is seen in the ranking obtained by WECO. If we consider the last column in Table 9c, opposite to the previous results based on WECO , A0 and A2 alternatives are seen as the 2 worst alternatives, at least when TOPSIS and SAW methods are used. So, even if the DMs highly prioritise B/C criterion, A0 (doing nothing) and A2 (crop pattern change) alternatives are seen as the 2 worst alternatives when the pessimistic scenario is assumed.
The major results derived from the scenario analyses of possible hydro-meteorological variations in the Gediz River Basin and those evaluated on the basis of the proposed management alternatives can be summarised as the following:
• The Basin is already under water stress and is also quite sensitive to drought conditions. If the pessimistic conditions, which lead to decreased water supply and increased water demand, occur, the resulting successive water deficits will significantly affect the agricultural sector. Moreover, even when the optimistic scenario is assumed to occur, it is not possible to observe a significant improvement in the water budget. Accordingly, efficient water management policies are crucial to solve water problems and to ensure sustainable development in the Gediz River Basin.
• Considering environmental, social and economic sustainability, replacement of the water conveyance system by pressured lines coupled with the application of drip irrigation methods, Alternative A3, is determined as the most efficient and satisfactory management strategy for the Basin. With this strategy, it is not only possible to minimiSe the negative impacts of droughts, but also to stabilise or improve the current performance indicators. According to the decision-making process based on MCDM, the above recommended strategy should be supported further by additional measures, such as crop change applications, even if the conditions are worse than expected, in other words, even when the pessimistic scenario occurs.
• Since water transfer from Gordes Dam to Izmir is inevitable, the proposed alternative should be implemented as early as possible. This will ensure early benefits and will lead to economic achievements.
• Although they are easy and/or cheap, the traditional measures, such as change of crop pattern (A2) and reduction of losses in the current water conveyance system (A1), are not considered as adequate and efficient responses for sustainable use of water resources.
• The MCDM methods used in the study pinpoint the same alternative as the best choice. Thus, it is possible to say that the decision on the best alternative is basically independent of the MCDM method used, but slightly sensitive to the weights assigned to the criteria as well as the data used in the analyses. Availability of accurate and adequate data is imperative for reliable and robust decisions.
• The use of the entropy method, which directly exploits the information contained in data, is assigned as a reasonable way in criteria weighting, and also for robust and unbiased decisions. Equal weighting is also another method that is proposed for decision makers dealing with a large set of alternatives to minimise their efforts for the weighting procedure.
Conclusion
In the study presented, a water resource management model that facilitates indicator-based decisions with respect to environmental, social and economic dimensions, from a multiple criteria perspective, is developed for the Gediz River Basin. The MCDM methods have identified the same rankings among the management alternatives when objective weights are assigned to the criteria. A different ranking is obtained only with the weight set which heavily prioritises economic indicators. Hence, criteria weighting is an important process in decision making.
An interesting point achieved with the case study is the remarkable consistency recognised between the current water management policies in the Gediz River Basin and the results of economy-weighted analyses. In other words, canal maintenance is observed to be the most preferred alternative for both. This implies that a special emphasis is devoted to the cost of the alternative in real-life applications. However, economic efficiency and environmental sustainability also need to be satisfied in management strategies. In this regard, the developed methodology is a valuable tool for the assessment of water resource systems and illustrates an efficient implementation of an integrated water resource management approach for the Gediz River Basin. In particular, the WEAP software is a potentially useful tool for planning and management of water resources, and it provides a comprehensive, flexible and user-friendly framework for evaluation of management strategies.
References
AMERICAN SOCIETY OF CIVIL ENGINEERS (ASCE) (1998) Sustainability Criteria for Water Resources Systems. Task Committee on Sustainability Criteria, Water Resources Planning and Management Division, ASCE and Working Group, UNESCO/IHP IV Project M-4.3. ASCE, Reston. Va. [ Links ]
CHEN Y, ZHANG D, SUN Y, LIU X, WANG N and SAVENIJE HHG (2005) Water demand management: a case study of the Heihe River Basin in China. Phys. Chem. Earth 30 408-419. [ Links ]
DE MARCHI B, FUNTOWICZ SO, LO CASCIO S and MUNDA G (2000) Combining participative and institutional approaches with multicriteria evaluation: an empirical study for water issues in Troina, Sicily. Ecol. Econ. 34 267-282. [ Links ]
DE VOOGT K, KITE G, DROOGERS P and MURRAY-RUST H (2000) Modeling Water Allocation Between Wetlands and Irrigated Agriculture: Case Study of the Gediz Basin, Turkey. International Water Management Institute, Colombo, Sri Lanka. [ Links ]
DENG H, YEH CH and WILLIS RJ (2000) Inter-company comparison using modified TOPSIS with objective weights. Comput. Oper. Res. 27 963-973. [ Links ]
DIAKOULAKI D, MAVROTAS G and PAPAYANNAKIS L (1995) Determining objective weights in multiple criteria problems: The CRITIC method. Comput. Oper. Res. 22 763-770. [ Links ]
EDER G, DUCKSTEIN L and NACHTNEBEL HP (1997) Ranking water resource projects and evaluating criteria by multicriterion Q-analysis: an Austrian case study. J. Multi-Criteria Decision Anal. 6 259-271. [ Links ]
FASSIO A, GIUPPONI C, HIEDERER R and SIMOTA C (2005) A decision support tool for simulating the effects of alternative policies affecting water resources: an application at the European scale. J. Hydrol. 304 462-476. [ Links ]
FLUG M, SEITZ LH and SCOTT JF (2000) Multicriteria decision analysis applied to Glen Canyon Dam. J. Water Resour. Plann. Manage. 126 (5) 270-276. [ Links ]
GUPTA AP, HARBOE R and TABUCANON MT (2000) Fuzzy multiple-criteria decision making for crop area planning in Narmada River Basin. Agric. Syst. 63 1-18. [ Links ]
HAJKOWICZ S and HIGGINS A (2008) A comparison of multiple criteria analysis techniques for water resource management. Eur. J. Oper. Res. 184 255-265. [ Links ]
HAMALAINEN RP, KETTUNEN E, MARTTUNEN M and EHTAMO H (2001) Evaluating a framework for multi-stakeholder decision support in water resources management. Group Decis. Negotiation 10 (4) 331-353. [ Links ]
HARMANCIOGLU NB and ALPASLAN N (1992) Water quality monitoring network design: a problem of multi-objective decision making. Water Res. Bull. 28 179-192. [ Links ]
HARMANCIOGLU NB, OZKUL S and BARAN T (eds.) (2005) Network on governance, science and technology for sustainable water resource management in the Mediterranean: The role of DSS tools -NOSTRUM-DSS Project National Report II-Turkey. Project code: INCO-MPC-1-509158, Izmir. [ Links ]
HEILMAN P, YAKOWITZ DS and LANE LJ (1997) Targeting farms to improve water quality. Appl. Math. Comput. 83 173-194. [ Links ]
HWANG CL and YOON KS (1981) Multiple Attribute Decision Making: Methods and Applications. Springer, New York. [ Links ]
JABER JO and MOHSEN MS (2001) Evaluation of non-conventional water resources supply in Jordan. Desalin. 136 83-92. [ Links ]
JANSSEN R, GOOSEN H, VERHOEVEN ML, VERHOEVEN JTA, OMTZGT AQA and MALTBY E (2005) Decision support for integrated wetland management. Environ. Model. Software 20 215-229. [ Links ]
JEONG CS, HEO JH, BAE DH and GEORGAKAKOS GP (2005) Utility of high-resolution climate model simulations for water resources prediction over Korean Peninsula: a sensitivity study. Hydrol. Sci. J. 50 (1) 139-153. [ Links ]
JOUBERT A, STEWART TJ and EBERHARD R (2003) Evaluation of water supply augmentation and water demand management options for the City of Cape Town. J. Multi-Criteria Decis. Anal. 12 17-25. [ Links ]
KHALIL WA, SHANABLEH A, RIGBY P and KOKOT S (2005) Selection of hydrothermal pre-treatment conditions of waste sludge destruction using multicriteria decision-making. J. Environ. Manage. 75 53-64. [ Links ]
KHOLGHI M (2001) Multi-criterion decision making tools for wastewater planning management. J. Agric. Sci. Technol. 3 281-286. [ Links ]
KOCH H, KALTOFEN M, GRUNEWALD U, MESSNER F, KARKUSCHKE M, ZWIRNER O and SCHRAMM M (2005) Scenarios of water resources management in the Lower Lusatian mining district, Germany. Ecol. Engin. 24 49-57. [ Links ]
LEVITE H, SALLY H and COUR J (2003) Testing water demand management scenarios in a water-stressed basin in South Africa: application of the WEAP model. Phys. Chem. Earth 28 779-786. [ Links ]
LOUKAS A, MYLOPOULOS N and VASILIADES L (2007) A modeling system for the evaluation of water resources management strategies in Thessaly, Greece. Water Resour. Manage. 21 1673-1702. [ Links ]
MAHMOUD MR and GARCIA LA (2000) Comparison of different multicriteria evaluation methods for Red Bluff diversion dam. Environ. Model. Software 15 471-478. [ Links ]
MAIA R and SCHUMANN AH (2007) DSS application to the development of water management strategies in Riberias do Algarve River Basin. Water Resour. Manage. 21 897-907. [ Links ]
MAKROPOULOS C K, NATSIS K, LIU S, MITTAS K and BUTLER D (2008) Decision support for sustainable option selection in integrated urban water management. Environ. Model. Software 23 1448-1460. [ Links ]
PALLOTINO S, SECHI GM and ZUDDAS P (2005) A DSS for water resources management under uncertainty by scenario analysis. Environ. Model. Software 20 1031-1042. [ Links ]
PIETERSEN K (2006) Multiple criteria decision analysis (MCDA): a tool to support sustainable management of groundwater resources in South Africa. Water SA 32 (2) 119-128. [ Links ]
POMEROL JC and BARBA-ROMERO S (2000) Multicriterion Decision in Management: Principles and Practice. Kluwer Academic Publishers, USA. [ Links ]
QIN XS, HUANG GH, CHAKMA A, NIE XH and LIN QG (2008) A MCDM-based expert system for climate change impact assessment and adaptation planning - A case study for the Georgia Basin, Canada. Expert Syst. Appl. 34 2164-2179. [ Links ]
QURESHI ME and HARRISON SR (2001) A decision support process to compare riparian revegetation options in Scheu Creek catchment in North Queensland. J. Environ. Manage. 62 101-112. [ Links ]
RAJU KS, DUCKSTEIN L and ARONDEL C (2000) Multicriterion analysis for sustainable water resources planning: a case study in Spain. Water Resour. Manage. 14 435-456. [ Links ]
SAATY TL (1980) Analytic Hierarchy Process. McGraw-Hill, New York. [ Links ]
SAATY TL and VARGAS L (1984) Comparison of eigenvalue, logarithmic least-squares and least-squares methods in estimating ratios. Math. Model. 5 309-324. [ Links ]
SHANNON CE AND WEAVER W (1947) The Mathematical Theory of Communication. The University of Illinois Press, Urbana. [ Links ]
SMART (2005) Regional Case Study: Gediz River Basin, Turkey, Sustainable Management of Scarce Resources in the Coastal Zone (SMART). Supported by the European Commission FP5 Programme (Contract number: ICA3-CT- 2002), 2002-2005. Project document: Deliverable D05.1. URL: http://www.ess.co.at/SMART (Accessed 29 April 2008). [ Links ]
SRDJEVIC B, MEDEIROS YDP and FARIA AS (2004) An objective multi-criteria evaluation of water management scenarios. Water Resour. Manage. 18 35-54. [ Links ]
STOCKHOLM ENVIRONMENT INSTITUTE (SEI) (2007) WEAP Water Evaluation and Planning System. (User Guide for WEAP21). Stockholm Environmental Institute, U.S. Center. URL: http://www.weap21.org (Accessed 10 September 2008). [ Links ]
SUMER (2006) Final report for studies on modeling for climate change effects in the Gediz and Buyuk Menderes River Basins. Dokuz Eylul University, Izmir. Water Resources Management Research and Application Center (SUMER). [ Links ]
SVENDSEN M, MURRAY-RUST DH, HARMANCIOGLU NB and ALPASLAN N (2005) Governing Closing Basins: the Case of the Gediz River in Turkey. In Svendsen M (eds.) Irrigation and River Basin Management Options For Governance and Institutions. CABI Publishing, UK. [ Links ]
TIWARI DN, LOOF R and PAUDYAL GN (1999) Environmental-economic decision-making in lowland irrigated agriculture using multi-criteria analysis techniques. Agric. Syst. 60 99-112. [ Links ]
TKACH RJ and SIMONOVIC SP (1997) A new approach to multi-criteria decision making in water resources. J. Geogr. Information and Decision Analysis 1 25-43. [ Links ]
TRIANTAPHYLLOU E (2000) Multi-Criteria Decision Methods: A Comparative Study. Parlos P (eds.) Kluwer Academic Publishers, Dordrect. [ Links ]
VARIS O, KAJANDER T and LEMMELA R (2004) Climate and water: from climate models to water resources management and vice versa. Clim. Change 66 (3) 321-344. [ Links ]
ZARGHAMI M, ABRISHAMCHI A and ARDAKANIAN R (2008) Making Multi-criteria decision making for integrated urban management. Water Resour. Manage. 22 1017-1029. [ Links ]
ZELENY M (1982) Multiple Criteria Decision Making. McGraw-Hill, New York. [ Links ]
Received 4 January 2010; accepted in revised form 3 September 2010.
* To whom all correspondence should be addressed. +90 236 312 9325; fax: +90 236 312 9567; e-mail: baris.yilmaz@bayar.edu.tr

