


Services on Demand
Article
 English (pdf)
 Article in xml format
 Article references
Indicators

Related links
-
 Cited by Google
 -
 Similars in Google
Share

 Permalink
Water SA
On-line version ISSN 1816-7950
Print version ISSN 0378-4738
Water SA vol.36 n.5 Pretoria Oct. 2010
Estimating the recreational value of freshwater inflows into the Klein and Kwelera estuaries: an application of the zonal travel cost method
M du Preez*; SG Hosking
Department of Economics, PO Box 77000, Nelson Mandela Metropolitan University, Port Elizabeth, 6031, South Africa
ABSTRACT
This study estimates the change in aggregate consumer surplus associated with increased freshwater supply into two South African estuaries, namely, the Klein and the Kwelera. The estimation entailed the application of a contingent behaviour, single-site Clawson-Knetsch travel cost model. The value estimates derived reflect the benefit of improved freshwater supplies into the estuaries in question over the status quo. In a survey, a questionnaire was administered face-to-face to 240 households at the Klein Estuary and 231 households at the Kwelera Estuary during the period between December 2005 and April 2006. It was deduced that in 2006 the marginal recreational value of freshwater inflow into the Klein Estuary was 5.7 cents/m3 (ZAR0.057/m3) and into the Kwelera Estuary 1.1 cents/m3 (ZAR0.011/m3).
Keywords: estuary, water abstraction, revealed preference, single-site, travel cost method, freshwater inflows
Introduction
Although they form only a small part of the aquatic environment, estuaries play a significant part in the functioning of the aquatic environment through the provision of transitional links between the marine environment and rivers (Wooldridge, 2000; Lamberth and Turpie, 2003). Estuaries also play an important role in the life history and development of various marine organisms. In the absence of estuarine systems, commercial and recreational fishing would be altered significantly. Apart from providing nursery areas for marine fish species, properties of and processes occurring in and around estuaries also generate other goods and services. Plant fibres and bait organisms are goods provided by estuaries. Estuary processes also provide the following services: waste treatment, erosion control, and floodwater control (Wooldridge, 2000).
However, estuarine ecological systems are increasingly affected by human interference. Some systems have been dredged or filled and transformed into seaports, marinas and garbage dumps, with disastrous consequences (Wooldridge, 2000; Cooper et al., 2003; Turpie et al., 2005). In South Africa, the functioning of estuaries is threatened by decreasing freshwater inflows due to alien tree and plant invasions in catchment areas and along river courses, and human abstraction and storage for consumption by industrial, domestic and agricultural users. As a result of reduced freshwater inflows, South African estuaries are yielding fewer services (Whitfield and Wooldridge, 1994; Lamberth and Turpie, 2003), for instance, smaller areas available for recreational boating and losses of habitat for species of fish, birds and vegetation.
The goods and services, including those used for recreational purposes, provided by estuaries are not directly traded in markets (Lamberth and Turpie, 2003; Turpie et al., 2005). In addition, these goods and services exhibit public good characteristics. More specifically, actual payments are not generally needed to enter or use the goods and services provided by estuaries, and thus no demand curve can be created from quantity and price information. Furthermore, there is not rivalry with respect to some of the estuary's goods and services, in the sense that one person's use diminishes that available to another. Despite the absence of a direct market for, and the public good nature of, estuarine goods and services, they do have value, and the appropriate formulation and execution of policy to deal with estuarine water inflow requirements and regulation is advantaged by knowing this value. For this reason it is useful to estimate the economic value of this water. One way of doing this is by estimating the recreational value of estuarine goods and services linked to this water by means of nonmarket valuation techniques.
The objective of this paper is to estimate the economic value of freshwater inflows into two South African estuaries, the Klein and the Kwelera, by means of the single-site Clawson-Knetsch travel cost method applied to a contingent behaviour (hypothetical choice). The purpose of this valuation is to generate information that can contribute (along with other information) to guiding the management of these inflows toward efficient levels.
The remainder of the paper is organised as follows: The following section provides a description of the study areas. This is followed by a discussion of the anthropogenic impacts of increased water abstraction on estuarine services. The methodology section is followed by a description of the sample design process, results and discussion. The paper concludes with a summary and discussion of policy implications.
Study sites
Klein Estuary
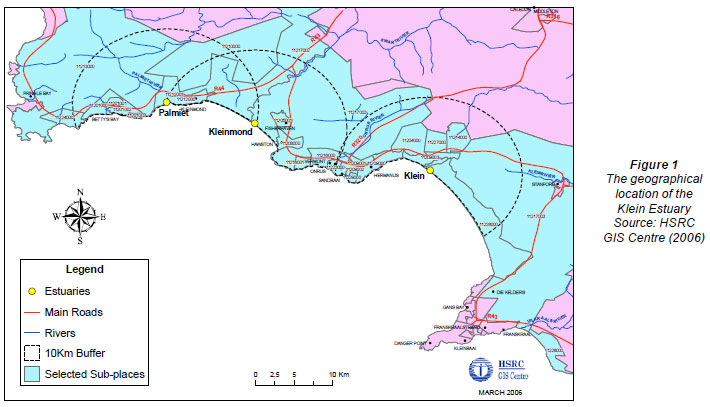
The Klein Estuary is situated between Stanford and Hermanus on the south-western coastline of the Western Cape (Fig. 1).
The Klein River system is 65.8 km long with a catchment area of 906 km2 (NRIO, 1987). At its mouth, the river forms a large estuarine lake, which is approximately 2 km in breadth and 10 km in length (De Decker, 1989). The mouth is not permanently open. Historically, it has opened once a year for 3 to 5 months (Day, 1981). The estuary has a mean annual runoff of 40 x 106 m3 (DWAF, 2003). Overall, the condition of the estuary is considered good (Whitfield, 2000). Farming takes place in the catchment area and on the floodplain. About 40% of the area is used for wheat farming and about 30% is used for irrigated crops (De Decker, 1989). Privately owned land, including a yacht club, dominates the northern shoreline of the estuary.
The ecological importance of the Klein Estuary was estimated by Turpie et al. (2004), by means of assigning rank values (out of a 100) to 5 criteria - the results are shown in Table 1.
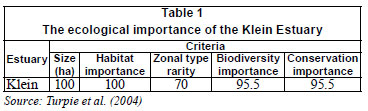
The average rating of the importance of the Klein Estuary was 92.2, making it the 9th most important estuary in South Africa (Turpie et al., 2004).
Kwelera Estuary
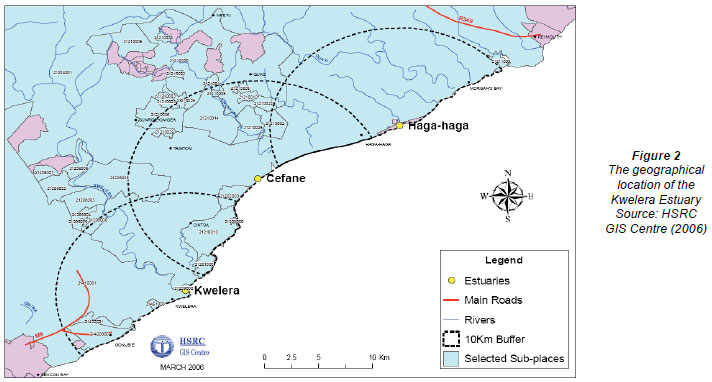
The Kwelera Estuary is situated close to the town of East London in the Eastern Cape (Fig. 2).
The catchment area of the Kwelera River system is approximately 391 km2 in size (Reddering and Esterhuysen, 1987). The mean annual runoff for the estuary is 42 x 106 m3 (DWAF, 2003). The estuary is permanently open and has a tidal inlet, which is 20 m wide and 2 to 3 m deep during high tide conditions. A natural rapid approximately 4.9 km from the tidal inlet forms the tidal head of this estuary. The condition of the estuary is considered fair (Whitfield, 2000). Privately-owned land dominates the shoreline of the estuary and is not easily accessible to the public. There are a number of resorts located along the estuary banks. The estuary is viewed as an important environmental asset and recreational facility (Whitfield, 2000).
As with the Klein Estuary above, an importance rating was also estimated for the Kwelera Estuary. The results are shown in Table 2.
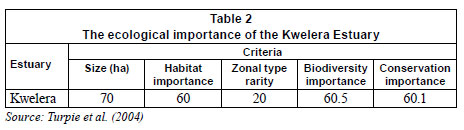
The average rating of the importance of the Kwelera Estuary was 54.12, making it the 86t h most important estuary in South Africa (out of 256, Turpie et al., 2004).
The anthropogenic impacts of increased upstream water abstraction on estuarine services - Klein and Kwelera Estuaries
Estuarine biodiversity changes in response to shifts in freshwater flow patterns. River flow also influences mouth condition (along a continuum of an open to fully closed mouth). The degree of freshwater abstraction, therefore, influences the estuary in various ways that ultimately influence the estuarine biota. The predicted anthropogenic impacts of selected changes in freshwater inflow for the 2 estuaries under consideration (Klein and Kwelera) are summarised in Table 3. These predictions were made by a team of scientific experts from DWAF, and the Department of Zoology at Nelson Mandela Metropolitan University, and other independent scientists from South Africa.
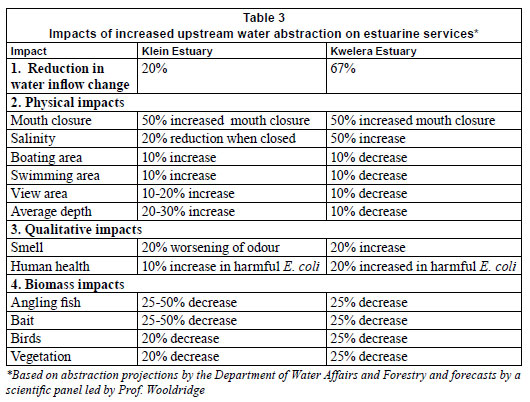
It was predicted that for both the Klein and Kwelera Estuaries, time of mouth closure would increase by 50% due to upstream water abstraction. In the case of the Klein Estuary, the water volume needed to breach the sandbar naturally is marginally less than the mean annual runoff. Any reduction in freshwater inflow will lead to a situation where the mouth only opens once every 2 years.
In terms of salinity levels, a 20% reduction was predicted for the Klein Estuary coupled with longer periods of lower salinity levels (15 mg/g). For the Kwelera Estuary a 50% increase in salinity was predicted due to the loss of the salinity gradient. Hypersaline conditions are more than likely to occur in the whole estuary as it is already marine dominated and evaporation will increase the salinity level.
It was predicted that both the boating and swimming areas available at the Klein Estuary would increase by 10%, whereas the area available in the Kwelera Estuary would decrease by 10% due to evaporation. The view of water surface area of the Klein Estuary was predicted to improve by 10 to 20% due to a longer period of mouth closure, whereas that of the Kwelera Estuary was predicted to decrease by 10% due to evaporation. The average depth of the Klein Estuary was predicted to increase by 20 to 30% in comparison to the Kwelera Estuary, where it was predicted that the average depth would decrease by 10% due to evaporation.
Qualitative changes due to freshwater abstraction were defined in terms of smell and human health impacts. For the Klein Estuary, it was predicted that unpleasant smells in its vicinity would increase by 20% due to decaying vegetation as a result of prolonged submersion, especially at the edges. The negative impact on human health was predicted to increase by 10% for the Klein Estuary due to prolonged mouth closure and the potential contamination from septic tanks. For the Kwelera Estuary, a 20% increase in unpleasant smells due to concentration of stormwater runoff in the estuary from upstream settlement was predicted, and a 20% increase in risk to human health.
Biomass impacts due to freshwater abstraction were confined to those affecting angling fish, bait organisms, birds, and vegetation. In the case of the Klein Estuary, it was predicted that angling fish availability would decrease by between 25 and 50% due to the lack of recruitment and low salinities during the year of closure. A loss of between 25 and 50% of bait organisms was predicted due to unsuitably low salinities for reproduction. A 20% loss of waders during periods of mouth closure was also predicted. Finally, a 20% decrease in fringing vegetation due to higher water levels was predicted.
For the Kwelera Estuary, it was predicted that a 25% loss of angling fish, bait organisms, birds and estuarine vegetation would occur due to increased mouth closure and hypersaline conditions.
Methodology
Non-market valuation methods can be broken up into those that rely on revealed preference and those that rely on stated preference. The revealed preference models are built upon the premise that it is possible to infer people's preferences for ecosystem services and estimate demand curves by observing their actual behaviour (Hanley and Spash, 1993). The stated preference models use surveys to elicit consumer preferences directly. Two stated preference techniques that are often used are the contingent valuation and conjoint analysis methods.
One of the most popular revealed preference techniques, and the one that is applied in this paper, is the travel cost method (TCM). Hotelling (1931) first proposed the use of the travel cost method to impute values for recreational sites in the United States of America. Clawson (1959) and Clawson and Knetsch (1966) further refined the approach in subsequent years. The theory underlying the economic rationale for employing the travel cost method is couched in neoclassical economic theory of demand modelling. A recreation site is valued by determining the travel costs that individuals incur when visiting the site in question. Travel costs (TRC) for a given recreational site, j, are the sum of the following:

where:
DC = distance costs for each individual i
TC = time costs
AF = admissions fee to site j (Perman et al., 1996).
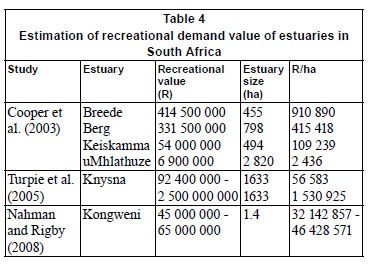
Many travel cost studies have been conducted in the United States and elsewhere to value recreational sites (Caulkins et al., 1986; Kling, 1987; Liston-Heyes and Heyes, 1999; Bowker et al.,1996; Fix and Loomis, 1997; Bin et al., 2005; Martinez-Espineira and Amoako-Tuffour, 2008). The use of the TCM to derive values for coastal resources is, however, uncommon in South Africa. Only 3 previously published studies could be identified that applied the TCM to derive recreational values for South African estuaries. The results of these studies are provided in Table 4. All monetary values reported in this paper are in South African Rands (ZAR), hereafter simply denoted as Rands (R).
The 2 most prominent single-site TCMs employed are the Clawson-Knetsch method (also known as the zonal approach) and the individual method. In both methods a trip generating function (TGF) is estimated, from which a demand curve is calculated. Total economic value attached to a recreation site is obtained by measuring the area under the demand curve.
The Clawson-Knetsch method is relatively easy to carry out because the data requirement is small. The method employs mostly secondary data. Data is collected pertaining to the quantity of visits to the recreation site from diverse distances (Hanley and Spash, 1993). The individual method, on the other hand, requires the execution of an extensive on-site questionnaire survey, as well as the specification and interpretation of a more complex TGF.
Single-site TCM models are not often used to value quality changes at recreational sites because the limited time frames of most studies do not allow for sufficient quality changes over time at the sites in question (Parsons, 2003). However, a number of attempts have been made to value quality changes at recreational sites within a single-site TCM framework - these TCM models are known as contingent behaviour models (Parsons, 2003). These studies introduced a variable for quality change (Englin and Cameron, 1996; Loomis, 1997; Turpie and Joubert, 2001; Hanley et al., 2003). More specifically, these studies used once-off data related to actual and hypothetical trips to a recreation site and actual and hypothetical quality scenarios. A demand function shift is created based on people's stated trips contingent upon a hypothetical change in quality at the recreation site. The consumer surplus due to the quality change was calculated as the area between the 2 demand functions (the demand function associated with the actual quality level and the demand function associated with the hypothetical quality level). In this paper, a contingent behaviour, single-site Clawson-Knetsch (zonal) TCM is applied to determine the consumer surplus associated with an improvement in freshwater inflows (and thus improved recreation services) into 2 South African estuaries, the Klein and the Kwelera.
The application of the Clawson-Knetsch (zonal) method entails 7 distinct steps. The zones of visitor origin surrounding the recreation site are defined. The data are gathered pertaining to the amount of visitors per zone, as well as the number of visits per zone made in the last year (Hanley and Spash, 1993). The visitation rates per 1 000 population per zone are estimated, i.e. total visits per annum per zone divided by the zone's population in thousands. The mean round-trip travel distance per zone to the recreation site is determined. This travel distance estimate is multiplied by the mean cost per kilometer to arrive at a travel cost per trip estimate (Fix and Loomis, 1997). A time cost associated with travel may also be added to the travel cost estimate at this stage. A TGF is estimated which relates visits per person to travel costs. A demand curve is traced out by simulating what would happen to visits from each zone as the admissions fee (the admissions fee is a proxy of actual price) is increased (Hanley and Spash, 1993). These fee/visit combinations represent predictions based on the observed correlation between the visits and travel costs. The typical finding is that as the travel costs rise, the number of visits fall (Fix and Loomis, 1997; Bin et al., 2005). The admissions fee is raised until visits decrease to zero. Finally, the area under the demand curve is measured. This measure yields an estimate of the total per annum value attached to the recreation site by visitors, all other things remaining constant (Perman et al., 1996; Clawson and Knetsch, 1966).
Sample design
The process of identifying the user population for an estuary is laden with difficulty. The population comprises 2 groups of users - visitors (tourists) and residents - but these groups are mixed into larger resident populations in ways that make it virtually impossible to identify all their elements, ex ante. The population of users was identified in terms of the number of households that located themselves within a 200 km radius of the site in question. The number of individuals that make up the user population was identified using GIS data as well as informed sources via consultation with local conservation authorities. The average household size obtained from GIS data extracted from the 2001 Census was 4 persons. The total user populations and estimated number of households for the Klein and Kwelera Estuaries are shown in Table 5.

Sample selection was endogenously stratified in this study, that is, based on who was present at the estuary during the period when the survey was administered and reflective of the dispersion of those members of the population present. Sample sizes selected for the purposes of this study were benchmarked against those obtained by applying Cochrane's (1977) 2-stage sample size determining theory with respect to random sampling with continuous data. Cochrane (1977) distinguishes sample size requirements by the nature of the random variables for which data is being collected, the expected response rate, the t value for the selected alpha level in each tail of the relevant probability distribution, the estimated variance and the acceptable margin of error for the proportion of the variable being estimated. The formulae for sample size are derived from that for the t statistic value for a single sample:

When Eq. (2) is reformulated as a function on the sample size (n) and d is substituted for the difference (sample mean - population mean), it becomes one of Eqs. (3) or (4):


and
where:
n0 = required sample size adjusted for non-responses.
n1 = required valid returned sample size.
d = the acceptable margin of error for the proportion being estimated (0.05).
s2= variance about the mean.
a = response rate.
The sample size adopted at the Klein Estuary is just less than the minimum sample size desired in terms of the Cochrane (1977) formulae, while at the Kwelera Estuary the sample size was more than double that required (see Table 6).

The questionnaire was administered face-to-face to 240 respondents at the Klein Estuary and 231 at the Kwelera Estuary, during the period between December 2005 and April 2006. This time of year was chosen to obtain a suitable mix of visitors and permanent resident users.
Results
Characteristics of respondents
Table 7 shows the socio-economic profiles of the respondents at the Klein and Kwelera Estuaries.
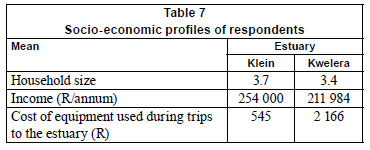
The mean household size of respondents for the Klein and Kwelera Estuaries, respectively, was 3.7 and 3.4. The average income level of respondents for the Klein and Kwelera Estuaries respectively, was R254 000 and R211 984. The average cost of equipment used by the respondent's household while spending time at the estuaries for the Klein and Kwelera Estuaries respectively, was R545 and R2 166.
The majority (81º%) of respondents interviewed at the Klein Estuary were White. Just over half (53%) of the respondents interviewed were male and almost two-thirds (57%) of the respondents were permanent residents. On average, this estuary was used for 1 week per year. This category of user comprised approximately 23% of the total. Individuals who use the estuary for 2 weeks per year accounted for 18% of the total. Almost 16% of the respondents use the estuary throughout the year (permanent residents).
The vast majority (97%) of respondents interviewed at the Kwelera Estuary were White. Almost two-thirds (57%) of the respondents interviewed were male and approximately half (51%) of the respondents were visitors. Almost 34% of the respondents used the estuary throughout the year (permanent residents). Individuals who used the estuary for 1 week per year accounted for 32% of the total. Approximately 5% of the respondents used the estuary for 2 weeks per year.
Estimation of contingent behaviour, single-site Clawson-Knetsch TCMs
As mentioned above, the Clawson-Knetsch (zonal) TCM was applied in order to estimate the change in total consumer surplus associated with an increase in freshwater supply into the Klein and Kwelera estuaries. In order to determine the change in aggregate consumer surplus, 2 demand curves were derived for each estuary -one without the improvement (increase) in freshwater supply (the base case) and one with the improvement (increase) in freshwater supply. The consumer surplus under each of the abovementioned demand curves was then calculated. The difference between the 2 consumer surpluses was deemed the change in consumer surplus due to increased freshwater inflow. A detailed description of the steps applied in this study is outlined below.
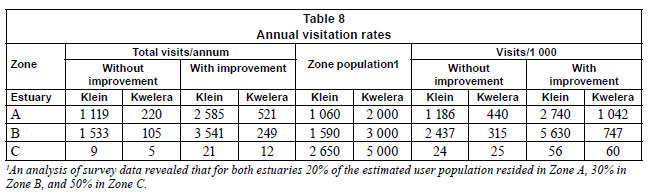
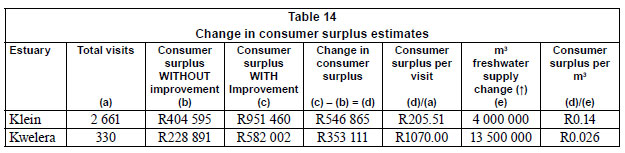
The set of zones around the estuaries were defined. In both estuary cases, 3 zones were identified (A, B and C). The roundtrip distance for Zone A was identified as being 1 to 10 km, Zone B 11 to 60 km, and Zone C 61 km and further. Information was collected on the population size of each zone and the number of visits conducted (without improvement) from each zone in the year leading up to the survey. Respondents were also asked how many times per year they would visit the estuaries if a positive (increase) change in freshwater inflow into the estuaries was secured. The increased freshwater supply for the Klein and Kwelera Estuaries, respectively, amounted to 4 million m3 and 13.5 million m3. The fact that the scenario was linked to a specific volume change in freshwater inflow made it possible for the 'per m3' value of this water to be estimated. In the case of the Klein Estuary, it was estimated that, on average, respondents would visit the estuary 2.31 times more often, and in the case of the Kwelera Estuary, they would visit the estuary 2.37 times more often. The visitation rate (with and without the freshwater inflow improvement) per 1 000 of the population of each zone was determined by dividing the total number of visits from each zone by its population in thousands. The results of applying the first 3 steps are shown in Table 8.
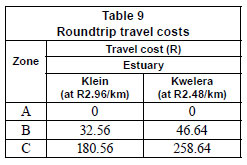
The roundtrip travel costs per zone were calculated for each estuary. The travel costs were determined by zone using the Automobile Association (AA) of South Africa's rates for motor vehicles. The majority of vehicles used by survey respondents had petrol engines with a capacity of between 2 500 and 3 000 cm3. The average survey respondent travelled approximately 20 000 km/year. The average petrol price in 2006 was used in this study and amounted to R6.06/ . The estimated roundtrip travel costs per zone for the Klein and Kwelera Estuaries are shown in Table 9.
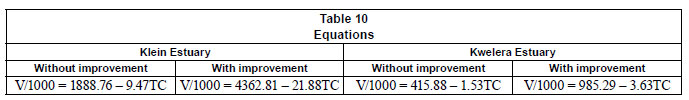
Two equations - one without improvement and one with improvement - were estimated for each estuary, which relates visits per 1 000 population to travel costs using regression analysis. The equations are displayed in Table 10.
Demand functions (without and with improvement) were determined for visits to the estuaries using the regression equations estimated in the step above. Points on the demand curves were obtained by calculating the number of visitors with varying entrance fees. The entrance fee is viewed here as a proxy for travel cost. For both estuaries an initial entrance fee of R50 was substituted into the 'without and with' equations shown in Table 10. This procedure produced the results shown in Table 11 for the estuaries without improvement.

Two more points on the 'without and with' demand curves for both estuaries were calculated in the same way, by increasing the entrance fee to R100 and R150, respectively see Table 12.

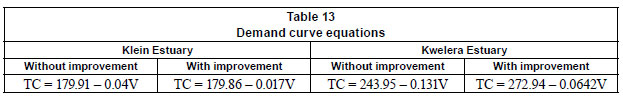
By using these estimated demand curve points, demand curve equations, both without and with improvement, were estimated for each estuary. The 'without and with' demand curve equations for the estuaries are shown in Table 13.
The total consumer surplus of the estuaries to visitors, without and with improvement, was calculated by determining the area under the demand curves traced out in the step above (see Table 13). The results for the Klein and Kwelera Estuaries are provided in Table 14.
Multipurpose trips
The travel cost method follows a custom whereby meanderers are distinguished from purposeful visitors (Hanley and Spash, 1993). The former refers to individuals for whom the site visit is only part of the reason for their trip, whereas the latter refers to those individuals for whom a site visit is the only reason for their trip. The existence of meanderers give rise to the question: what percentage of their travel costs may be apportioned to their visit to the site in question? In many cases the meanderer problem is simply ignored by either omitting multi-destination or multi-purpose trips from the analysis or employing aggregate travel cost without adjustment to cater for the existence of meanderers.
Studies by Loomis et al. (2000) and Mendelsohn et al. (1992) show that the omission of meanderers from the travel cost model may lead to an underestimation of recreational value by 50% or more (the omission influences the shape of the demand curve and, thus, the estimate of consumer surplus). The omission may also lead to a decreased sample size -which is a problem in the case of the zonal method as it may be onerous to locate enough purposeful (single destination) visitors from far-off zones, but not so much in the case of the individual method (where much more information is usually gathered).
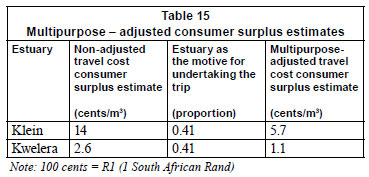
A solution to the meanderer or multi-destination problem is to ask respondents to rate the importance they attach to a site visit, relative to their satisfaction with the entire trip or other destinations visited, and this rating, expressed as a number between one and zero, can be used to weight their total travel cost (Hanley and Spash, 1993). This approach was also adopted in this study. Only 15% of the respondents were single-site visitors. It was found that, on average, the Klein and Kwelera Estuaries constituted just over 40% of the reason for the trip made to the location of the estuary. The conversion of travel cost and consumer surplus estimates is done in Table 15.
Discussion
The marginal value of increased freshwater inflows into the Klein and Kwelera Estuaries, respectively, were estimated in 2006 to be 5.7 and 1.1 cents per m3 (see Table 15; 100 cents = R1). The results obtained were consistent with a priori expectation. It was expected that an estuary that was permanently open and receiving 3 times the change in volume of water (the Kwelera) would have a lower value per m3 than an estuary (the Klein) that was temporarily open, due to it being less prone to negative impacts from changes in freshwater inflow.
To the authors' knowledge, this study is the first in South Africa which applied the contingent behaviour, single-site Clawson-Knetsch TCM to value freshwater inflows into estuaries at the margin. The findings of this paper can, however, be compared with those in Hosking's (2010) study. Hosking et al. (2008) undertook a valuation of the freshwater inflows into the Klein and Kwelera Estuaries by applying the contingent valuation method. According to this study, the estimated median willingness to pay, per m3 of freshwater inflow, for the Klein and Kwelera Estuaries, respectively, was 5.46 and 0.48 cents. The differences between the results of applying the Clawson-Knetsch TCM and the contingent valuation model at the 2 estuaries are not substantial. The 2 methods yielded results which could be said to converge, in the sense that the difference in estimates is less than 0.7 cents or the ratio of the willingness to pay value/travel cost value is between 40 and 95%.
Conclusion
If it is efficiency one is pursuing, it is both theoretically and practically sensible to allocate South Africa's river water with reference to its value at different points along the river. Two estimates of the marginal value of river flows into the Klein and Kwelera Estuaries were derived in this study on the basis of estuary trips and associated travel costs. The average value per m3 of river flow into the Klein and Kwelera Estuaries, respectively, was 5.7 and 1.1 cents per m3. The marginal values estimated in this paper were compared to those derived in a contingent valuation study by Hosking et al. (2008). The differences between the results of applying the Clawson-Knetsch TCM and the contingent valuation model at the 2 estuaries are not substantial. The 2 methods yielded results which could be said to converge, in the sense that the difference in estimates is less than 0.7 cents or the ratio of the WTP value/travel cost value is between 40 and 95%.
The values found for river water inflows into the Klein and Kwelera are low when compared to the tariffs paid by urban users of water services. These tariffs (for potable water delivered and wastewater received) frequently are in excess of R10/m3. However, this is not a sensible comparison to make. The values of water reported in this paper relate to water in situ, as it lies in the river, with no production effort incorporated. A more sensible value to compare these values to is the tariff paid by farmers for the rights to abstract water from rivers, and these values are frequently a couple of cents per cubic metre.
Alternative (opportunity cost) values were not estimated as part of this study for the river water flowing into the Klein and Kwelera estuaries. For this reason, no conclusion could be drawn in this paper on the specific issue of whether more or less water should be allocated to the Klein and Kwelera estuaries. To provide guidance on this issue, the values found in this paper would have to be compared to the per annum user opportunity costs of inflows into estuaries. Clearly, a fruitful avenue for further research is to ascertain the annual user opportunity costs of river inflows into these 2 estuaries, so that this comparison can be made.
Acknowledgements
The guidance of the reference group for WRC Project K5/1413, managed by Dr Steve Mitchell and Dr Gerhard Backeberg, and funding from the Water Research Commission are gratefully acknowledged, as are the contributions of many NMMU students, particularly Johanne Dikgang (now at UCT).
References
BIN O, LANDRY CE, ELLIS C and VOGELSONG H (2005) Some consumer surplus estimates for North Carolina beaches. Mar. Resour. Econ. 20 (2) 145-161. [ Links ]
BOWKER JM, ENGLISH DBK and DONOVAN JA (1996) Toward a value for guided rafting on southern rivers. J. Agric. Appl. Econ. 28 (2) 423-432. [ Links ]
CAULKINS PP, BISHOP RC and BOUWES NW (1986) The travel cost model for lake recreation: a comparison of two methods for incorporating site quality and substitution effects. Am. J. Agric. Econ. 68 291-297. [ Links ]
CLAWSON M (1959) Methods for measuring the demand for and value of outdoor recreation. Reprint No. 10, Resources for the Future. Washington, DC. [ Links ]
CLAWSON M and KNETSCH J (1966) Economics of Outdoor Recreation. Johns Hopkins University Press, Baltimore. [ Links ]
COCHRANE WG (1977) Sampling Techniques (3rd edn.). Wiley, New York. [ Links ]
COOPER J, JAYIYA T, VAN NIEKERK L, DE WIT M, LEANER J and MOSHE D (2003) An assessment of the economic values of different uses of estuaries in South Africa. CSIR Report No. ENV-S-C 2003-139. CSIR, Stellenbosch, South Africa. [ Links ]
DAY JH (1981) Estuarine Ecology with Particular Reference to Southern Africa. AA Balkema, Cape Town. [ Links ]
DE DECKER HP (1989) Klein (CSW16) Report 40 of the Estuaries of the Cape. Part 2: Synopses of available information on individual systems. CSIR Research Report 439. CSIR, Stellenbosch. [ Links ]
DU PREEZ M (2002) Evaluating the environmental use of water - selected case studies in the Eastern and Southern Cape. PhD Thesis, University of Port Elizabeth, Port Elizabeth. [ Links ]
DWAF (DEPARTMENT OF WATER AFFAIRS AND FORESTRY, SOUTH AFRICA) (2003) Overview of water resources availability and utilization: reports and presentations for all water management areas. Department of Water Affairs and Forestry, Pretoria. [ Links ]
ENGLIN J and CAMERON TA (1996) Augmenting travel cost models with contingent behaviour data. Environ. Resour. Econ. 7 (2) 133 -147. [ Links ]
FIX O and LOOMIS J (1997) The economic benefits of mountain biking at one of its meccas: An application of the travel cost method to mountain biking in Moab, Utah. J. Leisure Res. 29 (3) 342-352. [ Links ]
HANLEY N and SPASH CL (1993) Cost-benefit Analysis and the Environment. Edward Elgar, United Kingdom. [ Links ]
HANLEY N, BELL D and ALVAREZ-FARIZO B (2003) Valuing the benefits of coastal water quality improvements using contingent and real behaviour. Environ. Resour. Econ. 24 (3) 273-285. [ Links ]
HOSKING SG and DU PREEZ M (2004) A recreational valuation of the freshwater inflows into the Keurbooms Estuary by means of a contingent valuation study. S. Afr. J. Econ. Manage. Sci. 7 (2) 280-298. [ Links ]
HOSKING SG (2010) The valuation of estuary services in South Africa specifically regarding changes to estuary services as a result of reductions to fresh water inflows. WRC Report No. 1413-1-10. Water Research Commission, Pretoria. [ Links ]
HOTELLING H (1931) The economics of exhaustible resources. J. Polit. Econ. 39 137-175. [ Links ]
KLING CL (1987) A simulation approach to comparing multiple site recreation demand models using Chesapeake Bay survey data. Mar. Resour. Econ. 4 95-109. [ Links ]
HSRC GIS Centre (2006) Estuaries March06 Map Rivers.pdf. URL: http://www.hsrc.ac.za/ (Accessed 15 March 2006). [ Links ]
LAMBERTH S and TURPIE JK (2003) The role of estuaries in South African fisheries: economic importance and management implications. Afr. J Mar. Sci. 25 (1) 131-157. [ Links ]
LISTON-HEYES C and HEYES A (1999) Recreational benefits from the Dartmoor National Park. J. Environ. Manage. 55 (2) 69-80. [ Links ]
LOOMIS JB (1997) Panel estimators to combine revealed and stated preference dichotomous choice data. J. Agric. Resour. Econ. 22 (2) 233-245. [ Links ]
LOOMIS JB, YORIZANE S and LARSON D (2000) Testing significance of multi-destination and multi-purpose trips effects in a travel cost method demand model for whale watching trips. Agric. Resour. Econ. Rev. 29 183-191. [ Links ]
MARTINEZ-ESPINEIRA R and AMOAKO-TUFFOUR J (2008) Recreation demand analysis under truncation, overdispersion, and endogenous stratification: An application to Gros Morne National Park. J. Environ. Manage. 88 (4) 1320-1332. [ Links ]
MENDELSOHN R, HOF J, PETERSON G and JOHNSON R (1992) Measuring recreation values with multiple destination trips. Am. J. Agric. Econ. 74 926-933. [ Links ]
NRIO (1987) Basic physical geography/hydro data for estuaries of the southwestern Cape (CSW 1-26). NRIO Data Report D 8705. CSIR, Stellenbosch. [ Links ]
PARSONS GR (2003) The travel cost model. In: Champ PA, Boyle KJ and Brown TC (eds.) A Primer on Nonmarket Valuation. Kluwer, Boston. [ Links ]
PERMAN R, MA Y and McGILVRAY J (1996) Natural Resource and Environmental Economics. Longman, New York. [ Links ]
REDDERING JSV and ESTERHUYSEN K (1987) Sediment dispersal in the Knysna Estuary: environment management considerations. S. Afr. J. Geol. 90 448-457. [ Links ]
TURPIE JK and JOUBERT A (2001) Estimating the potential impacts of a change in river quality on the tourism value of the Kruger National Park: an application of travel cost, contingent and conjoint valuation methods. Water SA 27 (3) 387-398. [ Links ]
TURPIE JK, CLARK B, KNOX D, MARTIN P, PEMBERTON C and SAVY C (2004) Improving the Biodiversity Rating of South African Estuaries. Vol. 1. Contributions to Information Requirements for the Implementation of Resource Directed Measures for Estuaries. WRC Report No. 1247/1/04. Water Research Commission, Pretoria. [ Links ]
TURPIE JK, CLARK B, NAPIER V, SAVY C and JOUBERT A (2005) The economic value of the Knysna Estuary, South Africa. Marine and Coastal Management, Department of Environmental Affairs and Tourism, Cape Town, South Africa. [ Links ]
WHITFIELD AK and WOOLDRIDGE TH (1994) Changes to Freshwater Supplies to Southern African Estuaries: Some Theoretical and Practical Considerations. Olsen and Olsen, Fredensborg. [ Links ]
WHITFIELD AK (2000) Available scientific information on individual South African estuarine systems. WRC Report No. 577/3/00. Water Research Commission, Pretoria. [ Links ]
WOOLDRIDGE TH (2000) Ecology of the Keurbooms and Bitou Estuaries. Unpublished Report. Department of Zoology, University of Port Elizabeth, Port Elizabeth. [ Links ]
Received 14 December 2009; accepted in revised form 5 October 2010.
* To whom all correspondence should be addressed. +2741 504 2795; fax: +2741 583 2644; e-mail: Mario.dupreez@nmmu.ac.za

