


Services on Demand
Article
 English (pdf)
 Article in xml format
 Article references
Indicators

Related links
-
 Cited by Google
 -
 Similars in Google
Share

 Permalink
Water SA
On-line version ISSN 1816-7950
Print version ISSN 0378-4738
Water SA vol.36 n.5 Pretoria Oct. 2010
Soil as indicator of hillslope hydrological behaviour in the Weatherley catchment, Eastern Cape, South Africa
JJ van TolI,*; PAL le RouxI; M HensleyI; SA LorentzII
IDepartment of Soil, Crop and Climate Sciences, University of the Free State, PO Box 339, Bloemfontein 9300, South Africa
IISchool of Bioresources Engineeering and Environmental Hydrology, University of KwaZulu-Natal, Box X01, Scottsville, 3209, South Africa
ABSTRACT
There is an interactive relationship between soil and hydrology. Identifying and interpreting soil properties active in this relationship can enhance our understanding of the hydrological behaviour of soils and the hillslopes in which they occur. This study was conducted in the Weatherley research catchment, South Africa, where a hillslope in the upper part of the catchment was selected for detailed study. Soil properties and their spatial distribution in the hillslope were interpreted and related to their predicted hydrological response. From these interpretations a conceptual model of hillslope hydrological behaviour was developed. Vertical drainage was considered to be dominant in the upper areas of the hillslope as indicated by the presence of freely-drained apedal soils. These soils recharge the mid- and lower slope. Soils showing clear indications of interflow (A/B and soil/bedrock interface) dominate on the midslope. The valley bottom is covered by gleyed soils which is an indication of long periods of saturation. These saturated conditions favour overland flow due to saturation impairing infiltration. The conceptual model was then evaluated using hydrometric measurements in the form of tensiometers and streamflow hydrographs. Results confirm the reliability of the model and accentuate the contribution that soil science can make to the science of hydrology.
Keywords: conceptual model, hillslope hydrology, hydropedology, soil properties
Introduction
The National Water Act (RSA, 1998) requires a clear understanding of key hydrological processes for effective water resource management. This understanding involves the identification, definition and quantification of the pathways, connectivity, thresholds and residence times of components of flow making up stream discharge. It is also essential that these aspects be efficiently captured in hydrological models for accurate water resource prediction, estimating the hydrologic sensitivity of the land to cultivation, contamination and development, and for quantifying low flow mechanisms (Lorentz et al., 2007).
Soils integrate the influences of parent material, topography, vegetation/land use, and climate and can therefore act as a first-order control on the partitioning of hydrological flow paths, residence time distributions and water storage (Schulze, 1995; Park et al., 2001; Sivapalan, 2003; Soulsby et al., 2006).
The relationship between soil and hydrology is interactive. Water is a primary agent in soil genesis, resulting in the formation of soil properties containing unique signatures of the way they formed. The formation of these properties exhibits a common form of organisation and symmetry where the distribution of soil properties associated with topography combines to form pedosequences or catenas. In these toposequences the network of preferred flowpaths in the soil and in the underlying material governs the hydrological processes. The hillslope forms the backbone of process hydrological studies and should form the basic building block for catchment models (Mosley, 1982; Sivapalan, 2003).
The incorporation of realistic residence time estimates into hydrological models leads to better predictions of hydrological processes (Asano et al., 2002; McGuire et al., 2005). Ideally these hydrological models could best be developed incorporating processes learned from measurements of the surface and subsurface lateral flow paths, water table fluctuations and the residence flow time of water through the landscape. Such measurements are, however, expensive and time-consuming, since these processes are dynamic in nature with strong temporal variation (Park and Van de Giesen, 2004; Ticehurst et al., 2007). The need for predictions of these processes is becoming increasingly important, especially predictions in ungauged basins (PUB). Ungauged basins are catchments with insufficient hydrological observations to allow for the computation of hydrological variables accurate enough for practical water resource management (Sivapalan et al., 2003).
There is a strong correlation between the relative importance of the various pathways and the residence time. The nature (length, topology and type) of the dominant pathways will determine the residence time of water and the extent of contribution to streamflow (Karvonen et al., 1999; Lin et al., 2006; Ticehurst et al., 2007). Soil characteristics determine the relative importance of the various pathways (Mosley, 1982), and therefore residence time distributions. Hydrologists agree that the spatial variety of soil properties significantly influences hydrological processes but they lack the skill to gather and interpret soil information (Lilly et al., 1998; Dunn and Lilly, 2001; Asano et al., 2002; Maréchal and Holman, 2005; Quinn et al., 2005; Chirico et al., 2006; Pachepsky, 2006; Ticehurst et al., 2007; Clothier et al., 2008; Severson et al., 2008; Soulsby and Tetzlaff, 2008; Vepraskas and Caldwell, 2008). Pedologists therefore have the opportunity to contribute valuable information to the science of hydrology by interpreting and relating soil properties to hydrological behaviour (Lin et al., 2006).
Theory development will advance if we can develop simple models which may be caricatures of the basin system, but, nevertheless, contain within them the basic properties of the actual basins (Sivapalan, 2003). The aim of this study is to identify and interpret soil properties in a selected hillslope and relate the properties to their hydrological response in order to develop a conceptual model of hillslope hydrological behaviour, and also to test the reliability of the model in relation to hydrological observations.
Materials and methods
Study area
The Weatherley research catchment is situated in the Eastern Cape, 4 km south-west of Maclear, South Africa. The catchment covers approximately 160 ha and is one of many small tributaries of the Mooi River. The highest point in the catchment occurs in the southwestern corner at 1 352 m a.m.s.l and the stream exits the catchment at 1 254 m. The geology consists of sandstone and mudstone of the Elliot Formation above 1 300 m a.m.s.l. (De Decker, 1981). Below this, sandstone and mudstone of the Molteno Formation predominates. The Molteno Formation forms a prominent 'shelf' around most of the catchment at an altitude of approximately 1 320 m, which has a dominating influence on the hydrology of the catchment, especially on the eastern and southern sides. Two small dolerite dykes with a north-south strike occur in the catchment. The mean annual precipitation (MAP) is approximately 1 000 mm year-1 (Van Huyssteen et al., 2005). The mean annual potential evaporation (MAE) is 1 488 mm (BEEH, 2003). The winters are cold, with mean minimum temperatures of 4ºC. Frost and snowfall is common, particularly in the higher-lying areas during the winter. The summers are warm with a mean maximum temperature of 25ºC (Roberts et al., 1996). The natural land cover consists of Highland Sourveld grasslands with a basal cover of 50-75% on the hillslopes. Eucalyptus nitens, Pinus elliottii and Pinus patula trees were planted in selected areas during 2002. Wetland conditions exist throughout the catchment along the stream, with a width of 100 to 400 m. The widest areas of this wetland are associated with seepage lines from contributing hillslopes (Lorentz et al., 2007).
A hillslope in an upper sub-catchment (Uc) of the Weatherley catchment was selected for this study. The Uc was used due to its small size (30 ha) and the relatively simple soil pattern compared to the whole catchment. Hydrological data were collected at a crump weir at the outlet of Uc. Seven soil profiles, 8 auger observations, 5 tensiometer nests (Uc4-Uc8), as well as 3 neutron probe access tubes were included in the selected hillslope. The experimental network of the Uc is presented in Fig. 1.

Soil data
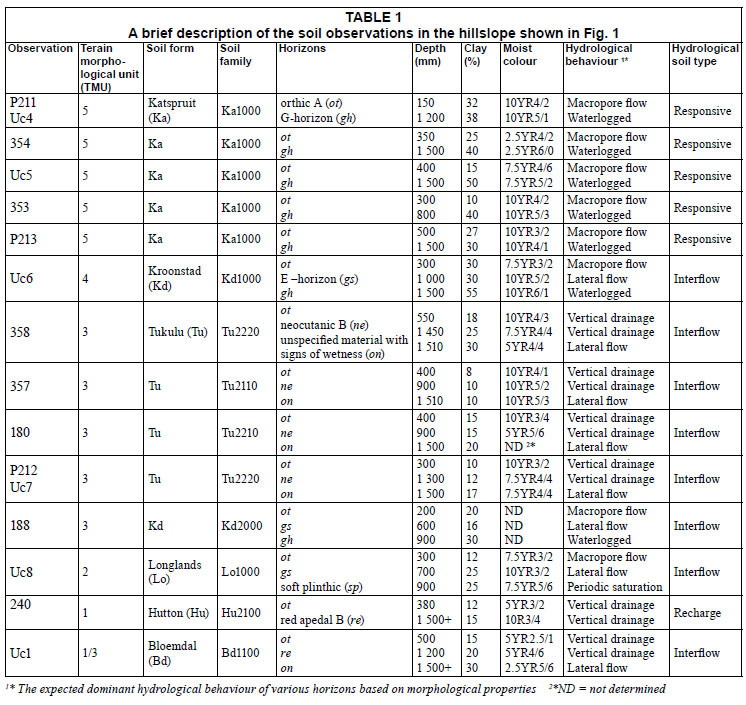
Soil data from a soil survey (Roberts et al., 1996), profile descriptions (Van Huyssteen et al., 2005) as well as auger observations were used to describe the soils. A brief description of soil observations in the selected hillslope is presented in Table 1. The observations are presented in sequence starting from P211 near the stream towards 240 close to the southern catchment divide (Fig. 1). Observation numbers with a 'P' prefix refer to profile descriptions; those with a number only refer to auger observations of Roberts et al. (1996) and numbers prefixed by Uc refer to additional auger observations at measuring sites of Lorentz et al.(2004). The soils were divided into 3 'hydrological soil types' according to their expected hydrological behaviour. The different soil types are:
• Responsive soils where saturated conditions favour saturation excess overland flow
• Interflow soils with lateral flow either at the soil/bedrock or A/B horizon interface
• Recharge soils where vertical drainage through and out of the soil profile are dominant (Table 1).
Evaluation of conceptual model
The conceptual model based on soil information was evaluated using hydrological and hydropedological measurements obtained from the BEEH 2003 and 2007 databases (BEEH, 2003; 2007: for a detailed description on the manufacturing and installation of the tensiometers used in this study see Lorentz et al., 2001 and for the calibration and data gathering by neutron water meters for baseflow estimation see Van Huyssteen et al., 2005). Two periods towards the end of the rain seasons of 2001 and 2002 were selected for evaluation purposes (2002 was selected due to the lack of continuity in the tensiometer data of Uc7 during 2001). These periods were selected to illustrate the dominant hydrological processes active when the catchment is delivering water to stream flow mainly by drainage, i.e. the catchment was not being recharged to a significant extent by precipitation. For hydro-graph analysis it was assumed that the selected hillslope is representative of the whole Uc.
The tensiometer nests, for evaluation purposes, were selected to illustrate different dominant hydrological pathways of various hydrological soil types (Table 1): responsive soils are presented by Uc4 (Ka1000); interflow soils (soil/bedrock) by Uc7 (Tu2220) and recharge soils by Uc1 (Bd1100). Although the latter is part of the interflow soil type it was utilised since there are no tensiometer measurements in the recharge soils (Hu2100) of the selected hillslope and due to the pedological similarity of the first 1 200 mm between Uc1 and 240. The tension (daily average) is expressed as a capillary pressure head (mm). Zero values indicate a water table; negative values a hydrostatic pressure below the water table (i.e. free water) above the tensiometer cup, and increasing positive values indicate increasing drying.
Results and discussion
Conceptual model of hydrological behaviour
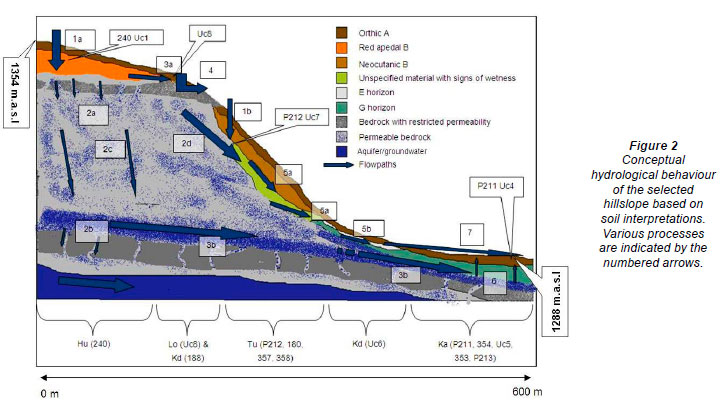
The soil forms and their associated properties, along with their spatial distribution, were interpreted to develop a conceptual model of the hydrological behaviour of the hillslope. The model reflects the expected dominant hydrological processes.
The dominant processes (flowpaths and storage mechanisms) are indicated by numbered arrows in Fig. 2 (for example 1a refers to Arrow 1a in Fig. 2). A discussion of these processes follows, in what can be considered as a hydropedological hypothesis of the hillslope hydrology of the Uc:
When it rains infiltration dominates in the upper regions of this hillslope (1a). Gentle slopes as well as dense vegetation impede overland flow and facilitate infiltration. Absence of any signs of wetness in the Hu2100 (240; Table 1 and Fig. 1) soil of the upperslope indicates that vertical drainage through the profile is dominant. The texture is non-luvic and the clay content is therefore relatively uniform with depth. No, or very little, lateral flow is expected to occur at the A/B horizon interface. These are considered to be true recharge soils since no signs of wetness were recorded in 240 up to a depth of 1 500 mm, indicating that water does not perch in the pedon within this depth. Water draining through 240 therefore either infiltrates the subsurface layers (2a) or flows at the soil/bedrock interface (3a), which was not reached with auger observations down to 2 400 mm.
Any water which does infiltrate the fractured rock would then either flow vertically and recharge regional aquifers (2b) or, when it encounters a layer with restricted permeability (aquitard), it would flow laterally (3b) and recharge perennial hillslope groundwater downslope.
The presence of interflow soils (Lo1000 and Kd2000 soil forms) located where the rock bedding plain surfaces near Uc8 (Fig. 1) is an indication that the bedding plane (Molteno shelf) has restricted permeability, promoting considerable flow at the soil/bedrock interface (3a). The greater part of the water draining through the Hu soil of the upper slope is therefore expected to flow laterally at the soil/bedrock interface.
Return flow (ex-filtration) to the soil surface (4) is expected as water flowing at the soil/bedrock interface reaches the protruding Molteno shelf. The amount of water exceeds the storage capacity of the soil and returns to the surface contributing to overland flow. It is expected that the overland flow has a short duration as the water will re-infiltrate when it reaches the Tu soils below the rock outcrop (1b).
Subsurface lateral flow (5a) in the form of flow at the soil/bedrock interface is indicated by the on horizon present in the deep subsoil of the Tu soil of the midslope. This soil body is situated on the Molteno Formation. Groundwater responsible for the redoximorphic features of the on horizon is evidently supplied from the recharge soils (Hu2100) as return flow from the bedrock (2d). This return flowpath is expected to result in a fairly constant supply of water during the wet seasons to the on horizon, reflecting its association with perennial groundwater.
The gs horizon in the Kd1000 form (Uc6; Table 1 and Fig. 1) of the lower slopes is an indication of the lateral flow of groundwater dominating at the A/B horizon interface (5b). Ka1000 and Kd1000 soils cover the entire TMU 4 and 5 positions of this hillslope. The gleyed conditions (P211, 354, Uc5, 353 and P213; Ka1000; Table 1 and Fig. 1) are indications that these profiles are saturated for long periods. The gh horizons have a low hydraulic conductivity that impedes infiltration. Precipitation does not infiltrate into these soils due to the saturated state of the gh horizon. The water maintaining saturation in these lower areas must therefore have another origin. It is believed that there is another layer with restricted permeability present in the hillslope (Fig. 2). This layer deflects water which has infiltrated through the recharge soils (Hu2100) of the upperslope towards the lower-lying areas (3b), resulting in the presence of a perennial aquifer. These very wet Ka1000 soils respond rapidly to precipitation providing overland flow to the stream, the process described as saturation excess overland flow (7). Near-surface macropore flow might also play a significant role in this area, as water from the gh horizon pushes up into the more porous ot horizon and flows laterally. The ot horizons of the Ka 1000 soils in the lower slope have Fe and Mn mottling, confirming periodic saturated conditions.
Since the gh horizon Ka and Kd soils (Table1) in the lower footslope and toeslope positions (Fig. 2) are saturated for long periods, the dominant flow direction within the pedon is upwards (6). Evapotranspiration will presumably extract more water from the soil than can infiltrate.
Evaluation of the conceptual model using tensiometer measurements
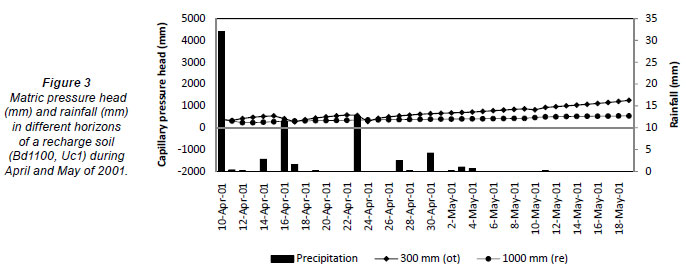
Results for the selected period from the tensiometers in the Bd soil (Uc1, Table 1) show changes in the matric pressure in the ot horizon after rainfall and slight changes in the re horizon (Fig. 3).
The ot horizon is only affected by rainfall during the first part of this period (Fig. 3). It seems that particular events greater than 5 mm affected this horizon on the same day, indicating rapid infiltration (1a). The horizon gradually dries out towards the end of this period (1 500 mm of suction), reflecting water extraction through ET.
The re horizon was only affected by a 32 mm rain storm on 10 April and became wetter approximately a day after the particular rain event due to infiltration (1a). It seems that during the smaller rain events, ET extracts the infiltrated water before it reaches this depth. This horizon gradually dried out towards the end of this period, but at a noticeable slower rate than the A horizon.
Tensiometer measurements of the ot horizon (300 mm) in the Tu soil (Uc7, Table 1), reflects rapid response after the 34 mm rain storm on 10 April 2002 (Fig. 4). This horizon came close to, but never reached saturation during the selected period and gradually dried out towards the end of the period.
The ne horizon responded very slightly to the rain on 10 April, implying some vertical drainage from the ot horizon. The on horizon however was saturated throughout the selected period. It did not respond to the rain storm on 10 April, implying that this horizon received water from another source and not through vertical drainage. The nearly constant capillary pressure of the on horizon further implies that this horizon loses water at a rate equal to the rate of obtainment (steady state flow). Supply from the bedrock to (2d in Fig. 2) is considered to be the dominant source of water saturating this horizon.
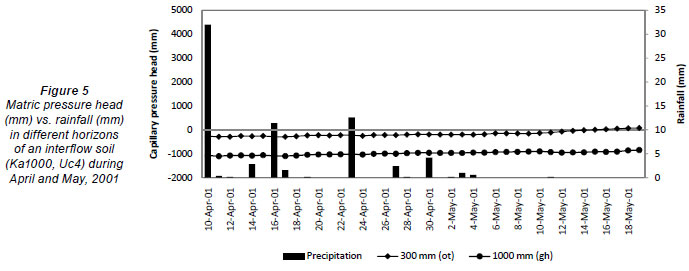
The matric potential of the horizons of the Ka soil responded differently to those of the Hu and Lo soils (Fig. 5). The ot horizon was saturated for long periods during this period (Fig. 5), with the water table reaching the surface (capillary pressure head of -350 mm). Although it gradually dried out, this horizon remained saturated for approximately 20 days after the last significant rain. This implies that water seeped towards this horizon (3b in Fig. 2) which satisfied the evaporative demand (6 in Fig. 2) and kept the horizon saturated. It was expected that overland flow would have been dominant following rain events during the period of saturation of this horizon due to saturation excess (7 in Fig. 2). The gh horizon (1 000 mm) remain saturated throughout the event confirming a constant recharge of these horizons (3a in Fig. 2) and the presence of perennial groundwater. This Ka1000 soil form is therefore a true saturation excess responsive soil.
Peak (quick) flow generation
It is hypothesised in the conceptual model, based on soil morphological information, that saturation excess overland flow and/or near-surface macropore flow dominates in the lower-lying areas (7). Tensiometer data confirm the saturated state of these soils.
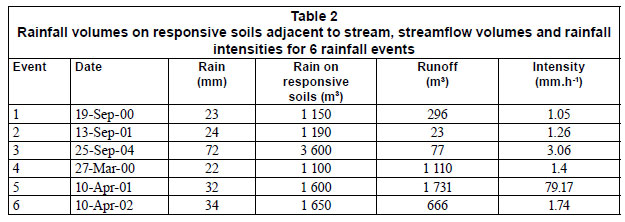
Data implies that responsive soils next to the stream will be the main contributors to peak flow generation. These soils occupy approximately 50 000 m2 of the Uc area. For this study, peak flow is assumed to stop 24 h after the end of the particular rain event. Rainfall intensity plays a dominant role in overland flow generation and was therefore taken into account. Table 2 presents rainfall and flow volumes as well as (average) rainfall intensities for selected rain events.
The first 3 events followed the dry winter period. The streamflow volume was lower than the rainfall volumes for these events, independent of the volume of rain or the intensity. This is because the ot horizon of the responsive soils was dry following extraction by evapotranspiration during the dry winter months, and needed to be recharged before any significant overland flow could occur. This process implies that responsive soils have a wetting-up phase in the beginning of the rain season.
During Event 4, with relatively low rainfall intensity, the rainfall on the responsive soils was almost exactly the same as the runoff for this event, supporting the hypothesis that responsive soils are the main contributor to peak flow with saturation excess overland flow and/or near-surface macropore flow as the flowpaths. During Event 5 the runoff exceeds the rainfall, which indicates that a greater area must have contributed to peak flow, or that there were subsurface contributions from upslope. This may result from contributions through infiltration excess, as the extremely high intensity storm clearly exceeds the final infiltration rate of these soils and overland flow (Hortonian flow) is generated on more soils. Event 6 followed a period where the evapotranspiration exceeded the rainfall and recharge of the ot horizon was needed prior to any overland flow; this explains the lower runoff compared to rainfall.
Baseflow generation
It is hypothesised that all the water contributing to baseflow must flow through the gh horizons of the Ka and Kd soil forms before reaching the stream. If this hypothesis is correct the volume of water lost by these horizons should therefore correspond with baseflow.
The gh horizon of P213 was selected as representative of the gh horizons. Its water content was taken as the average water content (measured with neutron water meter, BEEH (2003)) for this horizon during the period 5 May to 4 July
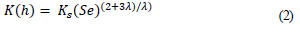
2001. This period was selected since it followed a wet period but no rain was recorded for the duration of the period itself. The volume of water that drained from this horizon was calculated using the Brooks-Corey-Burdine equation and parameter values from Lorentz et al. (2001) for a gh horizon in the Weatherley catchment:

and
where:
Se = effective degree of saturation;
θ = water content (m3 m-3);
K(h) = unsaturated hydraulic conductivity (mm h1);
θs = 0.351 (water content (m3m-3 at saturation));
θr= 0.264 (residual water content (m3m-3));
hd = 30.4 mm (air entry value);
λ = 0.562 (pore size distribution parameter);
Ks = 7.2 mm h-1 (P204 at 500 mm) (saturated hydraulic conductivity) and
h = water content measured in 90 mm soil layer.
Thus


By combining equations (1) and (2) the K can be calculated for different water contents; for example if h = 80 then K will be 0.2 mm h-1. A hydraulic conductivity curve based on this equation was drawn and from that a linear regression line in order to predict the K(h) at different water contents. The resulting linear regression was:

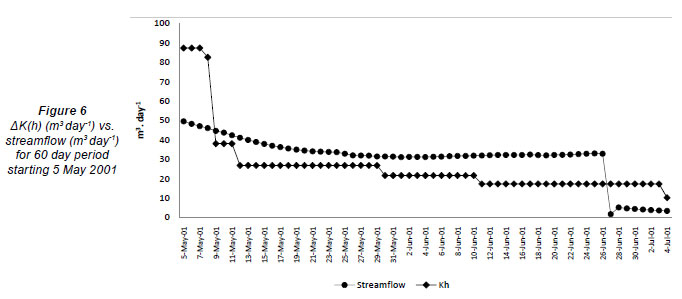
Equation (5) was used to calculate the potential outflow from all gh horizons in the Uc using water contents (h) measured at P213. These horizons occupy an area of 74 630 m2. The potential volume of water draining from these soils is expressed in m3day-1 and compared to the stream runoff (m3day-1) for the selected period (Fig. 6).
Baseflow estimated with the drainage equation for P213 gave a very good simulation of the actual streamflow (m3). The total streamflow estimated for this period is 1 607 m3 and the actual streamflow measured is 1 875 m3, indicating that baseflow can be accounted for primarily with outflow from the gh horizons in the lower slopes.
Conclusions
The conceptual model based solely on soil morphological properties gave an acceptable indication of the hillslope hydrology for the selected hillslope in the upper sub-catchment of the Weatherley research catchment. Tensiometer readings and stream hydrograph analysis supported the conceptual model. This model serves as a basis for distinguishing between different streamflow generation mechanisms. Results produced estimates which are comparable with the actual streamflow volumes obtained from the stream hydrograph. Soil information is readily available and indentifying and interpreting soil properties and their relative distribution might aid in the understanding and predictions of hydrological processes and can be especially useful for predictions in ungauged basins.
References
ASANO Y, UCHIDA T and OHTE N (2002) Residence times and flow paths of water in steep unchannelled catchments, Tanakami, Japan. J. Hydrol. 261 173-192. [ Links ]
BEEH (2003) Weatherley Database V1.0. School of Bioresources Engineering and Enviromental Hydrology, University of KwaZulu-Natal, Pietermaritzburg. [ Links ]
BEEH (2007) Weatherley Database V2.0. School of Bioresources Engineering and Enviromental Hydrology, University of KwaZulu-Natal, Pietermaritzburg. [ Links ]
BOORMAN DB, HOLLIS JM and LILLY A (1995) Hydrology of soil types: a hydrologically-based classification of the soils of the United Kingdom. Report No. 126. Institute of Hydrology. UK. [ Links ]
CHIRICO GB, MEDINA H and ROMANO N (2007) Uncertainty in predicting soil hydraulic properties at the hillslope scale with indirect methods. J. Hydrol. 334 405-422. [ Links ]
CLOTHIER BE, GREEN SR and DEURER M (2008) Preferential flow and transport in soil: progress and prognosis. Eur. J. Soil Sci. 59 2-13. [ Links ]
DE DECKER RH (1981) 1:250 000 Geological Series 3028 Kokstad. Council for Geoscience, Pretoria. [ Links ]
DUNN SM and LILLY A (2001) Investigating the relationship between a soils classification and the spatial parameters of a conceptual catchment-scale hydrological model. J. Hydrol. 252 157-173. [ Links ]
KARVONEN T, KOIVUSALO H, JAUHIAINEN M, PALKO J and WEPPLING K (1999) A hydrological model for predicting runoff from different land use areas. J. Hydrol. 217 253-265. [ Links ]
LILLY A, BOORMAN DB and HOLLIS JM (1998) The development of a hydrological classification of UK soils and the inherent scale changes. Nutr. Cycling Agroecosyst. 50 299-302. [ Links ]
LIN H, BOUMA J and PACHEPSKY Y (2006) Revitalizing pedology through hydrology and connecting hydrology to Pedology. Geoderma 131 255-256. [ Links ]
LORENTZ SA, GOBA P and PRETORIUS J (2001) Hydrological Processes Research: Experiments and Measurements of Soil Hydraulic Characteristics. WRC Report No. 744/1/01. Water Research Commission, Pretoria. [ Links ]
LORENTZ SA, THORNTON-DIBB S, PRETORIUS J and GOBA P (2004) Hydrological Systems Modelling Research Programme: Hydrological Processes, Phase II: Quantification of Hillslope, Riparian and Wetland Processes. WRC Report No. K5/1061 and K5/1086. Water Research Commission, Pretoria. [ Links ]
LORENTZ SA, BURSEY K, IDOWU O, PRETORIUS J and NGELEKA K (2007) Definition and Upscaling of Key Hydrological Processes for Application in Models. WRC Report No. K5/1320. Water Research Commission, Pretoria. [ Links ]
MARÉCHAL D and HOLMAN IP (2005) Development and application of a soil classification-based conceptual catchment-scale hydrological model. J. Hydrol. 312 277-293. [ Links ]
McGUIRE KJ, MCDONNELL JJ, WEILER M, KENDALL C, McGLYNN BJ, WELKER JM and SEIBERT J (2005) The role of topography on catchment-scale water residence time. Water Resour. Res. 41 (W05002) DOI:10.1029/2004WR003657. [ Links ]
MOSLEY MP (1982) Surface flow velocities through selected forest soils South Island, New Zealand. J. Hydrol. 55 65-92. [ Links ]
PACHEPSKY YA, RAWLS WJ and LIN HS (2006) Hydropedology and pedotransfer functions. Geoderma 131 308-316. [ Links ]
PARK SJ, MCSWEENEY K and LOWERY B (2001) Identification of the spatial distribution of soils using a process-based terrain characterization. Geoderma. 103 249-272. [ Links ]
PARK SJ and VAN DE GIESEN N (2004) Soil-landscape delineation to define spatial sampling domains for hillslope hydrology. J. Hydrol. 295 28-46. [ Links ]
QUINN T, ZHU AX and BURT JE (2005) Effects of detailed soil spatial information on watershed modelling across different model scales. Int. J. Appl. Obs. Geo. 7 324-388. [ Links ]
ROBERTS VG, HENSLEY M, SMITH-BAILLIE AL and PATTERSON DG (1996) Detailed soil survey of the Weatherley catchment. ARC-ISCW Report No. GW/A/96/33. Agricultural Research Council - Institute for Soil, Climate and Water, Pretoria. [ Links ]
RSA (REPUBLIC OF SOUTH AFRICA) (1998) National Water Act (Act No. 36 of 1998). Government Gazette No. 19182. Government Printers. Pretoria. [ Links ]
SCHULZE RE (1995) Hydrology and Agrohydrology: A Text to Accompany the ACRU 3.00 Agrohydrological Modelling System. WRC Report No. 63/2/84. Water Research Commission, Pretoria. [ Links ]
SEVERSON ED, LINDBO DL and VERPRASKAS MJ (2008) Hydropedology of a coarse-loamy catena in the lower Coastal Plain, NC. Catena 73 189-196. [ Links ]
SIVAPALAN M (2003) Prediction in ungauged basins: a grand challenge for theoretical hydrology. Hydrol. Process. 17 3163-3170. [ Links ]
SOULSBY C, TETZLFF D, RODGERS P, DUNN S and WALDRON S (2006) Runoff processes, stream water residence times and controlling landscape characteristics in a mesoscale catchment: An initial evaluation. J. Hydrol. 325 197-221. [ Links ]
SOULSBY C and TETZLAFF D (2008) Towards simple approaches for mean residence time estimation in ungauged basins using tracers and soil distributions. J. Hydrol. 363 60-74. [ Links ]
TICEHURST JL, CRESSWELL HP, MCKENZIE NJ and CLOVER MR (2007) Interpreting soil and topographic properties to conceptualise hillslope hydrology. Geoderma 137 279-292. [ Links ]
VAN HUYSSTEEN CW, HENSLEY M, LE ROUX PAL, ZERE TB and DU PREEZ CC (2005) The Relationship between Soil Water Regime and Soil Profile Morphology in the Weatherley Catchment, an Afforestation Area in the Eastern Cape. WRC Report No. 1317/1/05. Water Research Commission, Pretoria. [ Links ]
VEPRASKAS MJ and CALDWELL PV (2008) Interpreting morphological features in wetland soils with a hydrological model. Catena 73 153-165. [ Links ]
Received 11 March 2010; accepted in revised form 3 September 2010.
* To whom all correspondence should be addressed. +2751 401-9245; fax: +2751 401 2212; e-mail: vantoljj.sci@ufs.ac.za

