


Services on Demand
Article
 English (pdf)
 Article in xml format
 Article references
Indicators

Related links
-
 Cited by Google
 -
 Similars in Google
Share

 Permalink
Water SA
On-line version ISSN 1816-7950
Print version ISSN 0378-4738
Water SA vol.36 n.3 Pretoria Apr. 2010
Levels of selected alkylphenol ethoxylates (APEs) in water and sediment samples from the Jukskei River catchment area in Gauteng, South Africa
Linda L SibaliI,II,*; Jonathan O OkwonkwoIII; Rob I McCrindleIV
IChemistry Section, Analytical Services, Rand Water, Vereeniging, 1930, South Africa
IICoca Chemicals and Consulting, PO Box 10898, Vorna Valley, Midrand, 1686, South Africa
IIIDepartment of Environmental, Water and Earth Sciences, Tshwane University of Technology, Tshwane 0001, South Africa
IVDepartment of Chemistry, Faculty of Science, Tshwane University of Technology, Tshwane 0001, South Africa
ABSTRACT
There has been a continual search to develop sensitive analytical methods for detecting and determining organic compounds such as alkylphenol ethoxylates (APEs) in environmental samples, since they occur at very low concentration levels. Studies conducted so far in some South African waters have offered little or no information on APEs. The presence of these compounds in environmental samples is not desirable and therefore, needs to be monitored. Water and sediment samples were collected from different sites in the Jukskei River catchment area in the 2005 summer and winter seasons. Liquid-liquid extraction (LLE) and Soxhlet extraction (SE) methods (using 1:1 dichloromethane and methanol as extracting solvents) were optimised, evaluated and used to determine APEs of interest in water (unfiltered and filtered) and sediment samples, respectively. Mean percentage recoveries obtained for APEs in spiked double-distilled water were between 83.1±1.0 (OPnEOS3) and 108.1±3.5 (OP) and for sediments the range was between 96.6±0.9 (OPnEOS1) and 117.1±0.6 (OPnEOS3). The concentration levels of APEs studied in unfiltered environmental water samples were in the range of 0.25(0.03) ng/mℓ (NP) to 92.7(1.11) ng/mℓ (OPnEOS3) and 0.31(0.02) ng/mℓ (NP) to 60.1(0.51) ng/mℓ (OPnEOS3) for filtered environmental water samples. Concentration levels obtained in sediments were from 1.94(0.14) ng/gdw to 941(0.50) ng/gdw (OPnEOS3). Analytes adsorbed on the sample bottle gave concentration levels which ranged from 0.02(0.02) ng/mℓ to 0.42(0.02) ng/mℓ for APEs. All the compounds studied were found at levels higher than the European Union (EU) set levels for the protection of the aquatic environment.
Keywords: APEs, surface water, sediments, liquid-liquid, soxhlet, GC-FID
Introduction
During the past decades, the ever-increasing number of organic compounds being detected in surface water and sediments has raised concern about the contamination of water resources. One main reason for the concern of contamination is the use of surface waters as recipients for wastewater. Most effluents from cities and industrial plants end up in rivers, streams or lakes (Rodriguez-Mozaz et al., 2004). As removal of contaminants by wastewater treatment plants is frequently not complete, natural waters often contain many dissolved chemicals, which can affect ecosystems and impact drinking water supplies (Rodriguez-Mozaz et al., 2004). Alkylphenol ethoxylates (APEs) have been widely used as detergents in both industrial and household applications for more than 30 years. These compounds are non-ionic surfactants, consisting of a branched-chain of alkylphenols. Octylphenol ethoxylates (OPnEOs) and nonylphenol ethoxylates (NPnEOs) are two of the most common surfactants in the market place. APEs are discharged to wastewater treatment facilities or directly released into the environment. A recent modelling study concluded that 83% of UK nonylphenol ethoxylate production enters the environment, with 37% entering the aquatic environment (CES, 1993).
Primary degradation of APEs in wastewater treatment plants or in the environment generates more persistent shorter-chain APEs such as nonylphenol (NP) and octylphenol (OP) (Giger et al., 1984). Studies have found that APE metabolites are more toxic than the parent substances and they possess the ability to mimic natural hormones by interacting with the oestrogen receptor (Ying et al., 2002).
Due mainly to the discharge of effluents from wastewater treatment plants (both industrial and municipal sewage treatment plants), the occurrence of APEs and their degradation by-products has been widely reported in the surface waters of developed countries as well as in sediments around the world. The levels of these substances reported in sediments were much higher than those found in the corresponding surface waters (Ying et al., 2002).
Studies have linked APEs to adverse biological effects in animals, giving rise to concerns that low-level exposure might cause similar effects in human beings (WHO, 2002). Over the past few years, a wide variety of APEs have been identified as endocrine disruptors (EDs). These chemicals affect the endocrine system and cause alterations which can lead to breast cancer or sperm count reductions in organisms, hence they are termed 'endocrine disruptors' (Jobling et al., 1995; Pocull, 2002). Thus, interest has recently grown in determining these compounds in various environmental matrices (Brossa et al., 2002). Natural substances such as sex hormones or phytoestrogens (plant chemicals having oestrogen-effects), can become concentrated in industrial, agricultural and municipal wastes (CNOHSR, 2000). Exposure to these wastes may produce detrimental effects in humans, wildlife, fish and birds (Chee et al., 1996).
APEs and its metabolites are persistent in the environment and accumulate in fat; hence people/organisms with the greatest exposure are those ingesting fatty foods and fish originating from contaminated water. The release of APEs into the environment can occur through part, or all, of the chemicals' life cycle, i.e., from manufacturing to disposal (Tobin, 1986; Fara, 1999). Leakage from landfill sites and distribution via sewage sludge are also sources of exposure. The extent of exposure to APEs varies dramatically among species, individuals, and localities (Daughton and Ternes, 1999). The range of different physiochemical characteristics possessed by APEs means that these chemicals will degrade and behave in different ways in the environment, impacting exposure routes for both human and wildlife. The main abiotic factors that enhance the degradation processes are elevated temperature, increased sunlight, and aerobic conditions. Consequently, degradation rates can be expected to be faster in warmer and sunnier parts of the world. Other processes (e.g. hydrolysis, oxidation, radical and photochemical reactions) may transform these chemicals in the environment. Furthermore, exposure can occur via air, water, soil, food and consumer products. These chemicals may then enter the organism by ingestion, inhalation, through skin contact or via the gills (in the case of fish) across the cell membranes, and then become absorbed into the bloodstream (Crosby, 1998).
Liquid-liquid extraction (LLE) is a common method used for the determination of organic compounds in water. The studies by Tan (1992) and Fatoki and Awofolu (2003) have shown this method to be more reliable than solid-phase extraction (SPE) cartridges during sample preparation since the latter method is prone to interferences. Soxhlet extraction (SE) is also an established technique that has been used for the extraction of organic pollutants from marine sediment and soil samples (Snyder et al., 1992). The use of gas chromatography (GC) with flame ionisation detector (FID) for the detection of APEs is common because of its high resolution and good sensitivity in the nanogram range (Kim et al., 2004). However, gas chromatography-mass spectrometry (GC-MS) (Snyder et al., 1992; Koh et al., 2002; Kim et al., 2004), high-performance liquid chromatography coupled with fluorescence detector (HPLC-fluorescence) (Snyder et al., 1992) and liquid chromatography-mass spectrometry (LC-MS) (Scullion et al., 1996) are also widely employed for the determination of APEs in complex matrices (Ying et al., 2002).
Studies conducted worldwide show that there is a need to monitor the occurrence and prevalence of these compounds in river regions such as the Jukskei River catchment. Available information in South Africa indicates that the quality of most water resources, particularly dams, is indeed very poor. All land-use activities that take place in most river catchment areas, including the Jukskei River catchment area, are possible major sources of pollution, which is caused by organic compounds in runoff and industrial effluents disposed of into surface water and sediments in the catchment region.
Studies conducted thus far in some South African waters show the presence of organic compounds such as phthalate esters (PAEs) and organochlorine pestiscdes (OCPs), but have provided little or no information on APEs, although APEs have been included in the priority list of endocrine-disrupting compounds by the European Union (EU) within the Water Framework Directive (Barcelo et al., 2000). The issue of using filtered and unfiltered water samples for the quantitative determination of organic compounds has not been adequately addressed. Smith et al. (2001) reported that filtered water samples tend to show evidence of lower concentrations compared to unfiltered water samples. However, the issue of analyte losses through analyte retention on sample bottles was not given adequate attention. It is still impossible to present a complete picture of the distribution of organic compounds in South African waters since little or no information has been reported on organic compounds such as APEs.
The objectives of this study were to use LLE and SE methods with different solvent combinations and varied GC-FID conditions for the determination of APEs and its metabolites in water (unfiltered and filtered) and sediment samples. In addition, analyte losses through analyte retention on sample bottles and seasonal variation at different sampling sites were studied.
Experimental
Apparatus and reagents
Thoroughly-washed glassware was soaked overnight in dilute HNO3 solution and rinsed 3 times with distilled water and then with pure acetone. Sample bottles (2.5 ℓ Winchester bottles) were used to collect water samples and wide-mouth 500 mℓ brown glass Winchester sampling bottles were used for the collection of sediment samples. All reagents were of AR and GC grade (Merck, South Africa). Anhydrous sodium sulphate was deactivated by drying in the muffle furnace at 400°C for 3 h before use. All solvents were subjected to distillation 3 times before use and were in a range of 99.0 to 99.5% pure. APE standards were obtained from Supelco (Supelco, Belle-fonte, PA, USA). Silica gel, Kieselgel Merck Typ 77754, 70 to 230 mesh 100 µm was purchased from Sigma-Aldrich, South Africa. All the gases used were 99.9% pure and were obtained from Afrox, South Africa.
Preparation of stock standard solutions
Each APE standard (1 000 mg/ℓ) was prepared with hexane in a 5 mℓ volumetric flask. Lower working concentrations of APE standards were prepared from the stock solution. Thereafter, 1.0 µℓ of each was injected into the GC-FID until the instrument could not show any peaks. The internal standard method of analysis was chosen because it is more accurate and reliable, due to the adjusting and correcting mechanisms that it performs for errors that are likely to emanate from measurement of syringe volumes of the standards and processed samples.
Determination of instrument detection limits (IDLs) and retention times (tR)
The instrument detection limit (IDL) is the lowest detectable amount of each analyte that the instrument can detect and record. The IDL was computed using the method described by Miller and Miller (1998).

where:
Yb is the blank value
Sb is the standard error of the regression line
The noise and thresholds were set during the column background run so as to eliminate noise spikes from being registered as peaks. Each standard was injected into the GC to determine its retention time.
Determination of response factors (RF)
Response factor (RF) is a ratio of signal-to-sample size used to characterise a detector. It can also be explained as the measure of the sensitivity and responsiveness of the analytes relative to the instrument. RF of the APE standards relative to the internal standard (IS) dodecanol (DOL) was carried out by injecting the mixture of APEs within the concentration range 10 µg/ℓ to 18 µg/ℓ. Ten replicate injections were made. The RF was calculated from Eq.(2):

Silica-gel column chromatography (clean-up)
The chromatographic column (20 cm × 8 mm I.D.) was packed with 5.0 g of activated silica gel, which was made into a slurry with 1.5% (v/m) petroleum ether and then stirred well before use. About 1 mℓ of anhydrous sodium sulphate was placed at the top of the column to absorb any water in the sample or the solvent. The column was pre-eluted with 15 mℓ of petroleum ether and before exposure to sodium sulphate. The reduced 5 mℓ extract resulting from the extraction processes was placed in the column and allowed to sink below the sodium sulphate layer. APEs extracts were eluted with 2 × 10 mℓ portions of the extracting solvents. The eluant was collected, bubbled with nitrogen gas to dryness and reconstituted with 2 mℓ of extracting solvent. Then 1.0 µℓ was injected into the GC.
Sampling protocol
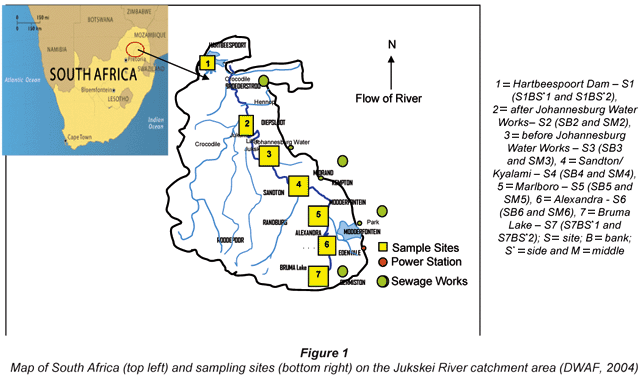
Description of the study area
The study area for this research work was the Jukskei River catchment area, which is located in the Gauteng and North West Provinces of South Africa. The Jukskei River catchment was chosen for this study because it receives effluent from industries and runoff in vast amounts from agricultural practices and illegal, unmanaged waste dumps (DWAF, 2004). The Jukskei River passes through the northern part of the densely-populated and industrialised Witwatersrand complex before flowing into the Crocodile River (Fig. 1). The Crocodile River drains into Hartbeespoort Dam, which is used for recreational purposes and as a source of raw water for Magalies Water Board. The Jukskei River catchment is largely urbanised and industrialised (DWAF, 2004).
Sampling sites
Water and sediment samples were collected from sampling points during the 2005 summer and winter seasons. Sampling points were chosen randomly from most accessible sites in the designated area of study. Six water samples were collected from each site (3 samples from the bank and 3 samples from the middle of the stream, except in the case of samples S1 and S7, which were taken from the opposite bank). The 6 water samples from each point were collected to make composite samples. Sampling sites were selected based on possible sources of pollution and are as shown in Fig. 1.
Water sampling
Water and sediment samples were collected during the summer and winter of 2005. All water samples were collected in triplicate in 2.5 ℓ pre-cleaned Winchester glass bottles from 7 sampling points identified within the Jukskei River catchment area. Prior to use, the bottles were first rinsed with the water samples and then immersed to about 5 cm below the surface. An aliquot of 5 mℓ of concentrated sulphuric acid was added to the water samples for preservation and the bottles were thereafter tightly sealed. Samples were then transported in a cool-box with ice to the laboratory, where they were stored in a cold room at 4°C until they were analysed.
Sediment sampling
Sediment samples were collected from about 0 cm to 5 cm below the surface, from the same locations as water samples; a grab sample was used. These samples were placed into pre-cleaned wide-mouth 500 mℓ glass bottles and closed immediately after sampling. The samples were kept cool during transportation to the laboratory by being placed in a cool-box. At the laboratory they were kept frozen at -18ºC prior to extraction and analysis.
Extraction of environmental water and sediment samples
Several extraction methods have been employed in determining organic compounds in water and sediment samples. These methods include SPE (Scullion et al., 1996; Koh et al., 2002), LLE (Moeder et al., 2000), on-line solid phase extraction (OLSPME) (Brossa et al., 2003) and solid-phase micro-extraction (SPME). SPE is routinely used in many different areas of analytical chemistry. It is used in the analysis of both polar and non-polar analytes where the matrix and the analyte of interest are usually dissolved in a liquid. It is also applied when analysing organic compounds in water samples since it is an easy and fast process (Hatrík and Tekel, 1996). The growth of SPE has largely been at the expense of LLE; the perceived advantages of SPE over LLE are that lower amounts of organic solvents are required and that a wider range of extraction mechanisms can be utilised (Olsen et al., 1998). However, studies by Tan (1992) and Fatoki and Awofolu (2003) have showed that the SPE method is not as reliable as the LLE method. The use of commercial SPE cartridges or disks during sample preparation has also been shown to give interferences during the analysis of organic compounds. In the study, extraneous peaks which appeared in the gas chromatograms were attributed to phthalate esters contained in the housing materials of the cartridges used (Fatoki and Awofolu, 2003). In the case of SPME, the coated fibres employed become unstable in complex matrices such as plasma or urine (Eisert and Levsen, 1996). Analyte recovery with SPME is between 0.5% and 10%; therefore sensitivity is low. Supercritical fluid extraction (SFE), microwave extraction (ME) and Soxhlet extraction (SE) are used for the extraction of solid samples, followed by gas chromatography (GC) or high-performance liquid chromatography (Petrovic et al., 2001). The main disadvantage of ME is the use of a single extraction vessel which needs to cool to room temperature; the cooling process can take some time before filtration and can cause re-adsorption issues (Smith et al., 2001); ME also requires microwave-absorbing solvent. SFE is noted to provide cleaner extracts, less solvent handling, and equivalent or better recoveries than conventional solvent extraction technique. Supercritical CO2 has been the most commonly-used fluid for SFE because of its low critical constants, its low toxicity and cost and its ability to extract quantitatively a wide range of relatively non-polar organics from a variety of matrices (Rochette et al., 1993). The use of SFE techniques for the extraction of organic compounds in aquatic systems has been widely reported in the literature (Snyder et al., 1992; Barnabas et al., 1994). Despite the fact that SFE of organic compounds from aqueous samples has shown remarkable advantages over solvent extraction techniques, there are indications that this technique is not completely successful, especially for biotic matrices (Fatoki and Awofolu, 2003).
Unfiltered water
Acidified unfiltered environmental water samples (100 mℓ) were measured into a 500 mℓ separating flask and extracted with 3 × 15 mℓ of 1:1 dichloromethane/methanol (DCM/MET) for APEs analysis. The extract was taken through the silica gel column clean-up. The eluants were concentrated to about 1 mℓ before GC analysis.
Filtered water
Acidified filtered water samples (100 mℓ) from sites S1, S4 and S7 were subjected to the method used by Koh et al. (2002) and separated into particulate matter using pre-combusted GF/F (0.7 µm nominal) glass-fibre filters (Whatman, Maidstone, England) under vacuum and were extracted with 1:1 DCM/MET. The extraction procedure was carried out as described earlier.
Sediment samples
Sediment samples were thawed and air-dried in a dark cupboard for 3 to 4 d. These samples were ground and homogenised using a clean mortar and pestle and then sieved before being subjected to further treatment. Air dried, sieved and pre-extracted sediment samples (10 g) were weighed into a pre-extracted Whatman extraction thimble in a Soxhlet extraction apparatus using 1:1 DCM/MET as the extracting solvent. The reduced 5 mℓ extract was carried through the chromatographic clean-up process as described above before GC analysis.
Extraction test for adsorbed analytes from sampling bottle
Sample bottles used for collecting water samples from Sites S1, S4 and S7 were rinsed with 3 x 10 mℓ of extraction solvent. The extracts were taken through the same procedure as described above before GC analysis.
Quality assurance
Due to unavailability of certified materials (CRM), the spiking method was applied in the recovery test to validate the analytical methods used. Triple distilled water was spiked with 2 mℓ of 1 000 mg/ℓ of APEs standard mixture and was taken through the same procedure as above prior to GC analysis. Several quality assurance measures were also routinely used in this study and included running blanks with each sample set and analysing samples as triplicates. Gas chromatographic conditions were monitored daily by checking the range of response factors of the calibration standards and the recoveries of a test standard that was included in each run.
Gas chromatography analysis
Each processed sample (1 µℓ) was injected into the GC split mode at a split ratio of 1:5 for analysis. The injector and detector temperatures were maintained at 300°C and 350°C, respectively. The oven temperature was initially maintained at 100°C, then programmed to increase at 20°C/min to 250°C and then ramped up to 280°C at 10°C/min. Helium was chosen and used as a carrier gas due to the fact that it exhibits a flat Van Dempter profile. The make-up gas (nitrogen) was maintained at 28 mℓ/min whilst carrier gas was kept at a flow rate of 3 mℓ/min.
Statistical analysis
All statistical analyses were carried out using the Statistical Package for Social Scientists (SPSS) Software (Version 11.0). One Way ANOVA and Pearson's Correlation Index were used to test for significant differences (95% confidence) and the relationship between the results for water and sediments, as well as summer and winter, with respect to APEs was studied.
Results and discussion
Identification of APEs in field samples
The gas chromatogram of APEs standard mixture is shown in Fig. 2. APEs and its metabolites were identified and these are fairly well resolved. Unidentified peaks can be linked to the OPnEOS3 Technical Grade standard used.
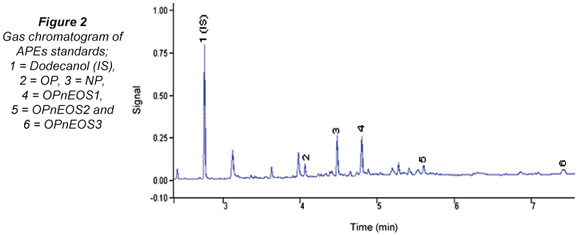
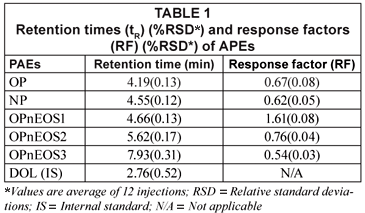
Table 1 presents retention (tR) and response factors (RF) compounds studied. The values obtained have relative standard deviations (RSDs) in brackets expressed as percentages. The tAPEs tR values obtained ranged from 4.19(0.13) min (OP) to 7.93(0.31) min (OPnEOS3)). It was noted that the molecular size and charge density of these compounds played a major role during the elution time. The molecular weight of the first eluted compound, OP, is 206.33 g/mol and the last eluted compound, OPnEOS3, is 333.48 g/mol. The response factors (RF) ranged from 0.54(0.03) (OPnEOS3) to 1.61(0.08) (OPnEOS1). The RF did not follow any particular pattern in relation to chemical and physical properties of APEs. OPnEOS1 exhibited an RF value of greater than 1.0.
Instrument detection limits (IDLs)
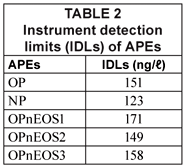
The IDLs of APEs analysed are presented in Table 2. The IDL values were calculated from the linear regression equation of the calibration curve of the APEs standards as generated by the Star Chromatograph Work Station Version 6 coupled to the GC and as described by Miller and Miller, (1998). IDLs obtained for APEs ranged from 123 (NP) to 171 ng/ℓ (OPnEOS1) as shown in Table 2. These values were lower than those obtained by Smith et al. (2001); (15 000 ng/ℓ) using HPLC coupled with a fluorescence detector.
Quality assurance
Mean percentage recoveries of APEs in water and sediment samples
The mean percentage recoveries for triplicate analysis of APEs from spiked triple distilled water and sediment samples are presented in Table 3. Percentage recoveries obtained using 1:1 DCM/MET ranged from 83.1±1.1 (OPnEOS3) to 108.1±3.5 (OP). For hexane, the percentage recoveries were from 49.1±1.9 (OPnEOS1) to 123.1±2.3 (NP); 48.3±4.6 (OPnEOS2) to 115.0±1.0 (OPnEOS3) for DCM and 40.3±3.1 (OPnEOS1) to 128.1±0.1 (NP) using 1:1 DCM/HEX. Hexane gave percentage recoveries of 52.8±1.1 (OP), 49.1±1.9 (OPnEOS1) and 67.6±4.9 (OPnEOS2), all below the acceptable percentage recovery value of 70 except for NP (121.0±1.7). For DCM, the percentage recovery value below 70 was 48.3±4.6 (OPnEOS2). Using 1:1 DCM/HEX, percentage recovery values below 70 were 45.5±2.0 (OP), 40.3±3.1 (OPnEOS1), 50.3±5.4 (OPnEOS2) and 62.9±4.0 (OPnEOS3). Therefore, the solvent combination of 1:1 DCM/MET gave the best percentage recoveries above 70 in all the compounds of interest. Ferguson et al. (2000) reported percentage recoveries of NP (78.2±2.0), NPnEOS1 (90.2±2.1), NPEOS2 (87.4±1.7) and NPnEOS3 (90.5±2.0) in water samples using SPE. These percentage recovery values are comparable to the values obtained in the present study with 1:1 DCM/MET.
With respect to sediments, the percentage recoveries obtained using hexane ranged from 23.0±1.6 (OPnEOS1) to 116.1±0.1 (NP) as shown in Table 3. For DCM, the percentage recovery was from 16.3±0.7 (NP) to 128.1±0.5 (OPnEOS2), while that for 1:1 DCM/HEX ranged from 31.9±0.3 (OP) to 118.1±0.2 (NP), and from 96.6±0.9 (OPnEOS1) to 117.1±0.6 (OPnEOS3) using 1:1 DCM/MET for extractions. The best percentage recoveries were obtained with 1:1 DCM/MET compared to the other 3 solvents. Ferguson et al. (2000) reported recoveries of (82.8±5.4) NP, (93.5±6.7) NPnEOS1, (84.3±5.9) NPEOS2 and (80.4±4.7) NPnEOS3 in sediment samples using SE as an extraction method.
Percentage recoveries above 100% might be attributed to instrumental drift during the analysis since the compounds of interest were not detected in blank samples.
Background analysis
Blank samples analysed were found to contain no target analytes. Both water and sediment samples did not show any peaks that may have influenced results during the analysis.
Analysis of environmental water and sediment samples
Identification of APEs in water and sediment sample extracts were confirmed by comparing their tR (time taken for each compound to elute in a chromatogram) with those of their standards.
Analysis of APEs during summer and winter seasons
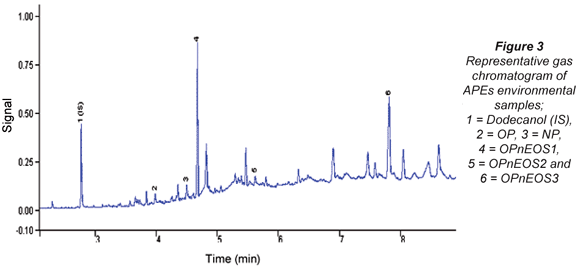
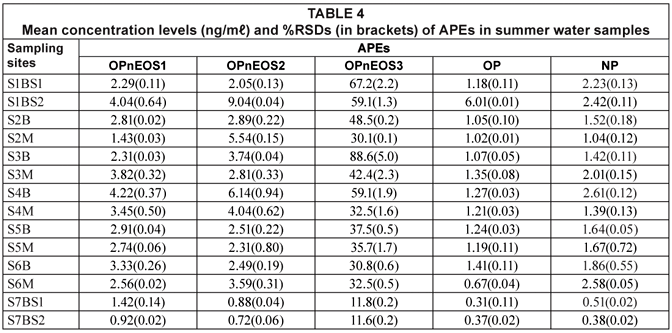
The APEs representative gas chromatogram sample is shown in Fig. 3. Peaks of the compounds of interest as well as unidentified peaks can be seen in the representative gas chromatogram. Due to the unavailability of more APEs standards, some peaks could not be identified. The results from the analysis of APEs for water and sediment are presented in Tables 4 to 7. Table 4 shows concentration levels during summer from water samples which varied between 0.31(0.11) ng/mℓ (OP) and 88.6(5.04) ng/mℓ (OPnEOS3); and Table 5 presents the concentration levels obtained during summer for sediment samples which ranged from 1.72(0.21) ng/gdw (OPnEOS2) to 426(1.08) ng/gdw (OPnEOS3).
The summer season sampling results for water samples from Site S1BS*2, which is downstream of Johannesburg Water wastewater treatment plant, showed the highest concentration levels of OPnOES1, OPnOES2, OPnOES3 and OP, which might be attributed to the effluent from the wastewater treatment plant. Detergents from ongoing washing of boats next to the Hartbeespoort Dam may have contributed to the high concentration levels recorded in this study. Site S7BS*2 is upstream of Johannesburg Water wastewater treatment plant and low concentration levels of OPnOES1, OPnOES2, OPnOES3, OP and NP were detected. Low concentration levels of these compounds might be due to the dilution at Bruma Lake.
Summer sediment samples from Site S1BS*2 showed high concentrations of the APEs of interest. Low concentration levels were recorded for Site S7BS*1 for OPnOES1, OPnOES2, OPnOES3, OP and NP.
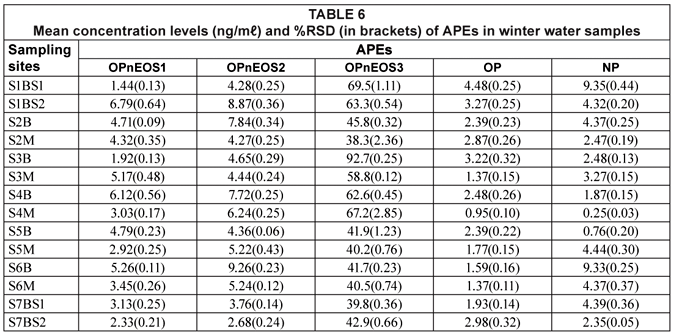
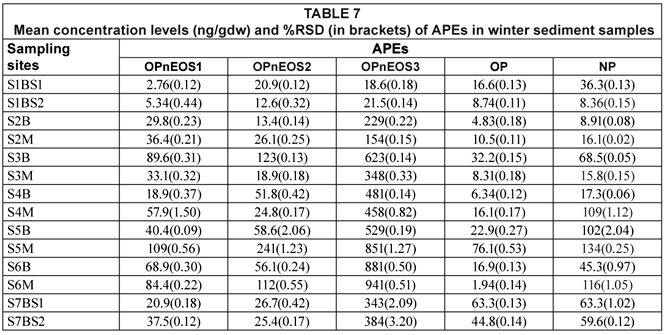
Concentration levels of APEs for water and sediment samples during winter can be seen in Tables 6 and 7, respectively. Concentration levels of pollutants in water samples ranged from 0.38(0.02) (NP) to 92.7(1.65) (OPnEOS3) ng/mℓ. Concentration levels in sediment varied between 2.76(0.12) ng/gdw and 941(0.51) ng/gdw (OPnEOS3).
It can be seen from Tables 6 and 7 that alkylphenol ethoxylate (OPnOES3) exhibited the highest concentration levels for water, i.e. 92.7(0.25) ng/mℓ, and sediment, i.e. 1 850(1.27) ng/gdw, samples during the winter period. The observed high concentrations can be attributed to slow degradation of OPnEOS3 compared to other APEs studies. Ying et al. (2002) reported on the degradation of these compounds. The trend for the others was as follows: OPnOES2 > OPnOES1 > NP > OP.
The highest concentration levels detected in water during winter were 6.79(0.64) ng/mℓ, 9.26(0.23) ng/mℓ, 92.7(0.25) ng/mℓ, 4.48(0.25) ng/mℓ and 9.35(0.44) ng/mℓ for OPnOES1, OPnOES2, OPnOES3, OP and NP, respectively as shown in Table 6. The lowest concentration levels recorded were 1.44(0.13) ng/mℓ, 2.68(0.24) ng/mℓ, 38.3(2.36) ng/mℓ, 0.95(0.10) ng/mℓ, and 0.25(0.03) ng/mℓ for OPnOES1, OPnOES2, OPnOES3, OP and NP, respectively.
High concentration levels were detected in sediments during winter (Table 7), with values of 89.6(0.31) ng/gdw, 241(1.23) ng/gdw, 1850(1.27) ng/gdw, 76.1(0.53) ng/gdw and 134(0.25) ng/gdw for OPnOES1, OPnOES2, OPnOES3, OP and NP, respectively. Low concentration levels obtained were 5.34(0.44) ng/gdw, 12.6(0.32) ng/gdw, 18.6(0.18) ng/gdw, 6.34(0.12) ng/gdw and 8.36(0.15) ng/gdw for OPnOES1, OPnOES2, OPnOES3, OP and NP, respectively. High concentration levels were obtained during the winter season from both water and sediments at values of 92.7(1.65) ng/mℓ (OPnOES3) and 1850(1.27) ng/gdw (OPnOES3), respectively.
Several studies have reported the occurrence and distribution of APEs such as OPnOES1, OPnOES2, OPnOES3, OP and NP (Ferguson et al., 2000; Smith et al., 2001; Van Vlaardingen et al., 2003). Smith et al. (2001) reported concentration levels which ranged from not detectable (ND) to 1.90 ng/mℓ. These results are lower than the ones obtained in this study for water samples. Ferguson et al. (2000) investigated APEs metabolites from both water and sediment samples. The range was from ND to 0.320±3.00 ng/mℓ, and from 4.38±10.0 to 13.32 ng/g, for water and sediment samples, respectively. The reported results showed the same trend as the results obtained in this study. It can be observed from Tables 4 to 7 that the range of APEs concentrations for water samples was lower than the range for sediment samples. Concentration levels for sediment samples were found to be higher and this might be attributed to the fact that sediments act as a sink for organic compounds in aquatic environments (Van Vlaardingen et al., 2003).
These levels are observed to be higher than EU acceptable limits (Van Vlaardingen et al., 2003) for APEs in water (OPnOES1-2 = 7.3 ng/mℓ, OPnOES3 = 1.8 ng/mℓ and NP = 0.33 ng/mℓ) and in sediments (OPnOES1-2 = 3.6 ng/g), OPnOES3 = 0.45 ng/g and NP = 105 ng/g). Therefore, there is a cause for concern since some parts of the river are being used as a primary water source for domestic purposes.
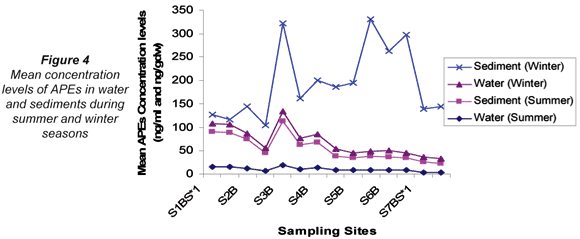
On comparing the mean concentration levels of APEs in water and sediments for summer and winter, the mean concentration levels observed in water were found to be higher in winter (13.8 ng/mℓ) than in summer (10.2 ng/mℓ). Similarly, winter sediment mean concentration levels (158 ng/gdw) were higher than the summer mean concentration levels (44.9 ng/gdw). However, in water samples this difference was not observed to be significant whereas it was observed to be significant in sediments (p ≤ 0.05). A significant positive correlation was observed between average concentration levels obtained in summer and winter water samples (r = 0.953); whereas no correlation was observed in sediments at p ≤ 0.01. It can be deduced, therefore, that the concentration of APEs in water was not affected by seasonal variation. However, the levels of APES occurring in sediments were seasonally affected as indicated by the lack of correlation between seasonal results. The variations of APEs in water and sediments for the winter and summer seasons are illustrated in Fig. 4.
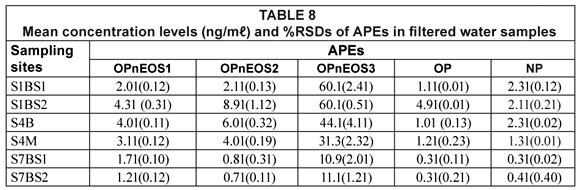
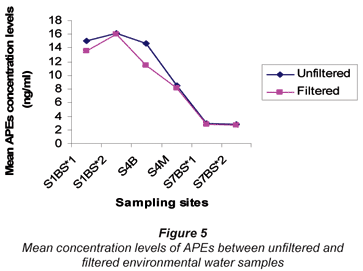
Analysis of filtered water samples
The results of APEs analysis of filtered water samples from 3 sampling sites (S1 = S1BS*1 and S1bS*2, S4 = S4B and S4M, S7 = S7BS*1 and SBS*2) are represented in Table 8 and Fig. 5. The values obtained for filtered water samples were slightly lower than those for unfiltered water samples. Smith et al. (2001) reported that filtered water samples show evidence of lower concentration levels compared to unfiltered water samples. Organic compounds such as APEs have an affinity for particulate material and sorption of organic compounds onto particles during the filtration stage increases the chances of obtaining lower concentration values. Therefore, it can be concluded that results obtained in this study are similar to those results reported by Smith et al. (2001).
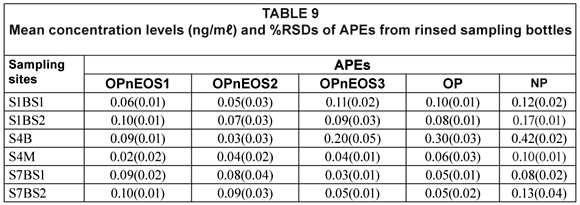
Rinsing of the sampling bottles with extraction solvent 3 times proved that all APEs of interest were extracted from the bottles. 1:1 DCM/MET was used for rinsing the sampling bottles for APEs extractions.
Table 9 shows results obtained from the rinsed sampling bottles, which gives an indication of possible analyte losses due to analyte retention on the bottles. The APEs of interest were detected in the rinsed sampling bottles, with the highest value recorded for NP (0.42(0.02) mg/mℓ) from Site S4B and the lowest value recorded for OPnEOS1 (0.02(0.00) mg/mℓ) from Site S4M. The percentage, of the total concentration of APEs recorded for each sample, which was retained in the sampling bottle ranged from 0.1% to 15.0%. Although this range seems to be a small fraction of the APEs extracted from water samples, the results indicated the usefulness of extracting 'empty sampling bottles'.
Conclusions
The conditions of GC-FID were optimised and the method developed was applied in the determination of APEs studied. The analysis times were shortened and peak resolution was good in most cases.
From the results of the quality assurance/control carried out for the analysis of APEs in this study, it was revealed that an LLE with 1:1 DCM/MET as a solvent system was best for the determination of APEs in environmental water samples. Using the Soxhlet extraction method, the same solvent system gave good results for APEs in sediment samples. The method used in this study was validated with the spiking method for APEs in triple-distilled water.
The results show no appreciable difference between filtered and unfiltered water samples from the Jukskei River catchment although levels in filtered water samples were slightly lower than in unfiltered water samples.
Analyte loss through analyte retention in the sample bottle was demonstrated through the recovery of APEs of interest from the sampling bottles. Therefore, it was confirmed that sampling bottles or glass do adsorb these compounds.
The levels obtained from the catchment were higher than the water criteria values recommended in terms of EU Maximum Permissible Values for the protection of the aquatic environment. Levels obtained were also higher than those obtained in other studies conducted for aquatic environments in other parts of the world. During this study the occurrence of APEs also showed some seasonal variation. The results obtained indicate that there is definite pollution of the Jukskei River catchment with the APEs of interest to this study. The APEs investigated in this study have serious health implications for humans and biota. Continuous and regular monitoring of APEs is highly desirable and recommended. This monitoring also becomes very important considering the discharge of effluents from wastewater treatment plants (both industrial and municipal sewage treatment plants) into the catchment.
Acknowledgements
The authors would like to thank Tshwane University of Technology and the National Research Foundation (NRF) (Scarce Skills Scholarship), South Africa, for financial assistance during this study.
References
BARCELO D, PETROVIC M, LOPEZ DE ALDA M, PINA B, SOLE M and TAVAZZI S (2000) Monitoring of Endocrine Disruptors in Waters (SW and WW), Sludges, Sediments and Biota. Integration of Chemical Analysis by LC-MS and Effect Studies using Yeast Assay and Vitellogenin in Carp. Department of Environmental Chemistry, IIQAB-CSIC, Barcelona, Spain. [ Links ]
BARNABAS IJ, DEAN JR, HITCHEN SM and OWEN SP (1994) Supercritical fluid extraction of organochlorine pesticides from aqueous matrix. J. Chromatogr. A 665 307-315. [ Links ]
BROSSA L, MARCE RM, BORRULL F and POCURULL E (2002) Application of on-line solid-phase extraction-gas chromatography-mass spectrometry to the determination of endocrine disruptors in water samples. J. Chromatogr. A 963 287-294. [ Links ]
BROSSA L, MARCE RM, BORRULL F and POCULL E (2003) Determination of endocrine disrupting compounds in water samples by on line solid phase extraction programmed temperature vaporization gas chromatography mass spectrometry. J. Chromatogr. A 998 41-50. [ Links ]
CHEE KK, WONG MK and LEE HK (1996) Microwave assisted elution techniques for the extraction of organic pollutants in water. Anal. Chim. Acta 330 217-227. [ Links ]
CES (CONSULTANTS IN ENVIRONMENTAL SCIENCES) (1993) Uses, Fate and Entry to the Environment of Nonylphenol Ethoxylates. Consultants in Environmental Sciences Ltd. (for the Department of the Environment), Beckenham, Kent, United Kingdom. [ Links ]
CNOHSR (Canadian National Occupational Health and Safety Resource) (2000) URL: https://www.ccohs.ca/oshanswers/chemicals/endocrine.htm1 (Accessed 19 January 2006). [ Links ]
CROSBY D (1998) Pest Management Science: Environmental Toxicology and Chemistry. Oxford University Press, Oxford, United Kingdom. 280 pp. [ Links ]
DAUGHTON CG and TERNES TA (1999) Pharmaceutical and personal care products in the environment: Agents of subtle change? Environ. Health Perspect. 107 (Suppl 6) 907-938. [ Links ]
DWAF (Department of Water Affairs and Forestry, South Africa) (2004) Annual Report 2002/2003. Department of Water Affairs and Forestry, Pretoria, South Africa. [ Links ]
EISERT R and LEVSEN K (1996) Solid-phase microextraction coupled to gas chromatography: A new method for the analysis of organics in water. J. Chromatogr. A 733 143-157. [ Links ]
FARA GM (1999) The Industrie Chimiche Meda Società Azionaria (ICMESA) accident: First intervention for the protection of man and environment. In: Ballarin-Denti A, Bertazzi PA, Facchetti S, Fanelli R and Mocarelli P (eds.) Chemistry, Man and Environment. Elsevier Science, Amsterdam, The Netherlands. 3-16. [ Links ]
FATOKI OS and AWOFOLU RO (2003) Methods for selective determination of persistent organochlorine pesticides residues in water and sediments by capillary gas chromatography and electron capture detector. J. Chromatogr. A 983 225-236. [ Links ]
FERGUSON PL, IDEN CR and BROWNAWELL BJ (2000) Analyisis of alkylphenol ethoxylates metabolites in the aquatic environment using liquid chromatography-electrospray mass spectroscopy. Anal. Chem. 72 4322-4330. [ Links ]
GIGER W, BRUNNER P H and SCHAFFNER C (1984) 4-Nonylphenol in sewage sludge: accumulation of toxic metabolites from nonionic surfactants. Sci. 225 623-625. [ Links ]
JOBLING T, REYNOLDS T, WHITE R, PARKER MG and SUMPTER JP (1995) A variety of environmentally persistent chemicals including some phthalate esters, are weakly estrogenic. Environ. Health Persp. 103 582-587. [ Links ]
KIM Y, KATASE T, SEKINE S, INOUE T, MAKINO M, UCHIYAMA T, FUJIMOTO Y and YAMASHITA N (2004) Variation in estrogenic activity among fractions of a commercial nonylphenol by high performance liquid chromatography. Chemosphere 54 1127-1134. [ Links ]
KOH C-H, KHIM SJ, VILLENEUVE DL, KANNAN K and GEISY JP (2002) Analysis of trace organic contaminants in sediments, pore water, and water samples from Onsan Bay, Korea: Instrumental analysis and in vitro gene expression assay. Environ. Toxicol. Chem. 21 1796-1803. [ Links ]
MILLER JC and MILLER JN (1998) Statistics for Analytical Chemistry (2nd edn.) Chapter 4. Ellis Horwood, Chichester, UK. 97-100. [ Links ]
MOEDER M, SCHRADER S, WINKLER M and POPP P (2000) Solid-phase micro extraction-gas chromatography-mass spectrometry of biologically active substances in water samples.J. Chromatogr. A 873 95-106. [ Links ]
OLSEN J, MARTIN P and WILSON D (1998) Molecular imprints as sorbents for solid-phase extraction: potential and applications. Anal. Commun. 35 13-14. [ Links ]
PETROVIC M, DIAZ A, VENTURA F and BARCELO D (2001) Simultaneous determination of halogenated derivatives of alkylphenol ethoxylates and their metabolites in sludges, river sediments, and surface, drinking, and wastewaters by liquid chromatography-mass spectrometry. Anal. Chem. 73 (24) 5886-5895. [ Links ]
POCULL E (2002) Application of on-line solid phase extraction-gas chromatography-mass spectrometry to the determination of endocrine disruptors in water samples. J. Chromatogr. A 963 287-294. [ Links ]
ROCHETTE AE, HARSH JB and HILL HH (1993) Supercritical fluid extraction of 2,4-D from soils using derivatization and ionic modifiers. Talanta 40 147-155. [ Links ]
RODRIGUEZ-MOZAZ S, LOPEZ DE ALDA S and BARCELO MJD (2004) Monitoring of estrogens, pesticides and bisphenol A in natural waters and drinking water treatment plants by solid-phase extraction-liquid chromatography-mass spectrometry. J. Chromatogr. A 105 85-92. [ Links ]
SCULLION DS, CLENCH MR, COOKE M and ASHCROFT AE (1996) Determination of surfactants in surface water by solid-phase extraction, liquid chromatography-mass spectrometry.J. Chromatogr. A 773 207-216. [ Links ]
SMITH E, RIDGWAY I and COFFEY M (2001) The determination of alkylphenols in aqueous samples from the Forth Estuary by SPE-HPLC-fluorescence. J. Environ. Mon. 3 616-620. [ Links ]
SNYDER JL, GROB RL, MACNALLY ME and OOSTDYK TS (1992) Comparison of supercritical fluid extraction with classical sonication and Soxhlet extractions for selected pesticides. Anal. Chem. 64 1940-1946. [ Links ]
TAN GH (1992) Comparison of solvent extraction and solid phase extraction for the determination of organochlorine pesticide residues in water. Analyst 117 1129-1132. [ Links ]
TOBIN P (1986) Known and potential sources of hexachlorobenzene. In: Morris CR and Cabral JRP (eds.). Hexachlorobenzene. IARC Scientific Publication No. 77. Proc. IARC Int. Symp. 06/03/86. Lyon, France. Oxford University Press, UK. pp. 678-682. [ Links ]
VAN VLAARDINGEN PLA, POSTTHUMUS R. and TRAAS TP (2003) Environmental Risk Limits for Alkylphenols and Alkylphenol Ethoxylates. RIVM Report No. 601501019/2003. RIVM (National Institute for Public Health and the Environment, The Netherlands), Bilthoven. URL: http://www.rivm.nl/bibliotheek/rapporten/601501019.html. [ Links ]
WHO (World Health Organisation) (2002) Global assessment of the state-of-the-science of endocrine disruptors. URL: http://www.who.int/ipcs/publications/en/ch1.pdf (Accessed 19 January 2006). [ Links ]
YING G, WILLIAMS B and KOOKANA R (2002) Environmental fate of alkylphenols and alkylphenol ethoxylates – a review. Environ. Int. 28 215-226. [ Links ]
Received 28 October 2009; accepted in revised form 23 February 2010.
* To whom all correspondence should be addressed.
+2716 430 8419; fax: +27866 944 225;
e-mail: lsibali@randwater.co.za; sibalill@cocacc.co.za

