


Serviços Personalizados
Artigo
 Inglês (pdf)
 Artigo em XML
 Referências do artigo
Indicadores

Links relacionados
-
 Citado por Google
 -
 Similares em Google
Compartilhar

 Permalink
Water SA
versão On-line ISSN 1816-7950
versão impressa ISSN 0378-4738
Water SA vol.36 no.1 Pretoria Jan. 2010
SHORT COMMUNICATION
Hierarchical clustering of RGB surface water images based on MIA-LSI approach
Petr PrausI,*; Pavel PraksII
IDepartment of Analytical Chemistry and Material Testing, Faculty of Metallurgy and Material Engineering, VSB-Technical University of Ostrava, 17. listopadu 15, 708 33 Ostrava, Czech Republic
IIDepartment of Mathematics and Descriptive Geometry, Department of Applied Mathematics, Faculty of Electrical Engineering and Computer Science, VSB-Technical University of Ostrava, 17. listopadu 15, 708 33 Ostrava, Czech Republic
ABSTRACT
Multivariate image analysis (MIA) combined with the latent semantic indexing (LSI) method was used for the retrieval of similar water-related images within a testing database of 126 RGB images. This database, compiled from digital photographs of the various water levels and similar images of surface areas and vegetation, was transferred into an image matrix, and reorganised by means of principal component analysis (PCA) based on singular value decomposition (SVD). The high dimensionality of original images given by their pixel numbers was reduced to 6 principal components.
Thus characterised images were partitioned into clusters of similar images using hierarchical clustering. The best defined clusters were obtained when the Ward's method was applied. Images were partitioned into the 2 main clusters in terms of similar colours of displayed objects. Each main cluster was further partitioned into sub-clusters according to similar shapes and sizes of the objects. The clustering results were verified by the visual comparison of selected images. It was found that the MIA-LSI approach complemented with a suitable clustering method is able to recognise the similar images of surface water according to the colour and shape of floating subjects. This finding can be utilised for the automatic computer-aided visual monitoring of surface water quality by means of digital images.
Keywords: multivariate image analysis (MIA), latent semantic indexing (LSI), RGB image, Ward's clustering, water quality.
Introduction
Water quality is usually monitored using a number of chemical, physical, and biological methods, which are expensive and time consuming. Moreover, these methods must be performed in laboratories, into which samples must be transported from distant sampling points. It takes time and the materials are costly. In many cases only the visual monitoring of the water surface and/or water environment is satisfactory. For instance, unusual colour, changes in turbidity and heterogeneous objects on the water surface, such as oil spots, tree branches, dead animals, foam, etc., can indicate environmental problems that consequently have to be solved by common laboratory methods.
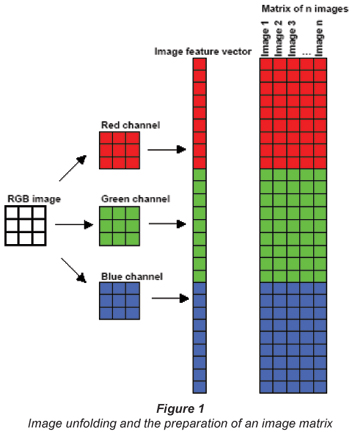
Images contain a large amount of information and have been used by scientists for a long time. Image analysis has been traditionally used in medicine, criminology, in all types of microscopic analysis, aerial and satellite imaging and so forth. The digital images are in fact numerical data, and statistical methods can be used to analyse them. Multivariate image analysis was introduced by Esbensen and Geladi (1989). Principles of this method are described in, for example, a book written by Geladi and Graham (1996). According to this approach an image can be represented by a 3D array (n x m x l) consisting of (n x m) pixels with l spectral channels. For example, a true (RGB) current colour image has 512 x 512 pixels in 3 colours (red, green, blue) that can be transformed into a 512 x 512 x 3 array. The entries in this array are integers between 0 and 255. The 3D array can be resized (unfolded) to a 2D one (matrix) that is n x m by 3. The feature vectors of n x m size summarise the general information of the image. Then, PCA can be performed on this matrix in the usual way.
Traditionally MIA has been used for the analysis of pixel properties. Its applications in food (Yu and MacGregor, 2003), skin properties (Prats-Montalbán et al., 2009) and texture analysis (Bharati at al., 2004), the classification of medical images (Kucharyavski, 2007), chemical analysis (Payne et al., 2005; Lupetti et al., 2005), etc. have been reported in the literature. MIA can be performed using several methodologies, from which PCA based on singular value decomposition (SVD) of the unfolded 2D arrays was found to be the most appropriate method (Prats-Montalbán et al., 2009).
Latent semantic indexing (LSI) method used for the semantic analysis of text documents (Berry et al., 1995 and 1999) is based on a similar idea. A document m x n matrix is composed from n document vectors containing m terms. The n vectors representing the n documents form the columns of the matrix. A matrix document aij is the weighted frequency at which term i occurs in the element j. Thus, the matrix columns are the document vectors and the rows are the term vectors. The LSI steps are the following:
• SVD of a document matrix
• Retrieval of similar transformed document vectors.
Generally, LSI is a useful tool for the retrieval of similarities in text documents. It has also been used for successful human iris recognition and retrieval images (Praks et al., 2003; 2006; 2008a;b). Even though feature image (document) vector creation is very similar in both MIA and LSI, the latter does not deal with one document (image) only, but processes many documents simultaneously, arranged as rows in the large document matrix.
The objective of this research was to use a combined MIA-LSI approach for the retrieval of similar water images. Such application would be useful for image retrieval in large databases and/or for the detection of suspicious abnormalities during surface water quality monitoring by means of digital cameras mounted on the ground, on aeroplanes, or on satellites for earth observations. An image matrix was prepared and consequently treated by SVD-based PCA and the PCA outputs partitioned into clusters of similar images.
Methodology
Image selection
The RGB water, surface, and plant surface images were selected to test MIA-LSI ability to recognise various objects on the water surface. For this purpose a collection of 126 digital photographs displaying details of the water surface and surfaces of other objects on the water was made up to compare various colours and shapes of different natural or artificial objects occurring on the water. The image matrix for the MIA-LSI processing was prepared as described below.
Image unfolding
According to MIA, an RGB image was split into 3 matrices corresponding to red, green, and blue channels and each matrix was further unfolded into a feature vector. In order to obtain 1 large feature vector characterising the entire image we arranged the individual RGB feature vectors into 1 long vector as demonstrated in Fig. 1. These RGB feature vectors were used for the construction of the image matrix X (see Fig. 1). The image matrix was decomposed by SVD and the images now characterised by the largest principal components (singular vectors) were clustered by hierarchical clustering methods.
Principal component analysis
Principal component analysis is a basic multivariate statistical method. The method was first introduced by Karl Pearson (1901) and subsequently developed by Hotelling (1933 a;b). PCA is explained here with minimal statistical theory that is properly explained elsewhere, e.g., in the books of Jollife (2002), Timm (2002), etc.
The main objective of PCA is to look for new latent (hidden) variables that are not correlated to each other. Each latent variable ti (principal component) is a linear combination of p variables and describes a different source of variation:
where:
wi,j and xi,j (1< i < n, 1< j < p) are principal component weight (loading) and original variable (parameter), respectively
The component loadings are the contribution measures of a particular variable to the component. The variability of the principal components is ordered as follows Var(t1) > Var(t2) ... Var(tn). Equations (1) can be rewritten for the data matrix X:

where:
T (n x p) and W (m x p) are the matrices of the principal components and their loadings, respectively. The matrix T contains p columns or main components.
According to Eq. (2) the data matrix X decomposition is performed by several algorithms of linear algebra: non-linear iterative power method (POWER) (Hotteling, 1933a;b), non-linear iterative partial least squares (NIPALS) (Wold et al., 1987), singular value decomposition (SVD), and eigenvalue decomposition (EVD). The efficiency of these algorithms evaluated according to the number of floating point operations decreases in the order: SVD > EVD > NIPALS > POWER (Wu et al., 1997).
Singular value decomposition
SVD computes the singular values associated with the singular vectors corresponding to the principal components by the decomposition of data matrix X (n x p):

where:
U (n x n) and VT (p x p) are orthogonal and normalised matrices, respectively, i.e., UT U = I and VT V = I. S (n x p) is a diagonal matrix of the singular values in decreasing order. The columns of U are the left singular vectors and the rows of VT are the right singular vectors. The k-reduced singular value decomposition reduces X(m x n) matrix to Xk (m x k):

where:
Uk denotes the (m x k) matrix derived from the matrix U by the selection of the k first columns
Sk is the (k x k) diagonal matrix with a diagonal including the k largest singular values
Vk is the (n x k) matrix acquired by the selection of the k columns of V (Berry and Shakhina, 2005)
In other words, SVD approximates X by Xk. The VkT columns contain the transformed values of the original data. The k-approximation of the matrix X is acquired by choosing only the k first singular values of the matrix S while the other values are disregarded.
Cluster analysis
Cluster analysis is an unsupervised learning technique for the classification of data. The data elements are partitioned according to their high similarity or close distance into groups called clusters. The clustering methods are divided into several groups, such as hierarchical, non-hierarchical (k-means, Jarvis-Patrick), fuzzy, medoid, regression clustering, etc. In this study the hierarchical clustering methods were used: nearest neighbour, furthest neighbour, centroid, median, group average, and Ward's method. The theory of clustering algorithms is explained elsewhere, e.g., in a book of Jain and Dubes (1988).
Experimental
RGB images were captured by a Pentax Optio X digital camera. The original JPG images of 2 560 x 1 920 pixels were resized at 256 x 192, 512 x 384, and 768 x 576 pixel images using the programme ACDSee for Pentax, Ver. 5.1.0.0001 (ACD Systems, Ltd., USA). A testing database was made up of 126 images (photographs). All images were unfolded into RGB feature vectors that were used for the construction of the image matrix X according to Fig. 1. PCA of the matrix X was performed by SVD. All image treatments including SVD of X were performed in MATLAB 2008 (The Math Works, Ltd., USA). The Vk values were further treated by hierarchical clustering methods performed by the software package STATGRAPHIC Plus 5.0 (Statistical Graphics Corp., USA). For clustering of the Vk data at k = 100 the programme SCAN, Ver. 1.1. (Minitab, Inc., USA) was used.
Results and discussion
Clustering of 256 x 192 pixels images
The original 2 560 x 1 920 pixel images were resized to 256 x 192 pixel images – this step reduces the storage space on the computer and facilitates processing of such a large image matrix. Some computational parameters are demonstrated in Table 1. The number k of the largest principal components or the singular vectors was estimated from the decrease of the singular values sorted in scree plots (Cattel, 1966) shown in Fig. 2. The steep curve decrease stopped at about k = 6 (Fig. 2a), therefore the 6 largest principal components were extracted from 147 456 pixels. The k-reduced SVD was computed according to Eq. (4) to obtain the Vk matrix, in which each image is characterised by k principal components and can be treated as a point in k-dimensional data space.
The data visualisation by means of 1D, 2D, and 3D plots is the most important property of PCA. When more than 3 principal components are extracted each 2-3 D projection is only an approximation of the reduced dimensionality space. Therefore, the similar images were searched by the hierarchical cluster analysis.
For this purpose, several hierarchical clustering methods were tested: nearest neighbour, furthest neighbour, centroid, median, group average, and the Ward's method. Using the Euclidean distance, the best clustering results were obtained by the Ward's method. This method provided a large number of clusters grouping similar entities together in terms of furthest neighbour and group average methods but with the largest distance between them. Using other distance metrics like the squared Euclidean and Manhattan distances provided no clustering improvement. The Ward's method forms the sample clusters so that the 2 clusters, whose fusion results in minimum increase in information loss, are combined. Information loss was defined by Ward (1963) in terms of an error sum-of-squares criterion, ESS:

where:
xi is an observation i and x is a mean of an observation group
The dendrograms for the different number of k principal components are shown in Fig. 3. They clearly demonstrate that an increase in k leads to the worst cluster separation. The decrease of similar images retrieval efficiency with increasing k value has also been found by Praks et al. (2008b). The dendrograms in Figs. 3a to c were created in STATGRAPHIC Programme. As this programme is limited to 64 variables an old version of the program SCAN was used for k = 100 as well.
The 2 main clusters in Fig. 3a are clearly visible. The dominating colour of objects in the left-hand main cluster is green. Other colours, mostly brown and grey, dominate in images of the right-hand one. These main clusters are further partitioned into a number of sub-clusters according to the sizes and shapes of the displayed objects. For example, the images of brown foam on wastewater in Fig. 4a and stones on the river bottom in Fig. 6a were placed into the different sub-clusters of the right-hand main cluster. However, real images often display mixtures of heterogeneous objects and, therefore, it is hard to sharply distinguish these images and place them into specifically defined groups. In these cases, the images are partitioned according to dominating characters of the objects. Examples of the clustering results are given below in Figs. 4 to 6.
Clustering of 512 x 384 and 768 x 576 pixel images
The influence of the image pixel number on the clustering results was tested by processing the larger images as well. The original images were reduced to 768 x 576 and 512 x 384 pixels. The larger image matrices require the larger computer memory and longer processing time. Therefore, Fourier transformation (FT) built in MATLAB was applied for the reduction of image matrices prior to SVD computed on a common 1 GB RAM desktop computer. For each image size, the lowest FT reduction matching the useable computer memory was determined experimentally. The necessary FT reduction for 512 x 384 pixel images was estimated at 50 %; for 768 x 576 pixel images it was 90% (see Table 1). The final dendrograms of 256 x 192 pixel images and 768 x 576 pixel images were compared with identical outputs. From these findings it follows that the high-resolution images are not necessary for MIA-LSI because of the huge dimensionality reduction to k = 6 principal components.
Verification of the clustering results
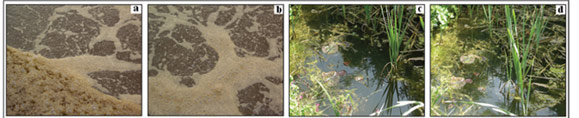
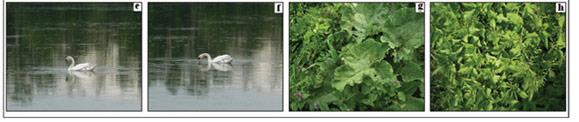
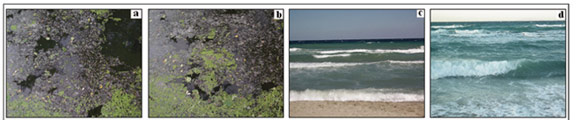
The clustering results were verified by the comparison of the similar images partitioned in the clusters. Each pair of the most similar images discussed below was always placed into a separate cluster. The first set of examples is shown in Fig. 4. The images were selected in order to demonstrate the MIA-LSI possibility to recognise the different shapes and colours of objects on water levels. The Figs. 4a and 4b show a view on an activation tank used in biological wastewater treatment plants. The dominant colour of municipal wastewater is brown. When the tank is aerated, the water surface is covered by various light shapes formed by the foam. Images 4c and 4d display the same water lilies taken from different positions; therefore, some objects including reflections on water are identical in both images. The main object of Figs. 4e and 4f is a swan taken at different times. It indicates the possibility of MIA-LSI to reveal time-dependent processes as was also demonstrated by Praks et al. (2003). Figures 4g and 4h are not related to water. They show green plants with distinctly shaped leaves: burdock (Fig. 4g) and nettle (Fig. 4h). The common feature of these images is the predominantly green colour of the leaves. Taking into account all the above-mentioned image features we can conclude that the images were clustered according to their similar shapes and colours.
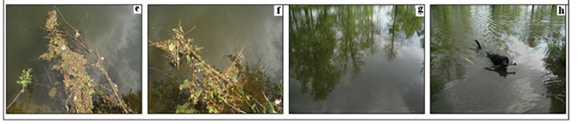
Figure 5 demonstrates another 4 image pairs. Two photographs of water bloom are shown in Figs. 5a and 5b. Sea-water pictures are exhibited in Figs. 5c and 5d. These pictures were added to the testing database because of the quite different face of sea-water, which is typically wavy and blue or blue-green coloured. Small branches fallen on and floating on the river-water surface are visible in Figs. 5e and 5f. The branches are similar in colour and shape. The last pair shows the slowly flowing river with reflections of surrounding trees and a swimming dog. These images demonstrate the data-filtering ability of SVD: the dog image was filtered out as an information noise and thus the images are similar. As well as in the case of Fig. 4 we can state that the image pairs in Fig. 5 were found to be similar due to the similar colours and shapes of displayed objects. In addition, small objects are 'invisible' in MIA-LSI because they are filtered out due to the immense image dimensionality reduction of the image matrix.
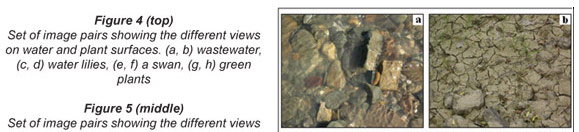
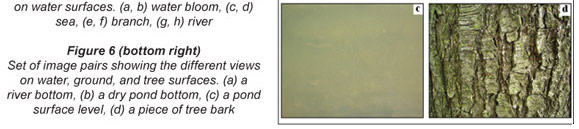
In addition to the successful clustering of the similar images mentioned above dissimilar images were also placed into one cluster. It is difficult to state whether these results are correct or not because the evaluation depends on the different ways of computer and human image recognition. The examples of let us say 'incorrect' clustering are given in Fig. 6.
Figures 6a and 6b were found to be similar. They show some stones on the river bottom and dry pond bottom. On the basis of human experience and knowledge these images are dissimilar because they are displaying the different objects but from the computer viewpoint both images contain many pixels of similar colours and therefore they were found to be similar. Other examples demonstrated in Figs. 6c and 6d were also identified as similar but they show a smooth pond surface and a piece of tree bark, respectively. In both cases the majority of pixels have the same or very similar colour except for darker ones creating the contours of bark segments. Information of these differently coloured minority pixels was probably removed during the dimensionality reduction of X and thus both images became similar for MIA-LSI. Figure 6 also documents the property of MIA-LSI to ignore details and/or small objects in the images.
Conclusion
The MIA-LSI approach was used for the clustering of surface water and other related images. The real surface water images are very complex because they often display mixtures of heterogeneous objects, such as water level, vegetation, stones and various floating objects. The image matrix was created and then reshaped by PCA using the SVD method. The appropriate number k = 6 of the principal components was extracted from 256 x 192 x 3 = 147 456 pixels using the singular-value scree plot. The transformed k-reduced image matrix was analysed by Ward's clustering method, which gives the best clustering results. The particular findings are:
• Images containing thousands of pixels (variables) can be represented by only a few principal components
• Image resolution (number of pixels) is not important for the clustering efficiency because of the huge dimensionality reduction of the image matrix
• During the dimensionality reduction small objects are removed from images
• Increasing k causes worse cluster separation
• Images are partitioned into the main clusters according to the dominant colours of displayed objects. The main clusters are further partitioned into sub-clusters according to similar shapes and sizes of the objects.
MIA-LSI provides a potential application for environmental monitoring. It could be used for the automatic computer-aided visual monitoring of surface water quality by means of digital images. This method is able to retrieve similar images in large databases. Its application for the detection of dissimilarities causing unexpected events or abnormalities in the images of water levels will be investigated in the near future.
Acknowledgements
This work was partially supported by the Ministry of Education, Youth and Sport of the Czech Republic (Project No. 1M06047).
References
BERRY WM, DRMAČ Z and JESSUP JR (1999) Matrices vector spaces and information retrieval. SIAM Rev. 41 (2) 336-362. [ Links ]
BERRY WM, DUMAIS ST and O'BRIEN GW (1995) Using linear algebra for intelligent information retrieval. SIAM Rev. 37 (4) 573-595. [ Links ]
BERRY WM and SHAKHINA AP (2005) Computing sparse reduced-rank approximation to sparse matrices. ACM Trans. Math. Software 31 (2) 252-269. [ Links ]
BHARATI MH, LIU JJ and MACGREGOR JF (2004) Image texture analysis: methods and comparison. Chemom. Intell. Lab. Syst. 72 (1) 57-71. [ Links ]
JAIN AK and DUBES RC (1988) Algorithms for Clustering Data. Prentice Hall, New Jersey. 320 pp. [ Links ]
KUCHERYAVSKI S (2007) Using hard and soft models for classification of medical images. Chemom. Intell. Lab. Syst. 88 (1) 100-106. [ Links ]
GELADI P and ESBENSEN P (1989) Strategy of multivariate image analysis (MIA). Chemom. Intell. Lab. Syst. 7 (1-2) 67-86. [ Links ]
GELADI P and GRAHAM H (1996) Multivariate Image Analysis. John Wiley and Son, New York. 316 pp. [ Links ]
HOTELLING H (1933a) Analysis of a complex of statistical variables into principal components. J. Educ. Psychol. 24 (6) 417-441. [ Links ]
HOTELLING H (1933b) Analysis of a complex of statistical variables into principal components. J. Educ. Psychol. 24 (7) 498-520. [ Links ]
JOLLIFFE IT (2002) Principal Component Analysis (2nd edn.). Springer-Verlag, New York. 524 pp. [ Links ]
LUPETTI KO, de CARVALHO LC, DE MOURA AF and FATIBELLO-FILHO O (2005) Image analysis in analytical chemistry: Didactic and simple methodologies to understand and prevent browning of vegetable tissues. Quim. Nova 28 (3) 548-554. [ Links ]
PAYNE G, WALLACE CH, REEDY B, LENNARD CH, SCHULER R, EXLINE D and ROUX C (2005) Visible and near-infrared chemical imaging methods for the analysis of selected forensic samples. Talanta 67 (2) 334-344. [ Links ]
PEARSON K (1901) On lines and planes of closest fit to systems of points in space. Philos. Mag. 2 559-572. [ Links ]
PRAKS P, DVORSKÝ J and SNÁŠEL V (2003) Latent semantic indexing for image retrieval systems. Proc. SIAM Conf. on Applied Linear Algebra. 15-19 July, Williamsburg, USA. http://www.siam.org/meetings/la03/proceedings/Dvorsky.pdf (Accessed December 2, 2009). [ Links ]
PRAKS P, MACHALA L and SNÁŠEL V (2006) On SVD-free latent semantic indexing for iris recognition of large databases. In: VA Petrushin and L Khan (eds.) Author to confirm Multimedia Data Mining and Knowledge Discovery. Springer Verlag, London, UK. 472-486. [ Links ]
PRAKS P, KUCERA R and IZQUIERDO E (2008a) The sparse image representation for automated image retrieval. Proc. IEEE Int. Conf. Image Processing. 12-15 October, San Diego, USA. 25-28. [ Links ]
PRAKS P, SVÁTEK V and ČERNOHORSKÝ J (2008b) Linear algebra for vision-based surveillance in heavy industry – convergence behaviour case study. Proc. IEEE CBMI 2008 – 6th Int. Workshop on Content-Based Multimedia Indexing. 18-20 June, Queen Mary, London, UK. 346-352. [ Links ]
PRATS-MONTALBÁN JM, FERRER A, BRO R and HANCEWICZ T (2009) Prediction of skin quality properties by different Multivariate Image Analysis methodologies. Chemom. Intell. Lab. Syst. 96 (1) 6-13. [ Links ]
TIMM NH (2002) Applied Multivariate Analysis. Springer Verlag, New York. 720 pp. [ Links ]
WARD JH (1963) Hierarchical grouping to optimize an objective function. J. Am. Stat. Assoc. 58 (1) 236-244. [ Links ]
WOLD S, Esbensen K and Geladi P (1987) Principal component analysis. Chemom. Intell. Lab. Syst. 2 (1-3) 37-52. [ Links ]
WU W, MASSART DL and de JONG S (1997) The kernel PCA algorithms for wide data. Part I: theory and algorithms. Chemom. Intell. Lab. Syst. 36 (2) 165-172. [ Links ]
YU and MACGREGOR (2003) Multivariate image analysis and regression for prediction of coating content and distribution in the production of snack foods. Chemom. Intell. Lab. Syst. 67 (2) 125-144. [ Links ]
Received 17 July 2009; accepted in revised form 25 November 2009.
* To whom all correspondence should be addressed
( +420-59-732-3370; fax: +420-59-732-3370
e-mail: petr.praus@vsb.cz

