


Services on Demand
Article
 English (pdf)
 Article in xml format
 Article references
Indicators

Related links
-
 Cited by Google
 -
 Similars in Google
Share

 Permalink
Water SA
On-line version ISSN 1816-7950
Print version ISSN 0378-4738
Water SA vol.36 n.1 Pretoria Jan. 2010
Characterisation of rainfall at a semi-arid ecotope in the Limpopo Province (South Africa) and its implications for sustainable crop production
Jestinos MzezewaI,*; Titus MisiII ; Leon D van RensburgIII
IDepartment of Soil Science, University of Venda, P/Bag X5050,Thohoyandou 0950 South Africa
IIDepartment of Statistics, University of Venda, P/Bag X5050, Thohoyandou 0950, South Africa
IIIDepartment of Crop, Soil and Climate Sciences, University of the Free State, PO Box 339, Bloemfontein 9300, South Africa
ABSTRACT
Detailed knowledge of rainfall regime is an important prerequisite for agricultural planning. Despite the importance of rain-fed agriculture to food security in the semi-arid regions of South Africa, studies to understand the spatial and temporal variability of rainfall are not widely documented. Twenty-three years (1983 to 2005) of rainfall data were analysed in order to study the basic statistical rainfall characteristics at the University of Venda ecotope. Annual and monthly rainfall was fitted to theoretical probability distributions. The Anderson-Darling goodness-of-fit test was used to evaluate best fit models. Probability of receiving annual and monthly rainfall was predicted using the appropriate probability distribution functions. The chance of experiencing dry spells of different durations was determined. Cumulative frequency analysis of daily rainfall amounts and depths was characterized. It was found that the distribution of daily rainfall was highly skewed with high frequency of occurrence of low-rainfall events. The distribution of daily rainfall depths was also highly skewed, a comparatively small proportion of rainy days supplying a high proportion of the rainfall.
Keywords: dry spells, ecotope, Limpopo, semi-arid, temporal rainfall analysis.
Introduction
Climate plays an important role in biomass production. Extreme climatic conditions and high inter-annual/ seasonal variability of climatic parameters could adversely affect productivity (Li et al., 2006) because rainfall governs the crop yields and determines the choice of the crops that can be grown. The pattern and amount of rainfall are among the most important factors that affect agricultural systems. The analysis of rainfall records for long periods provides information about rainfall patterns and variability (Lazaro et al., 2001).
Drought mitigation can be planned by understanding daily rainfall behaviour (Aghajani, 2007). Dry spell analysis assists in estimating the probability of intra-season drought and management practices can be adjusted accordingly (Tesfaye and Walker, 2004; Kumar and Rao, 2005). It is of importance to know how long a wet spell is likely to persist, and what the probabilities are of experiencing dry spells of various durations at critical times during the growing season (Dennet, 1987; Sivakumar, 1992).
Probability distributions are widely used in understanding the rainfall pattern and computation of probabilities (Abdullah and Al-Mazroui, 1998) and it is believed that events follow particular types of distributions (Tilahun, 2006). The normal distribution is one of the most important and widely used in rainfall analysis (Kwaku and Duke, 2007). Despite the wide applicability of the normal distribution there remain many instances when observed distributions are neither normal nor symmetrical. It has been observed that rainfall is not necessarily normally distributed (Stephens, 1974) except in wet regions (Edwards et al., 1983). Jackson (1977) has emphasized that annual rainfall distributions are markedly skew in semi-arid areas and the assumption of normal frequency distribution for such areas is inappropriate. Research elsewhere has shown that rainfall can also be described by other distributions, e.g. Gamma distribution (Abdullah and Al-Mazroui, 1998; Aksoy, 2000; Garcia et al., 2007), the log-Pearson Type III distribution (Chin-Yu Lee, 2005), and the Weibull and Gumbel distributions (Tilahun, 2006).
One of the reasons for low crop production in semi-arid areas is marginal and erratic rainfall, exacerbated by high runoff and evaporation losses. The in-field rainwater-harvesting technique as proposed by Hensley (2000) has been shown to improve the yield of maize and sunflower on some benchmark ecotopes in South Africa. There has been increasing interest recently in South Africa of making crop production less risky and sustainable in semi-arid ecotopes through in-field rainwater harvesting (Botha et al., 2003). The ecotope at the University of Venda in Thohoyandou is one of the areas where such studies have not been carried out. An ecotope is defined as a homogeneous piece of land with a unique combination of climate, topographic and soil characteristics (Hensley et al. 2000). In order to understand the feasibility of establishing a water-harvesting system, rainfall analysis and the identification of prevailing rainfall patterns is required (Dennet, 1987; Rappold, 2005). The main objective of this paper was to analyse the 1983 to 2005 rainfall records from the weather station in Thohoyandou (Limpopo Province, South Africa) as a basis for future studies on sustainability of crop production in general and in-field rainwater harvesting in particular. The approach to data analysis was largely similar to those of other authors such as Belachew (2002) and Tilahun (2006). The latter served as the main reference for our work.
Materials and methods
Geographical setting
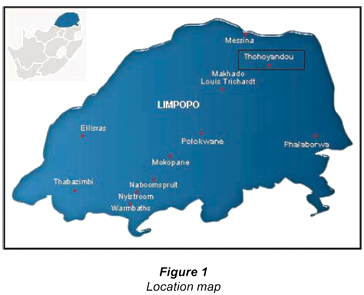
The study area was at the ecotope at the University of Venda (Univen) (22º58' S, 30º26' E; 596 m a.m.s.l.) in Thohoyandou, 70 km east of Louis Trichardt in the Limpopo Province of South Africa (Fig. 1).
The study area falls in the Lowveld of the province which forms part of the greater Limpopo River basin, situated in the east of Southern Africa between about 20 and 26º S latitude and 25 and 35º E longitude (FAO, 2009). According to the Koppen Classification the basin is predominantly semi-arid (Mmarete, 2003). Daily temperatures at Thohoyandou vary from about 25˚C to 40ºC in summer and between 22˚C and 26ºC in winter. Rainfall is highly seasonal with 95% occurring between October and March (Mmarete, 2003), often with a mid-season dry spell during critical periods of growth (FAO, 2009). Midsummer drought often leads to crop failure and low yields (Beukes et al., 1999). Average rainfall is about 800 mm but it often varies temporarily.
Soils of the ecotope are predominantly deep (>1 500 mm), dystrophic, red and yellow well-drained clays with apedal structure. Clay content is generally high (60%) and soil reaction is acidic (pH 5). The soils are formed in situ. They are classified as Hutton form (South African System of Soil classification) (Soil Classification Working Group, 1991), Rhodic Eutrustox (Soil Survey Staff, 2006) or Rhodic Ferralsol (WRB, 2006).
Data
Daily rainfall data were obtained from the South African Weather Service. Daily reference evapotranspiration records were provided by the Agricultural Research Council (ARC) of South Africa. Missing data were obtained from neighbouring stations (Tsianda and Gooldville). A 23 year-old rainfall record (1983 to 2005) was analyzed. Annual and monthly totals were calculated from daily rainfall records. Years with missing data were not included in the calculations of averages. Where consecutive months had no recorded rain, these records were considered to indicate missing records and were not included in the calculations of averages. This was so for 1982, 2006 and 2007.
A standard method of analysing of rainfall data for agricultural purposes that involved first summarising the daily data to give monthly and then annual totals (Abeyasekera et al., 1983) was followed. The main reason for totalling the daily data has been that the volume of data to be handled subsequently is greatly reduced and data normality would be assumed (Stern et al., 1982).
Methods of data analysis
Probability distributions of annual and monthly rainfall
In this study it was important to identify the probability distributions of rainfall data. In order to determine the underlying distribution, the observed distributions were fitted to theoretical probability distribution by comparing the frequencies observed in the data with the expected frequencies of the theoretical distribution since certain types of variables follow specific distributions (Tilahun, 2006).
Preliminary data normality was tested using skewness and kurtosis coefficients. Probability distributions were evaluated by constructing probability plots and curve fitting in Minitab 14 statistical software.
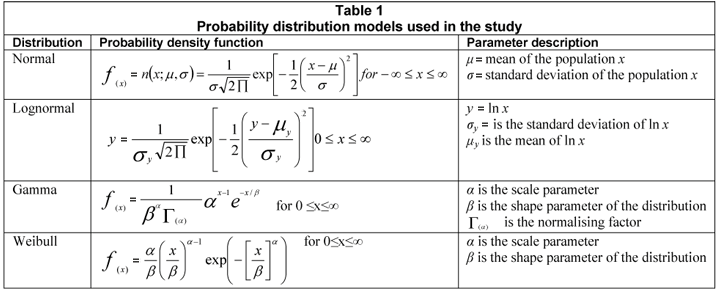
Goodness-of-fit tests were based on the Anderson-Darling test (Stephens, 1974). The Anderson-Darling statistic measures how well the data follow a particular distribution. The better the distribution fits the data, the smaller this statistic is. The corresponding p-value is used to test whether the data come from a chosen distribution. If the p-value is less than 0.05, the null hypothesis that the data come from that distribution is rejected. The p-value with the greatest magnitude was considered to be the best fit. If the p-value was the same, the smallest AD value was then used to decide the best fit. Rainfall data from October to March were considered in fitting distributions. The rest of the monthly rainfall data were not considered due to limited non-zero values. The normal distribution, lognormal distribution, Gamma and Weibull distributions were tested (Table 1). Fitted distributions are shown in Fig. 3.
Aridity index (AI)
An aridity index (AI) is a numerical indicator of the degree of dryness of the climate at a given location (Thornthwaite, 1948). The agro-climatic zonation of the meteorological study area was determined using the UNESCO (1979) AI given as:
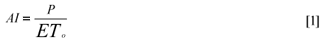
where:
P is the mean annual rainfall
ETO is the mean annual reference evapotranspiration
According to this classification, P/ETO<0.03 is hyper-arid zone, 0.03<P/ETO<0.20 is an arid zone, and 0.20<P/ETO<0.50 is semi-arid zone, and >0.5 is subhumid. Mean annual rainfall P and ETO was calculated from meteorological stations used in this study.
Exceedance probability of annual and monthly rainfall
This is the probability that a given amount of rainfall is exceeded. The probability of exceedance of annual and monthly rainfall was calculated from the respective rainfall distributions. This information is important regarding choice of crops because each crop has a specific water requirement to take it through the growth cycle (Rappold, 2005). The information is also vital for designing appropriate water storage facilities for supplementary irrigation.
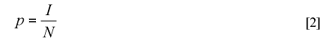
Probability of dry spells
In this study, a dry day is a day with rainfall of less than 1 mm. A dry spell is a sequence of dry days bracketed by wet days on both sides (Kumar and Rao, 2005). A method for frequency analysis of dry spells in this study was adapted from Belachew (2002) as follows: in the Y years of records, the number of times i that a dry spell of duration t days occurs was counted on a monthly basis. Then the number of times I that a dry spell of duration longer than or equal to t occurs was computed through accumulation. The consecutive dry days (1 d, 2 d, 3 d ) were prepared from historical data. The probabilities of occurrence of consecutive dry days were estimated by taking into account the number of days in a given month n. The total possible number of days, N, for that month over the analysis period was computed as, N = n*Y. Subsequently the probability p that a dry spell may be equal to or longer than t days was given by:
Cumulative frequency and cumulative depth of daily rainfall
Cumulative frequency analysis is the analysis of the frequency of occurrence of values of a phenomenon less than a reference value. The distribution of daily rainfall totals by amount and frequency was obtained by using frequency analysis of historic daily rainfall data. Frequency distribution was then put into a Cumulative Probability Distribution Function (CDF). The CDF was then weighted by event depth to create a depth-weighted frequency curve.
Results and discussion
Annual and monthly rainfall statistics
The statistical parameters for both the annual rainfall and monthly rainfall data are summarised in Table 2, where the mean, standard deviation, coefficient of variation, skewness and kurtosis are given. The skewness and kurtosis coefficients for a normal distribution are zero or near zero. Skewness and kurtosis coefficients indicated that annual rainfall approximated a normal distribution. This was further confirmed by the p-value (0.468) of the Anderson-Darling (AD) test (Table 3). The data indicated that monthly rainfall was strongly skewed to the right (high positive values of skewness coefficients) and highly leptokurtic, a phenomenon common in semi-arid regions.
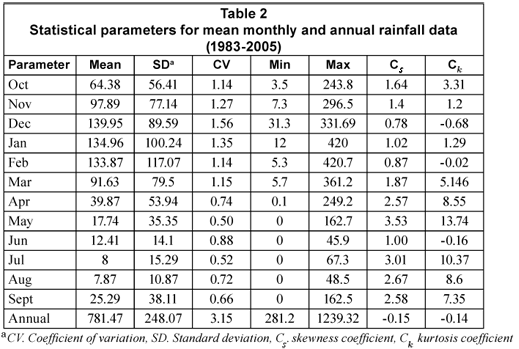
The yearly rainfall analysis indicated that the mean annual rainfall at the University of Venda was about 781 mm with a standard deviation of 248 mm. Coefficient of variation (cv) of annual rainfall was high (315%). This showed a very high variability of rainfall from year to year.
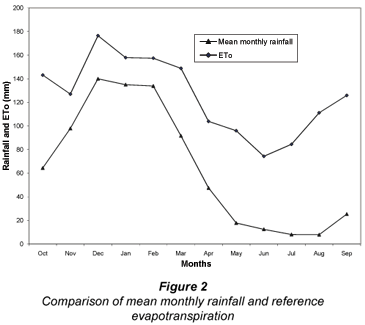
Monthly rainfall analysis indicated that the site receives about 80% of annual rainfall during the months of October to March (Fig. 2). This result is similar to the findings of Tyson (1986) who reported a similar rainfall pattern in the interior regions of South Africa. December was the wettest month with an average of about 140 mm rainfall. July and August were the driest months with an average of about 8 mm rainfall. During the rainy season (October-March), there was pronounced variability in rainfall from one month to another as shown in Table 2. The coefficient of variation and standard deviation for the analysis period ranged from 114 to 156 %, and 56.41 mm to 117.07 mm, respectively, confirming the great variability in mean monthly rainfall at the study site.
High coefficients of variation are not uncommon in semi-arid environments. FAO (2009) reported a coefficient of variation of annual rainfall of 40% in the Limpopo River basin of Zimbabwe and Mozambique. At Kranskop in the Limpopo Province (South Africa), Kosgei (2009) reported a coefficient of variation of annual rainfall of 25%. Lynch et al. (2001) reported high annual rainfall variability at Potchefstroom (North West Province, South Africa) with a coefficient of variation of 26% for rainfall recorded over 74 years.
Agro-climatic zonation
The AI represents climatic aridity and is used to determine the adequacy of rainfall in satisfying the water needs of the crop (Tsiros et al., 2008). The AI calculated using Eq. (1) was 0.52. Based on the UNESCO classification criteria, the study area is on the borderline between semi-arid and subhumid. The area receives low rainfall and experiences high evapotranspiration. The relationship between potential evapotranspiration (ETo) and mean monthly rainfall is shown in Fig. 2. ETO was always higher than rainfall throughout the year. This meant that rainfall was not effective at the study site. Research results worldwide show that approximately 70 % of annual rainfall is lost due to evaporation from the soil in semi-arid regions (Jalota and Prihar, 1990). Similar results were obtained in South Africa (Hoffman, 1990; Botha et al., 2003). Therefore, in order to maximise the utilisation of rainfall, some more effective practices have to be adopted to reduce unproductive evaporation loss (Li et al., 2006).
Probability distributions of annual and monthly rainfall
Annual and monthly rainfall data were fitted to 4 probability distribution functions, i.e. the normal, lognormal, Gamma and the Weibull distributions. The respective parameters of the distribution functions were determined and presented in Table 3. The values of the AD goodness-of-fit test and associated p-values are also presented in the table. Based on the AD goodness-of-fit and p-values, annual rainfall is best described by the normal distribution. Using the same criteria monthly rainfall is best described by the theoretical distributions as indicated in parenthesis as follows: October (lognormal), November (lognormal), December (lognormal), January (Weibull), February (Weibull), March (Gamma). Out of the considered 6 months of the rainy season, half of them are best described by the lognormal distribution. In his study in Ethiopia, Tilahun (2006) found that most of the monthly rainfall was best described by the lognormal distribution and annual rainfall by the Weibull, Gumbel and Gamma distribution. In semi-arid Kenya the annual rainfall could be approximated by a normal distribution (Rowntree, 1989). Figure 3 shows the fitted CDF curves.
Exceedance probability of annual and monthly rainfall
Probability of receiving rainfall exceeding various amounts was calculated from the respective distribution curves. Table 4 summarises the probability of receiving annual rainfall at the University of Venda.
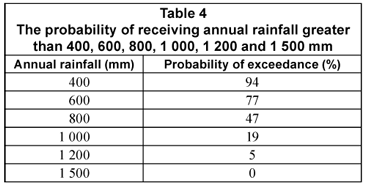
It can be observed that the probability of exceeding various amounts of annual rainfall diminished as the threshold rainfall amount increased. For example, there was 94% chance of receiving rainfall greater than 400 mm whilst the chance of having more than 1 500 mm was zero. There was 47% probability of exceeding 800 mm of annual rainfall. The mean annual rainfall for the site was about 800 mm. This result means that almost 50% of the recorded rainfall was below average.
Table 5 summarises the probability of receiving monthly rainfall of greater than certain threshold amounts. Probability was computed from best-fit CDF of respective months as follows: October (lognormal), November (lognormal), December (lognormal), January (Weibull), February (Weibull), March (Gamma). There were almost equal chances of receiving rainfall equal to or greater than 5 mm from October to March, save the month of February with 72% chance. The probability decreased as the monthly rainfall threshold increased. The probability of receiving high rainfall (>100 mm) was greatest in December (58%) and lowest in the month of October (20%). This again reaffirms that December is the wettest month at the University of Venda A 35% chance of receiving a rainfall amount of equal to or greater than 100 mm was recorded in March, which confirms earlier reports that rainfall in South Africa occurs between October and March (Landman and Klopper, 1998). The chance of receiving a rainfall amount of equal to or exceeding 200 mm increased from October to February and then decreased to a low of 9% in March. There was very little chance (0% to 2%) of receiving rainfall amounts equal to or exceeding 500 mm and 600 mm from October to March.
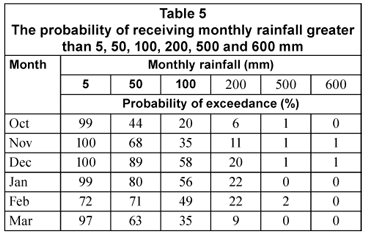
A study in Kenya by Rowntree (1989) defined reliable rainfall as that annual rainfall with an exceedance probability of 80% for upland cultivators. According to this definition, high rainfall (>100 mm) is not reliable at this site.
Frequency and probability of dry periods
The occurrence of dry spells has particular relevance to rain-fed agriculture, as rainfall is one of the major requirements for plant life in rain-fed agriculture (Belachew, 2002; Rockstrom et al., 2002). The occurrence of dry spells is summarised in Fig. 4.
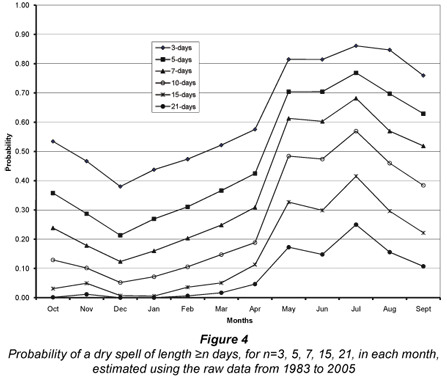
The probability of occurrence of dry spells of various durations varied from month to month. It can be observed that lowest probabilities of occurrence of dry spells of all durations were recorded in the month of December. Generally the occurrence of dry spells of all durations decreased from October to March. This period coincides with the rainy season in South Africa (Lynch et al., 2001; Kosgei, 2009). The probability of having a dry spell increases with the shorter periods (i.e. more chance of having a 3 d dry spell than a 10 d or 21 d dry spell). For example in December, there was a 20% probability of having a dry-spell duration of 5 d and 0% chance of having a dry-spell duration of 21 d. This trend is in line with that reported by several workers, e.g. Kosgei (2009) at Kranskop (South Africa), Aghajani (2007) in Iran and Sivakumar (1992) in West Africa
Cumulative frequency and cumulative depth of daily rainfall
Frequency distribution was highly skewed with storms of less than 5 mm accounting for the greatest proportion of rainy events. Cumulative annual distribution of daily rainfall is summarised in Fig. 5 which shows both the frequency distribution of rainfalls producing various rainfall amounts and estimates of the percentage of annual rainfall falling in daily rainfall within each class. Clearly a large proportion of the events were smaller storms. The distribution of daily rainfall depths was highly skewed, a comparatively small proportion of the rain-days contributing a high proportion of the rainfall. In this study it was observed that 97% of the daily rainfall events had values of less than 20 mm but accounted for only 54 % of the total rainfall. Though infrequent, heavier rainfall events form a significant percentage of the total rainfall. In South Africa, Harrison (1983) found that only 13% of all rain days in the eastern Free State are responsible for 50% of the rainfall and only 27% contributed 75% of the total rainfall, whereas the lowest 50% of all rainy days produce as little as 7% of the rainfall. Li and Gong (2002) reported similar results in semi-arid China. It can be observed from Fig. 5 that 4% of the daily rainfall events and 45% of the total rainfall amounts are equal to or exceed the 15 mm required for rain-water harvesting (Tilahun, 2006).

Implications for crop production
Information on rainfall amount and variability is important for improved decisions concerning choice of crops and crop varieties to grow on the ecotope. Knowledge of month-wide distribution of rainfall is also important because it tells how much water is available for the biomass in rain-fed areas. Rastegar (1993), cited by Aghajani (2007), determined that the threshold of rain-fed agriculture is 250 mm rainfall. The mean annual rainfall at this site was found to be 781 mm and showed great variability (315%). Monthly rainfall also showed a high variability. The amount of rain during the growing season is important for the crop to give the highest yield. For example, optimum rainfall for maize is between 500 mm and 800 mm (Ovuka and Linqvist, 2000). However, the probability of exceeding 800 mm of rainfall is 47% (Table 4). This makes it risky to produce less drought-tolerant crops like maize (Sivakumar, 1992) unless water-harvesting measures are implemented.
There is a 50% chance of receiving 50 mm of rainfall in October such that water harvesting can be practised to capture the rainfall and store it in the soil profile to be used later for early planting. Benefits of doing this could, however, fail to be realised due to excessive water losses from the soil profile by evaporation (Hensley et al., 2000)
Information on probability of exceedance of rainfall is important in designing water conservation and/or harvesting structures. In order to be efficient, water-harvesting structures should be constructed in proportion to the amount of water that can be expected during a rainfall event (Schiettecatte, 2005).
High evaporative demand as indicated by the AI of 0.52 at this site means that most of the rain is not available for crop use and rain cannot meet demands of evaporation; therefore deficit prevails throughout the rainy season, as observed elsewhere (Li et al., 2006). Water harvesting, based on the collection of runoff from prepared catchment surface and stored in the crop rooting zone could be used to increase rain-water use efficiency, as demonstrated by Botha et al. (2003). Various mulches can be employed to minimise further water losses due to soil evaporation (Hensley et al., 2000; Botha et al., 2003; Li et al, 2006). In the arid and semi-arid regions, where moisture is available for a relatively short period during the year, it is essential to match the crop phenology with dry-spell lengths to meet the crop water requirements during the sensitive stages of crop growth (Sivakumar, 1992).
Information on the length of dry spells could be used as a guide for planning supplementary irrigation because high water-demand periods can be predicted. Choice of a crop or crop variety can be made based on the length of dry spells. For example the probability of dry spells lasting longer than 15 d is very low during the rainy season at this site. Crops can be selected based on their degree of tolerance to drought (Sivakumar, 1992). However, decisions can be better made if the probability of dry spells is computed after effective (successful) planting dates (Sivakumar, 1992; Belachew, 2002). Bridging dry spells through in situ rain-water harvesting is a viable option in rain-fed crops (Rockstrom et al., 2002; Schiettecatte et al., 2005; Li et al., 2006). Barron and Okwach (2005) noted that it is the natural occurrence of dry spells due to high variation in rainfall distribution and amounts during the season that limits crop development and results in yield reductions.
Conclusions
The statistical analysis of rainfall at the study site has revealed that the rainfall is highly unreliable, making crop production very risky. Water for crop growth is available for limited periods and the chances are high that soil moisture may be lost by evaporation. The scope of making crop production sustainable lies in adopting water conservation practices and irrigation. In-field rainwater harvesting can be implemented to reduce the risks of crop production. Careful selection of crop cultivars is needed. Studies on rainfall analysis in combination with water balance studies need to be undertaken in order to determine appropriate planting dates and the length of growing seasons. Probability of occurrence of dry spells can improve planning if computed after successful planting dates. The limitation of the study is that only a single data point was used and the validity of the conclusion is constrained by the limited areal extent.
Acknowledgements
Weather data used in this study were provided by South African Weather Service and the Agricultural Research Council (ARC). We are very grateful to Mr Moses Marenya for providing Minitab statistical software and Mrs Memory Mzezewa for assisting with data analysis.
References
ABDULLAH MA and AL-MAZOUI MA (1998) Climatological study of the south western region of Saudi Arabia. I. Rainfall analysis. Clim. Res. 9 213-223. [ Links ]
ABEYASEKERA S, SENEVIRATNE EK, LEAKER A and STERN RD (1983) The analysis of daily rainfall for agricultural purposes. J. Natn. Sci. Counc. Sri Lanka 11 (2) 165-183. [ Links ]
AGHAJANI GH (2007) Agronomical Analysis of the characteristics of the precipitation (Case study: Sazevar, Iran). Pakistan J. Biol. Sci. 10 (8) 1353-1358. [ Links ]
AKSOY H (2000) Use of gamma distributions in hydrological analysis. Turk. J. Eng. Environ. Sci. 24 419-428. [ Links ]
BARRON J and OKWACH G (2005) Run-off water harvesting foe dry spell mitigation in sunflower (Zea mays L.): results from on-farm research in semi-arid Kenya. Agric. Water Manage. 74 (1) 1-21. [ Links ]
BELACHEW A (2000) Dry-spell analysis for studying the sustainability of rain-fed agriculture in Ethiopia: The case of the Arbaminch area. Proc. 8th Nile 2002 Conf. 22 June 2002, Addis Ababa, Ethiopia. International Commission on Irrigation and Drainage (ICDID). [ Links ]
BEUKES DJ, BENNIE ATP and HENSLEY M (1999) Optimization of soil water use in the dry crop production areas of South Africa. In: N van Duivenbooden, M Pala, C Studer and CL Bielders (eds.)Proc. of the 1998 (Niger) (April 26-30 April) and 1999 (Jordan) (May 9-13) Workshops of the Optimizing Soil Water Use (OSWU) Consortium, entitled: Efficient Soil Water Use: The Key to Sustainable Crop Production in the Dry Areas of West Asia, and North and Sub-Saharan Africa. Aleppo, Syria: ICARDA; and Patancheru, India: ICRISAT. 165-191. [ Links ]
BOTHA JJ, VAN RENSBURG LD, ANDERSON JJ, HENSLEY, M, MACHELI MS, VAN STADEN PP, KUNDLANDE G, GROENEWALD DG and BAIPHETHI MN (2003) Water Conservation Techniques on Small Plots in Semi-Arid Areas to Enhance Rainfall Use Efficiency, Food Security, and Sustainable Crop Production. WRC Report No. 1176/1/03. Water Research Commission, Pretoria, South Africa. [ Links ]
CHIN-YU LEE (2005) Application of rainfall frequency analysis on studying rainfall distribution characteristics of Chia-Nan Plain area in southern Taiwan. Crop Environ. Bioinf. 2 31-38. [ Links ]
DENNETT MD (1987) Variation of rainfall-the background to soil and water management in dryland regions. Soil Use Manage. 3 (2) 47-51. [ Links ]
EDWARDS KA, CLASSEN GA and SCHROTEN EHJ (1983) The Water Resource in Tropical Africa and its Exploitation. ILCA Research Report No. 6. Available online: http://ww.fao.org/wairdocs/ilri/x5524e/x5524e00.htm#contents (Accessed on 6 March 2009). [ Links ]
FAO (2009) Climate and Rainfall. http://wwww.fao.org/wairdocs/ilri/x5524e/x5524e03.htm (Accessed on 26 February 2009). [ Links ]
GARCIA M, RAES D, JACOBSEN SE AND MICHEL T (2007) Agroclimatic constraints for rainfed agriculture in the Bolivian Altipano. J. Arid Environ. 71 (1) 109-121. [ Links ]
HARRISON MSJ (1983) Rain-day frequency and mean daily rainfall intensity as determinants of total rainfall over the Eastern Orange Free State. J. Clim. 3 35-45. [ Links ]
HENSLEY M, BOTHA JJ, ANDERSON JJ, VAN STADEN PP and DU TOIT A (2000) Optimizing Rainfall Use Efficiency for Developing Farmers with Limited Access to Irrigation Water. WRC Report No. 878/1/00. Water Research Commission, Pretoria, South Africa. [ Links ]
HOFFMAN JE (1990) The Influence of Soil Cultivation Practices on the Water Balance of a Avalon Soil with Wheat at Bethlehem. M.Sc. Agric. Thesis, Univ. of the Free State, Bloemfontein, South Africa. [ Links ]
JACKSON IJ (1977) Climate, Water and Agriculture in the Tropics. Longman, New York. [ Links ]
JALOTA SK. and PRIHAR SS (1990) Bare soil evaporation in relation to tillage. Adv. Soil Sci. 12 187-216. [ Links ]
KOSGEI JR (2008) Rainwater Harvesting Systems and their Influences on Field Scale Soil Hydraulic Properties, Water Fluxes and Crop Production. Ph.D. Thesis. University of KwaZulu-Natal, Pietermaritzburg, South Africa. [ Links ]
KUMAR KK and RAO TVR (2005) Dry and wet spells at Campina Grande-PB. Rev. Brasil. Meteorol. 20 (1) 71-74. [ Links ]
KWAKU XS and DUKE O (2007) Characterization and frequency analysis of one day annual maximum and two five consecutive days' maximum rainfall of Accra, Ghana. ARPN J. Eng. Appl. Sci. 2 (5) 27-31. [ Links ]
LANDMAN WA and KLOPPER E (1998) 15-year simulation of the December to March rainfall season of the 1980s and 1990s using canonical correlation analysis (CCA). Water SA 24 (4) 281-286. [ Links ]
LAZARO R, RODRIGO FS, GUTIERREZ L, DOMINGO F and PUIGDEFAFREGAS J (2001) Analysis of a 30-year rainfall record (1967-1997) in semi-arid SE Spain for implications on vegetation. J. Arid Environ. 48 373-395. [ Links ]
LI X-Y and GONG J-G (2002) Compacted microcatchments with local earth materials for rainwater harvesting in the semiarid regions of China. J. Hydrol. 257 (1-4) 134-144. [ Links ]
LI X-Y, SHI, P-J, SUN Y-L, TANG J and YANG Z-P (2006) Influence of various in-situ rainwater harvesting methods on soil moisture and growth of Tamarix ramosissima in the semiarid loess region of China. For. Ecol. Manage. 23 (1) 143-148. [ Links ]
LYNCH SD, ZULU JT, KING KN and KNOESEN DM (2001) The analysis of 74 years of rainfall recorded by the Irwins on two farms south of Potchefstroom. Water SA 27 (4) 559-564. [ Links ]
M'MARETE CK (2003) Climate and water resources in the Limpopo Province. In: Nesamvuni AE, Oni SA, Odhiambo JJO and Nthakheni ND (eds.) Agriculture as the Cornerstone of the Economy in the Limpopo Province. A study commissioned by the Economic Cluster of the Limpopo Provincial Government under the leadership of the Department of Agriculture. 1-49. [ Links ]
MEBRHATU MT, TSUBO M and WALKER S (2004) The characteristics of daily and monthly rainfall for decision support system. Proc. 4th Int. Crop Sci. Congress. September 4, Brisbane, Australia. [ Links ]
OVUKA M and LINQVIST S (2000) Rainfall variability in Murang'a District, Kenya: Meteorological data and farmers' perception. Geografiska Ann. 82 A 1 107-119. [ Links ]
RAPPOLD GH (2005) Precipitation analysis and agricultural water availability in the Southern Highlands of Yemen. Hydrol. Proc.19 (12) 2437-2449. [ Links ]
ROCKSTROM J, JENNIE B and FOX P (2002) Rainwater management for increased productivity among small-holder farmers in drought prone environments. Phys. Chem. Earth, Parts A/B/C 27 (11-22) 949-959. [ Links ]
ROWNTREE KM (1989) Rainfall characteristics, rainfall reliability and the definition of drought: Baringo District, Kenya. S. Afr. Geogr. J. 71 (2) 74-80. [ Links ]
SCHIETTECATTE W, OUESSAR M, GABRIELS D, TANGE S, HEIRMAN S and ABDELLI F(2005) Impact of water harvesting techniques on soil and water conservation: a case study on a micro catchment in southeastern Tunisia. J. Arid Environ. 61 (2) 297-313. [ Links ]
SIVAKUMAR MVK (1992) Empirical analysis of dry spells for agricultural applications in West Africa. J. Clim. 5 532-539. [ Links ]
SOIL CLASSIFICATION WORKING GROUP (1991) Soil Classification – A Taxonomic System for South Africa. Department of Agricultural Development, Pretoria, South Africa. [ Links ]
SOIL SURVEY STAFF (2006) Keys to Soil Taxonomy (10th edn.). USDA-NRCS, Washington DC. [ Links ]
STEPHENS MA (1974) EDF Statistics for goodness of fit and some comparisons. J. Am. Stat. Assoc. 69 730-737. [ Links ]
STERN RD, DENNETT MD and DALE IC (1982) Analysing daily rainfall measurements to give agronomically useful results. I. Direct methods. Exp. Agric. 18 223-236. [ Links ]
TESFAYE K and WALKER S (2004) Matching of crop and environment for optimal use: the case of Ethiopia. Phys. Chem. Earth Parts A/B/C 29 (15-18) 1061-1067. [ Links ]
THORNTHWAITE CW (1948) An approach toward a rational classification of climate. Geogr. Rev. 38 (1) 55-94. [ Links ]
TILAHUN K (2006) The characterisation of rainfall in the arid and semi-arid regions of Ethiopia. Water SA 32 429-436. [ Links ]
TSIROS E, KANELLOU E, DOMENIKIOTIS C and DALEZIOS NR (2008) The role of satellite derived vegetation health index and aridity index in agroclimatic zoning. Geophysical Research Abstracts, 10, EGU2008-A-07223, 2008 SRef-ID: 1607-7962/gra/EGU2008-A-07223. EGU General Assembly 2008. [ Links ]
TYSON PD (1986) Climate Change and Variability in Southern Africa. Oxford University Press, Cape Town, South Africa. 220 pp. [ Links ]
UNESCO (1979) Map of the World Distribution of Arid Regions. Accompanied by Explanatory Notes. UNESCO, Paris, France. MAB Technical Note No. l7. 54 pp. [ Links ]
WRB (World Reference Base for Soil Resources) (2006) A Framework for International Classification, Correlation and Communication. World Soil Resources Rep.103. IUSS/ISRIC/FAO. [ Links ]
Received 11 June 2009; accepted in revised form 7 December 2009.
* To whom all correspondence should be addressed.
+2715 9628759; fax: +2715 9628598;
e-mail: Jestinos.Mzezewa@univen.ac.za

