Services on Demand
Article
Indicators
Related links
-
 Cited by Google
 -
 Similars in Google
Share
Water SA
On-line version ISSN 1816-7950
Print version ISSN 0378-4738
Water SA vol.36 n.1 Pretoria Jan. 2010
Measurement of grassland evaporation using a surface-layer scintillometer
MJ SavageI,*; GO OdhiamboI; MG MengistuI; CS EversonII; C JarmainIII
ISoil-Plant-Atmosphere Continuum Research Unit, School of Environmental Sciences, University of KwaZulu-Natal, Pietermaritzburg, South Africa
IICSIR Natural Resources and the Environment, c/o Soil-Plant-Atmosphere Continuum Research Unit, School of Environmental Sciences, University of KwaZulu-Natal, Pietermaritzburg, South Africa
IIICSIR Natural Resources and the Environment, Stellenbosch, South Africa
ABSTRACT
A dual-beam surface-layer scintillometer (SLS) was used to estimate sensible heat flux (H) every 2 min for a path length of either 50 or 101 m, for more than 30 months in a mesic grassland in eastern South Africa. The SLS method relies on Monin-Obukhov similarity theory, the correlation between the laser beam signal amplitude variances and the covariance of the logarithm of the beam signal amplitude measured using 2 laser detectors. Procedures for checking SLS data integrity in real-time are highlighted as are the post-data collection rejection procedures. From the H estimates, using SLS and measurements of soil heat flux and net irradiance, evaporation rates were calculated as a residual of the shortened energy balance equation and compared with grass reference evaporation rates (ETo). Inconsistent hourly ETo values occur in the late afternoon due to the incorrect assumption that the soil heat flux is 10% of net irradiance. The SLS estimates of H and the estimates of evaporation rate as a residual compared favourably with those obtained using the Bowen ratio and eddy covariance methods for cloudless days, cloudy days and days with variable cloud. There was no evidence for the eddy covariance measurements of H being underestimated in comparison to the Bowen ratio and SLS measurements. On many days, the diurnal variation in SLS H was asymmetrical, peaking before noon.
Keywords: energy balance, Bowen ratio, eddy covariance, grass reference evaporation, rejection criteria.
Introduction
The possible prescription by government of methods for making a volumetric determination of water, for purposes of water allocation and setting charges in the case of activities resulting in stream flow reduction, is stated in the 1998 Republic of South Africa National Water Act. It is therefore important to consider how evaporation, and evaporation rate, can be measured or estimated routinely, with reliable accuracy and precision (Savage et al., 2004; Savage, 2009), for a range of land surface types. Determination of reliable and representative evaporation data using land-based instrumentation is an important issue in atmospheric research with respect to applications in agriculture, applied environmental sciences, hydrology and micrometeorology, and has particular value in validating remotely-sensed evaporation estimates. Long-term measurements of evaporation at different time scales and from different climate regions are not yet readily available (Jarmain et al., 2009).
Point (single-level), profile and path-weighted atmospheric measurements have been used to estimate sensible heat flux H. Profile measurements consist of measurements at 2 vertical positions above the surface in question and are used in the Bowen ratio (BR) method. Sensible heat flux is driven by vertical temperature differences between the canopy or soil surface and overlying air. By contrast, latent energy flux LE – from which evaporation rate may be calculated – is driven by vertical water vapour pressure differences between that which is measured just above the canopy or soil surface and that of overlying air. Point measurements of H = HEC and LE = LEEC are obtained by eddy covariance (EC), and path-weighted measurements of H = HSLS by scintillometry. All of these flux measurements have footprint representation. The flux footprint refers to the relative contribution of upwind surface sources to H, or LE, measured at a height above the canopy surface. Sensible heat flux H and latent energy flux LE are important components of the shortened energy balance. For a flat extensive surface, the shortened energy balance which neglects some terms – advection and canopy-stored heat fluxes for example – is expressed as:

where:
Rnet is the net irradiance
L is approximately 2.43 MJ·kg-1, the specific latent energy of vaporisation
E the evaporation (mass) flux (kg·s-1·m-2, equivalent to mm·s-1)
S the soil heat flux
Hence LE may be estimated as a residual using measurements of the terms on the right hand side of:

There have been reports in the literature of a lack of energy balance closure when using EC to measure both HEC and LEEC directly (Twine et al., 2000; Wilson et al., 2002). Lack of closure usually results in |HEC + LEEC| < Rnet + S. Since a comparison between 2 methods such as BR and EC does not identify the correct method for measurement of H and/or LE, there is a need for a 3rd method, such as the surface-layer scintillometry (SLS), especially in view of the alleged lack of closure using EC flux measurements.
Commonly, evaporation rate is estimated from grass reference evaporation rate, ETo, at an automatic weather station (AWS) using the Penman-Monteith approach (Allen et al., 1998; 2006), based on daily or hourly point atmospheric measurements at a single level of solar irradiance, air temperature, water vapour pressure and wind speed. In addition, a crop factor is used as a multiplying factor for ETo to obtain the actual evaporation rate. The crop factor effectively distinguishes the vegetation under consideration from a grass reference crop. The dual crop factor approach uses 1 crop factor for the soil surface and another for vegetation.
A scintillometer is used to measure path-weighted H. The instrument measures the intensity fluctuations of visible or infrared radiation after propagation above the plant canopy of interest. It optically measures a parameter associated with refractive index fluctuations of air, Cn2 , caused by air temperature fluctuations that represent the atmospheric turbulence structure. The sensible heat flux, H, may be estimated using the empirically-based Monin-Obukhov similarity theory (MOST). SLS instruments operate over horizontal distances between 50 and 350 m. Large aperture scintillometers (LAS) operate over typical distances between 250 m and up to 3 km. Typically, for areas of between about 0.25 and 5 ha, the SLS would be appropriate, whereas the LAS is suitable for areas larger than about 6 ha.
The objective of this work is to contrast various methods used for estimating evaporation rate as a residual of the shortened energy balance. Practical aspects of the use of the SLS method for the estimation of evaporation rate for a natural grassland are presented. Grass reference evaporation rate (ETo) measurements are also presented for comparison. Comparisons are made between H obtained using the various methods, to investigate whether H estimates using the EC method are underestimated, as is implied by the lack of closure when using EC measurements. The methodology for the measurement of H = HSLS and subsequent estimation of LE = LESLS is presented. A comparison is made between BR, EC and SLS methods of estimating H and LE. Also, procedures and definitions used for rejection of out-of-range and bad or 'doubtful' SLS data are presented.
Energy balance aspects, evaporation methods, energy balance closure and measurement footprint
There are many methods used for estimating evaporation rate. As mentioned by Drexler et al. (2004) in their review, very few evaporation estimation methods work well for an hourly time-step, and in some cases do not even work well for a daily time-step. Virtually all of the methods, except for EC, from which direct measurements of HEC and LEEC at a point are obtained, rely on a theoretical framework and certain assumptions or approximations for arriving at an expression for LE, in terms of other measurable quantities. Many methods invoke the use of a shortened surface energy balance (Eq. (1)) that allows LE to be estimated indirectly.
Weighing lysimeters are large containers, filled with soil, water, other chemicals and entire plant(s). The weighing lysimeter method allows for a direct measurement of the rate of total water loss from a vegetated surface (soil evaporation plus transpiration plus wet-canopy evaporation), and is often regarded as the standard method for measuring LE (Aboukhaled et al., 1982). Weight measurements are made at regular time intervals. The weight difference per unit time difference divided by the density of water and divided by the cross-sectional area of the lysimeter yields the evaporation rate in mm·h-1 or mm·d-1. Lysimeters allow the water loss rate from such containers to be measured for very short time intervals and longer time intervals, from hours to days or longer. The disadvantages of the lysimetric method include: cost, destructive nature of the measurements – in the sense that a relatively large volume of disturbed or sometimes undisturbed soil is placed in a container usually of metal construction, which isolates the lysimeter soil from neighbouring soil, and the non-portable nature of the measurement method. Also, the representation, or the so-called footprint, of the evaporation rate measurement is localised to the cross-sectional area of the lysimeter, although evaporation rate is also influenced by atmospheric events not confined to this area. Much less expensive is the microlysimetric method, but the surface area is an order of magnitude less than a large weighing lysimeter and it is still a destructive method, still isolated from neighbouring soil, and often not able to contain whole plants and therefore only used for measuring soil evaporation rate over short periods.
Given the limitations of the lysimetric method, the search for an alternative standard for evaporation rate estimation has been the focus of many studies for several decades. Methods such as EC involve measurement, typically at a frequency of 10 Hz, of 2 atmospheric variables, vertical wind speed and water vapour pressure, from which LEEC is calculated directly by eddy covariance following many corrections. Similarly, using eddy covariance, HEC is calculated from the covariance of vertical wind speed and air temperature measurements over a specified time interval – usually hourly or sub-hourly. The BR method involves up to 8 measurements, usually at a frequency of 1 Hz, of atmospheric and energy balance components, and a theoretical framework and assumptions to estimate HBR and LEBR (Savage et al., 2004). Empirical methods, or the Penman-Monteith approach, are used to estimate grass reference evaporation rate, ETo, which uses the crop factor approach to calculate evaporation rate. The more portable and much less invasive BR and EC methods, compared to the use of a lysimeter, are more popular research methods for the estimation of evaporation rate and can be used to collect unattended measurements for extended periods of time. These methods were the focus of previous research reports (Savage et al., 1997; 2004; Jarmain et al., 2009). The EC and BR methods essentially yield point estimates of H and LE although these flux estimates are influenced by events upwind of the point of measurement. The extent of the footprint area of influence on the flux measurement, using both BR and EC methods, has received attention. For example, Stannard (1997) investigated the footprint of BR flux measurements and Savage et al. (1995; 1996) investigated the footprint of EC flux measurements. Agreement between BR, EC, and SLS flux measurements of H, for example, may be dependent on the footprint of H, which in turn depends on sensor height and atmospheric stability condition.
Some literature reports on the inadequacy of the EC method for the direct estimation of LE (Wilson et al., 2002; Ham and Heilman, 2003) resulting in |HEC + LEEC| < Rnet + S (Twine et al., 2000). An alternative approach to using a full EC system for measuring HEC and LEEC is to measure HEC only, and to estimate LE as a residual of the shortened energy balance from simultaneous measurements of Rnet, S and H = HEC using Eq. (2).
The frequency of SLS measurements is typically 1 kHz, or 125 Hz for boundary-layer scintillometer measurements for which the path length is up to 10 km, compared to 1 Hz for BR measurements and 10 Hz for EC measurements. Because of the high frequency of the SLS measurements, the averaging period for HSLS can be as short as 1 or 2 min compared to the commonly-used 20 min for BR and 30 min for EC averaging periods (Savage, 2009).
The SLS method appears to be a useful, robust and accurate method for obtaining a path-weighted estimate for H = HSLS. However, many of the studies employing the SLS method have been very short in duration – in some cases just for a few days as mentioned by Odhiambo and Savage (2009b) and in other cases for a couple of months – and have not in detail compared the SLS method with BR and EC measurement methods.
Materials and methods
Site details
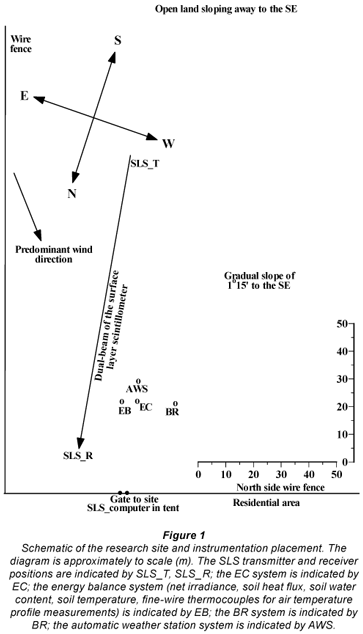
Field EC and SLS measurements were conducted during the period January 2003 to June 2005 in the Hay Paddock area, neighbouring Ashburton and close to Pietermaritzburg, South Africa (29º38' S, 30º26' E) with an altitude of 671.3 m. This is a natural grassland site dominated by Diheteropogon amplectens, Themeda triandra, Tristachya leucothrix and Cymbopogon excavatus. The soils are derived from Dwyka Tillite with a typical soil profile consisting of a loam A horizon (0 - 0.3 m) overlying clay B1 and B2 horizons extending to 1 m. The site experiences summer rainfall and has an average slope of 1º15' to the SE and a minimum fetch distance in the prevailing S-E wind direction of 135 m for the EC system (Fig. 1). The SLS system, consisting of a transmitter and a receiver, had respective fetch distances of 90 and 138 m for the 101 m path length. The minimum fetch for the next-most dominant winds from the N-W is 117 m for the EC system and 146 and 114 m for the SLS transmitter and SLS receiver respectively. Fetch distances from the middle position of the beam were 118 m for S-E winds and 130 m for N-W winds; vegetation height at this position has the greatest influence on the calculated beam-weighted vegetation height used in the SLS computations. Beyond these distances and to the south, the site is exposed and the slope increases. Adjacent to the site was natural grassland and occasional trees, with the exception of the north-west side of the study area which is residential with some trees. The grass growth is seasonal and this seasonality affects the partitioning of –Rnet – S into H and LE. There were occasional power problems and interruptions due to an accidental fire in August 2004 and accidental cutting of cables. The BR measurements commenced in December 2003.
Grass reference evaporation estimation
The procedures for estimating sub-daily grass reference evaporation rate, ETo, are described by Allen et al. (2006). The calculations were performed in a spreadsheet with ETo estimated every 2 min using these procedures, from AWS measurements of solar irradiance, air temperature, water vapour pressure and wind speed. While the AWS system was available at the site, ETo estimates were based on the AWS data. After the AWS system was removed, measurements from the same model of sensors were used to calculate ETo, except that for solar irradiance a Kipp and Zonen (Delft, The Netherlands) CM3 thermopile sensor was used. For some of the time, horizontal wind speed from the 3-D sonic anemometer was used. Water vapour pressure was measured using a Vaisala CS500 (Helsinki, Finland) air temperature and relative humidity sensor from the AWS system, or one of the following humidity sensors: another CS500, a Vaisala HMP35C or HMP45C air temperature and relative humidity sensor or a cooled dew point hygrometer (model Dew-10, General Eastern Corp., Watertown, Massachusetts, USA).
Surface-layer scintillometer measurements
A dual-beam surface-layer scintillometer (model SLS40-A, Scintec Atmospärenmessetechnik, Tübingen, Germany) (Thiermann, 1992; Thiermann and Grassl, 1992), was used to estimate H = HSLS. The beam distance of the SLS was 50 m for the initial experiments and later changed to 101 m. The beam heights were 1 and 1.6 m above the soil surface. Different path lengths would need to be used for different experimental areas. The objective for the use of the 2 path lengths was to test the reliability of the SLS method for the shortest possible and an average path length. The SLS40-A receiver has 4 detectors, with 2 of the detectors used for automatic identification of, and correction for, transmitter vibration by the software used for analysis. In other words, the SLS40-A dual-beam system and its 4 detectors enable the separation of, and correction for, the intensity fluctuations caused by beam movement. There are 2 detectors per beam. The SLS employs a diode laser source with an output wavelength of 670 nm and 1-mW mean output power (2-mW peak). The beam displacement and detector separation distances are 2.5 mm each, with a detector diameter of 2.7 mm. The correlation between the transmitted laser beam signal variances and the covariance of the logarithm of the beam signal amplitude is measured using the 2 detectors. Software, together with the instrument, allows on-line measurements at a frequency of 1 kHz and subsequent calculation every 1 or 2 min (Thiermann and Grassl, 1992) of the structure parameter for refractive index fluctuations  , m-2/3), structure parameter for temperature (
 K2 m-2/3), the inner scale of turbulence lo (mm), turbulent kinetic energy dissipation rate (ε, m2 s-3), sensible heat flux (H, W m-2), momentum flux (τ, Pa) and the Obukhov length (L, m). Monin-Obukhov similarity theory (MOST) is assumed. The methodology for calculating the 2-, 20- or 30-min HSLS, using MOST, is described by Odhiambo and Savage (2009a) and Savage (2009). The direction of HSLS was determined from the sign of the profile air temperature gradient. Data rejection or filtering procedures were applied in a spreadsheet to the 2-min values of H = HSLS. Sensible heat flux values were rejected, blanks were created or data recalculated:
• Data were rejected if the percentage of 1 kHz error-free data (EFD) was less than or equal to 25%, most often due to misty conditions
• Data were rejected for lo < 2 mm for the 101-m path length or lo < 3.5 mm for the 50-m path length (Scintec, 2006). So-called saturation of the transmitted SLS signal (Lawrence and Strohbehn, 1970; Gracheva et al., 1974) generally resulted in smaller-than-expected estimates for the covariance of the logarithm of the amplitude of the radiation intensity for the 2 beams, and, therefore, smaller-than-expected signal correlation coefficient values for the 2 beams, smaller lo values and greater-than-expected HSLS magnitudes.
• For missing data, designated by zeros, a blank cell was used for HSLS.
Bowen ratio measurements
Two BR systems (based on the Campbell 023A system, Campbell Scientific Inc., Logan, Utah, USA) and connected to a Campbell 21X datalogger, were used to measure water vapour pressure and air temperature profile differences between heights of 1.55 and 2.96 m above the soil surface. The BR water vapour pressure profile measurements were obtained using one or more of the following sensors placed in a humidity sensor chamber: a HMP45C Vaisala air temperature and relative humidity sensor; a cooled mirror Dew-10 hygrometer; a CS500 Vaisala air temperature and relative humidity sensor. A pump was used to alternately switch the flow of air every 2 min, from one measurement height to another, to the chamber and to return to the atmosphere.
Air temperature was measured at 2 levels using unshielded and naturally-ventilated 75-µm type-E thermocouples. At each level, a parallel combination of thermocouples was used. Extra insulation was used to cover the thermocouple connectors at the thermocouple joins. Extra precautions were taken to cover and thermally insulate the point at which the thermocouple wires were connected to the datalogger. The thermocouples were regularly inspected for damage, cleanliness, insects and cobwebs. The BR data exclusion procedures, mainly associated with a Bowen ratio approaching –1 but also due to condensation events, are described by Savage et al. (2009).
For measuring the remaining components of the energy balance, 3 net radiometers (model Q*7, REBS, Seattle, Washington, USA) within a few metres of each other were used to measure Rnet. The net radiometers were calibrated according to the procedures of Savage and Heilman (2009). Placement height was 2 m above the soil surface. Seven soil heat flux plates (model HFT-3, REBS) were used to measure soil heat flux at a depth of 80 mm and a system of parallel thermocouples at depths of 20 and 60 mm was used to calculate the soil heat flux stored above the plates (Tanner, 1960). Volumetric soil water content in the first 60 mm of the surface was measured using a frequency domain reflectometer (ThetaProbe, model ML2x, Delta-T Devices, Cambridge, UK) and a Campbell 615 soil reflectometer. Most of these sensors were connected to a Campbell CR7X datalogger and transferred to a CR23X datalogger after the 2003 accidental fire. The net radiometers and soil heat flux plates and other EC sensors were positioned approximately midway between the transmitter and receiver units of the SLS. Measurements were every 1 s and averages were obtained every 2 min. These in turn were used to calculate 20-min averages for the BR calculations.
Eddy covariance measurements
Adjacent to the AWS, a 3-dimensional sonic anemometer (SWS-211/3V, Applied Technologies, Boulder, Colorado, USA), referred to as the EC system, was used to measure H = HEC at a height of 1.45 m above the soil surface. Later in the study, the EC measurement height was increased to 2.12 m above the soil surface to correspond to the average height of the BR levels. This 3-D anemometer, with a 100-mm sonic path length, was connected to a Applied Technologies digital-to-analogue SA-4 converter which was then connected to a Campbell 21X datalogger. Measurements of the 3 components of wind velocity, u, v, w in the x, y and z directions, respectively, and sonic temperature, T, were performed every 0.1 s (frequency of 10 Hz). Following the accidental fire, the 21X datalogger was replaced by a CR23X datalogger and a replacement 3-D sonic anemometer was used (same model). The sonic anemometer measurements were processed on-line and the 2-min covariance between w and T (for determining H = HEC) and the covariance between w and the horizontal wind speed U = (u2 + v2)1/2 (for determining momentum flux) were calculated using ρ = 1.12 kg m-3 and cp = 1 033 J kg-1 K-1. The 2-min averages of u, v, w and sonic temperature, T, and wind direction, θ = arctan (v/u), were also stored. Coordinate rotations for the EC data (Kaimal and Finnigan, 1994) were not performed for the initial study using a field computer due to security concerns and the lack of equipment to store the 10-Hz EC data. For the initial measurements, for which the SLS beam path length was 50 m, w and T were sampled every 0.2 s using a Campbell CA27 1-D sonic anemometer and 25-mm fine-wire thermocouple, respectively, and data processed using a Campbell 21X datalogger. Two-min averages, standard deviations and covariances were stored for further data analysis. Data rejection rules for the EC measurements were fairly simple: sometimes, usually whenever there was condensation, covariances of -99 999 were excluded. Missing values, and also periods when incorrect sonic temperatures approaching 50ºC were recorded, were excluded and not used to calculate H = HEC. These incorrect values were caused by dirt on the sonic transducers, faulty transducers or sonic beam interruptions. Night-time EC measurements were often unreliable due to condensation or mist affecting the acoustic signal.
Calibration of the EC system and its replacement was performed by placing the 3-D system in a box for which each component of the wind speed was 0 m·s-1. Air temperature and relative humidity, required for accurate speed of sound estimation (from which the sonic temperature is calculated), were independently measured using averaging thermocouples and a Vaisala CS500 air temperature and relative humidity sensor placed inside the box.
For a limited period, a fast-responding open-path infrared analyser for water vapour pressure and carbon dioxide concentration (model LI-7500, LI-COR Inc., Lincoln, Nebraska, USA) and a second Applied Technologies 3-D sonic anemometer (model SATI/3V) with a sonic path length of 150 mm were used to calculate the following fluxes using the EC technique: HEC, LEEC, momentum, and carbon dioxide.
Results and discussion
Rejection criteria for the exclusion of out-of-range and 'bad' or doubtful SLS data
For positive dT/dz values, adjusted for the dry adiabatic lapse rate, where dT/dz is the profile air temperature gradient measured using BR thermocouples, and corresponding to unstable atmospheric conditions, EFD > 25 % and lo > 2 mm for the 101-m path length and non-blank HSLS values, -Hday is displayed in the cell. For stable atmospheric conditions, corresponding to negative dT/dz adjusted values, EFD > 25 %, and lo > 2 mm, -Hnight is displayed in the cell. For periods when the BR equipment was not available, the sign of HSLS was made equal to that of HEC. If both BR and EC measurements were unavailable, it was assumed that unstable conditions prevailed between 06:00 and 18:00 (usually corresponding to Rnet > 0 W·m-2) and stable conditions otherwise.
Percentage of acceptable SLS data
For the period January 2003 to August 2004 there was little seasonal variation in the percentage of 'acceptable' 2-min HSLS measurements for the daytime hours (taken as 06:00 to 18:00) and the percentage was consistently high – between 86.7 and 94.8 % (Fig. 2a). The night-time variation in the percentage had a more pronounced seasonal pattern, with the lowest percentage of measurements that were considered to be acceptable occurring between January and March in summer of each year (Fig. 2b). The lower night-time percentage values were due to the effects of dew and mist. These events also affected EC and BR data.
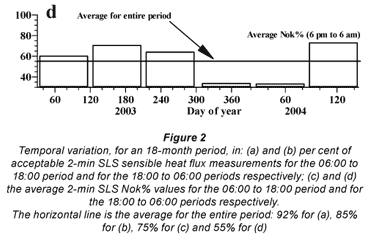
The average percentage of the reliable 1-kHz data, denoted Nok%, varied between 62 and 85% (Fig. 2c) for the period 06:00 to 18:00, and between 33 to 73% for the night-time hours (Fig. 2d). These data demonstrate the reliability of the SLS method for obtaining long-term HSLS measurements and other micrometeorological parameters. The lowest Nok% was during the summer rainfall period (September to March), due to the influence of rain and mist events on beam transmission.
Flux comparisons
The averaging periods for the various measurement systems are 2 min for energy balance, ETo and SLS systems, 20 min for the BR system and 30 min for the open-path EC system. The 2-min H values are easily scaled up to 20 min, 30 min and daily time intervals but scaling from longer to shorter times is not possible. For EC measurements, 2- and 20-min averaging periods were used.
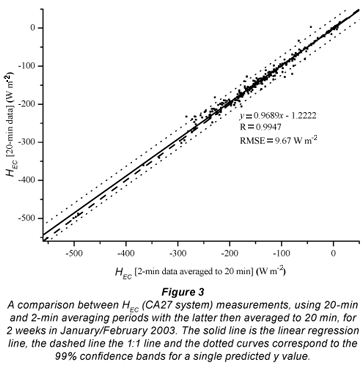
The EC technique is often regarded as the standard for flux measurements, against which all comparisons of H are usually made. However, there is currently no agreement on the averaging period for EC measurements (Sun et al., 2006; Odhiambo and Savage, 2009a). Initially, in January/February 2003, HEC measurements were at intervals of 20 min using the CA27 EC system consisting of a 1-D sonic anemometer and a fine-wire thermocouple. A field experiment using 2 EC systems was conducted with the 1st system performing the covariance between w and T every 20 min, and the 2nd system every 2 min. The calculated 2-min H = HEC values were then averaged over 20 min and compared with HEC determined using a 20-min time averaging period (Fig. 3). The correspondence was good (slope of 0.9689 and root mean square error (RMSE) of 9.67 W·m-2) and this partly justifies using the 20-min time period for the EC method.
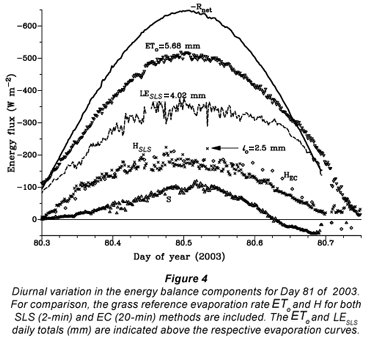
The diurnal variation of the surface energy balance components for Day 81 of 2003, as a typical example, is shown with LESLS estimated as a residual, in this case every 2 min, using Eq. (2) from HSLS, Rnet and S (Fig. 4). The agreement between HSLS (2 min) and HEC (20 min) is good in spite of the SLS yielding path-weighted measurements, the very different principles of operation, different footprints for the EC and SLS measurements, and the different measurement heights. The 2-min EC point measurements of HEC (data not shown) exhibit a marked variation from 1 measurement period to the next, whereas there is a much-reduced variation in the corresponding path-weighted HSLS measurements (Odhiambo and Savage, 2009a). Very occasionally, the HSLS measurements are impacted on by lo approaching the critical value of 2 mm. Such an occurrence is indicated by the arrow (at 12:48 for example) in Fig. 4. The 2-min ETo estimates are also shown and for some of the time (late afternoon) exceeded Rnet. This is unexpected, although it should be noted that Rnet used for estimating ETo is based on solar irradiance measurements and an estimate of the surface reflection coefficient (0.23) and S estimated as 0.1 of Rnet, the latter clearly not the case in the late afternoon (Fig. 4). The ratio of LESLS to ETo was quite stable during the day, peaking at 0.8 at 08:00 and 16:00, with a minimum of about 0.67 at noon and averaging 0.73 for daytime hours with a standard deviation of 0.06. The Rnet measurements are symmetrical around noon whereas S is generally asymmetrical with a peak after the noon period due to the conductive lag of the soil measurements. Measurements of HSLS are also asymmetrical with a peak before noon, with the result that the LESLS (residual) estimates (Eq. 2) are roughly symmetrical around noon. The correspondence in H between the EC and SLS measurement methods is improved on most days under conditions when there is reduced turbulence, particularly on uniformly cloudy days, and times before 10:00 and after 14:00 (data not shown).
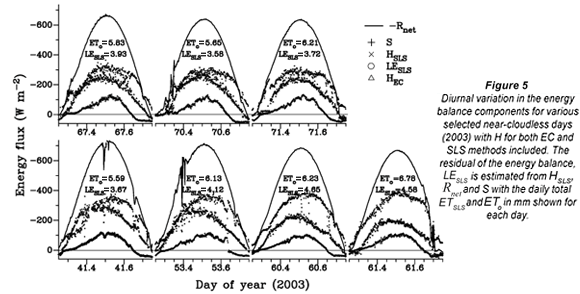
The asymmetrical diurnal trend in HSLS is shown in Fig. 5, more clearly on some days than on others. Also shown in Fig. 5 is the reasonable agreement between HEC and HSLS for a number of near-cloudless days. The HEC estimates were every 20 min, and HSLS every 2 min, as previously mentioned, since the 2-min HEC measurements showed considerable variation. There is no evidence in Fig. 5 for a consistent underestimation of HEC compared to HSLS over an extended period of time. Furthermore, there is no evidence to indicate that the effective (path-weighted) beam height input was incorrect (Cain et al., 2001). An incorrect input would have caused a consistent overestimation or underestimation in HSLS compared to HEC; the results of an error analysis showed that a fractional error in the beam height of 5% would result in a fractional error of 4% in HSLS (Savage, 2009).
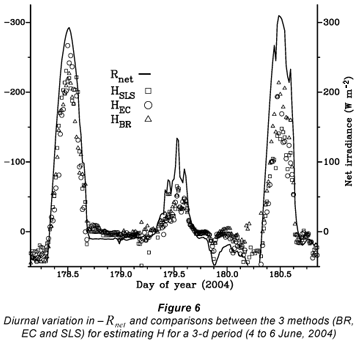
Comparisons between the BR, EC and SLS methods for estimating H are shown (Fig. 6) for a 3-d period (4 to 6 June, 2004) of variable weather conditions. Sky conditions varied from cloudless, to scattered cloud, to completely overcast conditions on 5 June. In spite of these contrasting weather conditions, the SLS path-averaging method showed reasonable agreement with HEC point measurements (20-min values), with BR and/or EC methods overestimating for some of the time on Days 178 and 180. Both HEC and HBR measurements showed spikes in their variation but there was no evidence of this for the HSLS measurements. The spikes occur when there are sudden changes in microclimatic conditions, particularly Rnet (Fig. 6). The SLS path-weighted method tends to average such spikes over the beam path length. Of particular note is the rather unexpected agreement in measurements for all methods during the night (stable conditions).
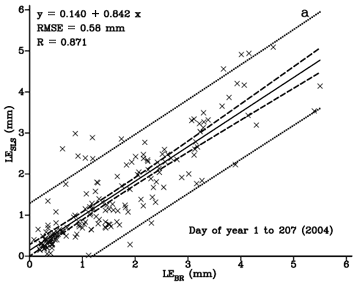
A regression comparison between daily (accumulated 20-min) evaporation values for the BR and SLS methods is shown for a period of 187 days (1 Jan to 5 July, 2004) in Fig. 7a. The impact of errors in Rnet and S on LE estimated as a residual using Eq. (2) has been reported on by Savage (2009) and will therefore not be repeated here. The agreement between daily LESLS (mm) and LEBR (mm) was fair, with a slope of 0.842 mm·mm-1 (standard error of slope SE = 0.037 mm·mm-1) and correlation coefficient R = 0.871. The wide bands represent the 95% confidence belts for a single predicted y value, and the narrower ones that for the population mean. Much of the variability can be attributed to the BR method, for which condensation in the hoses and mixing bottles, particularly in the early-morning hours and/or rain periods, invalidated measurements for several hours and longer when unchecked.
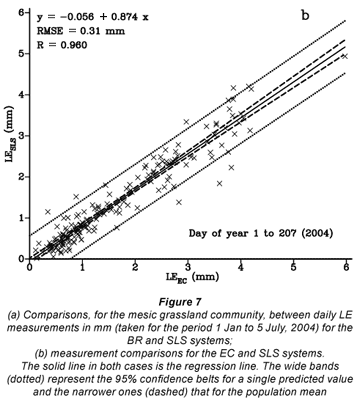
The regression comparison between daily (accumulated 20-min) LE values for the EC and SLS methods for the same time period showed much less scatter (Fig. 7b). The slope value of 0.874 mm·mm-1 (SE = 0.020 mm·mm-1) and R = 0.960 is indicative of the good comparison between measurements for the 2 methods. Much of the variability can be attributed to the differences between HEC point-estimates and HSLS path-weighted estimates, although both fluxes have footprint representation. The footprint area for each of the fluxes from BR, EC and SLS methods is different and varies according to wind direction, measurement height, stability parameters, friction velocity and H. The fetch distances for the different measurement methods were not the same, and this too would have contributed to the measurement differences in H and LE in Fig. 6 and in Figs. 7a and 7b respectively.
All 3 measurement methods are affected by mist, dew, rainfall and other events that affect the complete transmission of either the EC sonic beam or the SLS laser beam. In the case of the BR measurements, as mentioned previously, condensation on sensors or inside the hoses and mixing bottles affects the accuracy of the air temperature and water vapour pressure profile measurements adversely. Furthermore, the upper domes of the net radiometer(s) are often covered with droplets of water during such conditions and during rain events, invalidating the Rnet measurements and therefore invalidating LE calculated as a residual and also LEBR.
The agreement between estimates of LE obtained using the independent open-path EC system and that estimated using LESLS = –Rnet – S – HSLS was poor (data not shown). The reason(s) for this poor agreement needs to be explored further. It would appear, however, that the problem related to the lack of energy balance closure using direct measurements of HEC and LEEC may be due to the direct measurement of LEEC, given that HEC compares well with HSLS and assuming that Rnet and S are measured correctly.
Conclusions
Three methods for estimating point (EC and BR) and path-weighted (SLS) sensible heat flux, each with a very different theoretical basis or formulation, showed reasonable agreement for a variety of wind and weather conditions and for different canopy heights, for a mesic grassland site for which the grass canopy growth was seasonal, with evaporation rates being a maximum in summer and a minimum in winter. The measurements of the energy balance components allowed evaporation rate to be estimated using the simplified energy balance, and AWS measurements allowed grass reference evaporation rate (ETo) estimates. Inconsistent late-afternoon ETo estimates, greater than the net irradiance Rnet, occurred due to the incorrect assumption that soil heat flux is 10% of Rnet. The BR sensible heat flux and evaporation rate measurements were more variable than those obtained using the EC and SLS methods. The BR method was adversely affected, on occasion for days, by condensation events due to liquid water on sensors, in hoses and in mixing bottles. We conclude that the SLS method is a robust method allowing long-term and continuous evaporation rate measurements that represent a larger measurement footprint than may be the case for the BR and EC methods. There was no evidence for the underestimation in sensible heat flux by the EC method, as has been suggested in the literature.
Acknowledgements
The financing of the project by the Water Research Commission (WRC) through projects K349 and K1335 and the contributions of the members of the 2 WRC Reference Groups is gratefully acknowledged. Additional funding in the latter stages of the WRC K1335 scintillometer project from the National Research Foundation is also gratefully acknowledged. The CSIR kindly provided the open-path EC system. The project was only possible with the cooperation of the following people: farm owner Mr SJ Hilcove and farm manager Mr H Ovenstone of the Bellevue farm site used for this research; Ms Jody Manickum (Agrometeorology) of the School of Environmental Sciences, University of KwaZulu-Natal, and Mr Peter N Dovey, who provided part of the technical support required for this project.
References
ABOUKHALED A, ALFARO A and SMITH M (1982) Lysimeters. Food and Agriculture Organization of the United Nations, Rome, Italy. 68 pp. [ Links ]
ALLEN RG, PEREIRA LS, RAES D and SMITH M (1998) Crop evapotranspiration – Guidelines for computing crop water requirements – FAO Irrigation and Drainage Paper 56. Food and Agriculture Organization of the United Nations, Rome, Italy. 315 pp. [ Links ]
ALLEN RG, PRUITT WO, WRIGHT JL, HOWELL TA, VENTURA F, SNYDER R, ITENFISU D, STEDUTO P, BERENGENA J, YRISARRY JB, SMITH M, PEREIRA LS, RAES D, PERRIER A, ALVES I, WALTER I and ELLIOTT R (2006) A recommendation on standardized surface resistance for hourly calculation of reference ETo by the FAO56 Penman-Monteith method. Agric. Water Manage. 81 1-22. [ Links ]
CAIN JD, ROSIER PTW, MEIJNINGER W and DE BRUIN HAR (2001) Spatially averaged sensible heat fluxes measured over barley. Agric. Forest Meteorol. 107 307-322. [ Links ]
DREXLER JZ, SNYDER RL, SPANO D and PAW U KT (2004) A review of models and micrometeorological methods used to estimate wetland evapotranspiration. Hydrol. Process. 18 2071-2101. [ Links ]
GRACHEVA ME, GURVICH AS, LOMADZE SO, POKASOV VI and KHRUPIN AS (1974) Probability distribution of strong fluctuations of light intensity in the atmosphere. Radiophys. Quantum Electron. 17 83-87. [ Links ]
HAM JM and HEILMAN JL (2003) Experimental test of density and energy-balance corrections on carbon dioxide flux as measured using open-path eddy covariance. Agron. J. 95 1393-1403. [ Links ]
JARMAIN C, EVERSON CS, SAVAGE MJ, MENGISTU MG, CLULOW AD, WALKER S and GUSH MB (2009) Refining Tools for Evaporation Monitoring in Support of Water Resources Management. WRC Report No. 1567. Water Research Commission, Pretoria, South Africa. 137 pp. [ Links ]
KAIMAL JC and FINNIGAN JJ (1994) Atmospheric Boundary Layer Flows, Their Structure and Measurement. Oxford University Press, New York. 289 pp. [ Links ]
LAWRENCE RS and STROHBEHN JW (1970) A survey of clear-air propagation effects relevant to optical communications. Proc. IEEE 58 1523-1545. [ Links ]
ODHIAMBO GO and SAVAGE MJ (2009a) Surface layer scintillometer and eddy covariance sensible heat flux comparisons for a mixed grassland community as affected by Bowen ratio and MOST formulations. J. Hydrometeorol. 10 479-492. [ Links ]
ODHIAMBO GO and SAVAGE MJ (2009b) Surface layer scintillometry for estimating the sensible heat flux component of the surface energy balance. S. Afr. J. Sci. 105 208-216. [ Links ]
SAVAGE MJ (2009) Estimation of evaporation using a dual-beam surface layer scintillometer and component energy balance measurements. Agric. Forest Meteorol. 149 501-517. [ Links ]
SAVAGE MJ, EVERSON CS and METELERKAMP BR (1997) Evaporation Measurement Above Vegetated Surfaces Using Micrometeorological Techniques. WRC Report No. 349/1/97. Water Research Commission, Pretoria, South Africa. 248 pp. [ Links ]
SAVAGE MJ, EVERSON CS and METELERKAMP BR (2009) Bowen ratio evaporation measurement in a remote montane grassland: Data integrity and fluxes. J. Hydrol. 376 249-260. [ Links ]
SAVAGE MJ, EVERSON CS, ODHIAMBO GO, MENGISTU MG and JARMAIN C (2004) Theory and Practice of Evapotranspiration Measurement, with Special Focus on SLS as an Operational Tool for the Estimation of Spatially-Averaged Evaporation. WRC Report No. 1335/1/04. Water Research Commission, Pretoria, South Africa. 204 pp. [ Links ]
SAVAGE MJ and HEILMAN JL (2009) Infrared calibration of net radiometers and infra red thermometers. Agric. Forest Meteorol. 149 1279-1293. [ Links ]
SAVAGE MJ, HEILMAN JL, MCINNES KJ and GESCH RW (1995) Placement height of eddy correlation sensors above a short grassland surface. Agric. Forest Meteorol. 74 195-204. [ Links ]
SAVAGE MJ, MCINNES KJ and HEILMAN JL (1996) The "footprints" of eddy correlation sensible heat flux density, and other micrometeorological measurements. S. Afr. J. Sci. 92 137-142. [ Links ]
SCINTEC (2006) Scintec Surface Layer Scintillometer SLS20/SLS40 SLS20-A/SLS40-A User Manual (including OEBMS1). Scintec Atmosphärenmesstechnik AG, Tübingen, Germany. 105 pp. [ Links ]
STANNARD DI (1997) A theoretically based determination of Bowen-ratio fetch requirements. Boundary-Layer Meteorol. 83 375-406. [ Links ]
SUN X-M, ZHU Z-L, WEN X-F, YUAN G-F and YU G-R (2006) The impact of averaging period on eddy fluxes observed at ChinaFLUX sites. Agric. Forest Meteorol. 137 188-193. [ Links ]
TANNER CB (1960) Energy balance approach to evapotranspiration from crops. Soil Sci. Proc. Amer. 24 1-9. [ Links ]
THIERMANN V (1992) A displaced-beam scintillometer for line-averaged measurements of surface layer turbulence. 10th Symposium on Turbulence and Diffusion. Portland, Oregon, USA. [ Links ]
THIERMANN V and GRASSL H (1992) The measurement of turbulent surface-layer fluxes by use of bichromatic scintillation. Boundary-Layer Meteorol. 58 367-389. [ Links ]
TWINE TE, KUSTAS WP, NORMAN JM, COOK DR, HOUSER PR, MEYERS TP, PRUEGER JH, STARKS PJ and WESELY ML (2000) Correcting eddy-covariance flux underestimates over a grassland. Agric. Forest Meteorol. 103 279-300. [ Links ]
WILSON K, GOLDSTEIN A, FALGE E, AUBINET M, BALDOCCHI D, BERBIGIER P, BERNHOFER C, CEULEMANS R, DOLMAN H, FIELD C, GRELLE A, IBROM A, LAW BE, KOWALSKI A, MEYERS T, MONCRIEFF J, MONSON R, OECHEL W, TENHUNEN J, VALENTINI R and VERMA S (2002) Energy balance closure at FLUXNET sites. Agric. Forest Meteorol. 113 223-243. [ Links ]
Received 12 November 2008; accepted in revised form 17 November 2009.
* To whom all correspondence should be addressed.
+2733 260 5514; fax: +2733 260 5514;
e-mail: savage@ukzn.ac.za


