


Services on Demand
Article
 English (pdf)
 Article in xml format
 Article references
Indicators

Related links
-
 Cited by Google
 -
 Similars in Google
Share

 Permalink
Water SA
On-line version ISSN 1816-7950
Print version ISSN 0378-4738
Water SA vol.35 n.5 Pretoria Oct. 2009
Nitrate-nitrogen removal with small-scale reverse osmosis, electrodialysis and ion-exchange units in rural areas
J Schoeman*
University of Pretoria, Department of Chemical Engineering, Water Utilisation Division, Pretoria 0002, South Africa
ABSTRACT
The nitrate-nitrogen concentration in water supplied to clinics in Limpopo Province is too high to be fit for human consumption (35 to 75 mg/ℓ NO3-N). Therefore, small-scale technologies (reverse osmosis, ion-exchange and electrodialysis) were evaluated for nitrate-nitrogen removal to make the water potable (< 10 mg/ℓ NO3-N). It was found that the reverse osmosis process should function well for nitrate-nitrogen removal. Nitrate-nitrogen could be reduced from a concentration of 35 to 43 mg/ℓ in 1 case to a concentration of between 1.4 and 5.5 mg/ℓ in the treated water. In another case it could be reduced from 54 to 72 mg/ℓ to 12 to 17 mg/ℓ in the treated water. The water was also effectively desalinated. The ion-exchange process could also reduce the nitrate-nitrogen concentration to less than 10 mg/ℓ in the treated water. However, the water could not be efficiently desalinated and the process should function better when the level of total dissolved solids in the feed is not very high. The electrodialysis process should also function well for nitrate-nitrogen and salinity removal. However, the electrodialysis process is more complicated to operate. The reverse osmosis and ion-exchange processes are therefore suggested for nitrate-nitrogen removal at clinics. Capital costs for small-scale reverse osmosis and ion-exchange units are estimated at ZAR7 000 and ZAR10 000, respectively. Operational costs for reverse osmosis and ion-exchange are estimated at ZAR3.16/m3 and ZAR3.60/m3 of treated water, respectively.
Keywords: Water quality, nitrate-nitrogen removal, reverse osmosis, ion-exchange, electrodialysis, costs
Introduction
Many borehole waters in rural areas in South Africa are not fit for human consumption because the nitrate-nitrogen (>6 mg/ℓ), fluoride (>1 mg/ℓ) and salinity (>1 000 mg/ℓ) concentrations are too high (Schoeman and Steyn, 2000). High nitrate-nitrogen concentrations in drinking water can cause an illness called methaemoglobinaemia or 'Blue Baby Syndrome' in small children. This happens when the nitrate is reduced to nitrite in the gastrointestinal tract and the nitrite reacts directly with haemoglobin in the bloodstream to produce methaemoglobin with consequent impairment of oxygen transportation. The reaction of nitrite with haemoglobin can be especially hazardous in infants under 3 months of age. Serious, and occasionally fatal, poisoning in infants has occurred following the ingestion of untreated well waters with nitrate-nitrogen concentration levels greater than 10 mg/ℓ (Holden et al., 1970). Other adverse human health effects associated with high nitrate-nitrogen concentrations in water include spontaneous abortions, the possibility of malformations in children, increased incidence of hyperthyroidism (goitre), and bladder cancer (Weyer, 2001).
The nitrate-nitrogen concentration of many borehole waters near clinics in the Limpopo Province is very high (30 to 70 mg/ℓ NO3-N). In many cases this is the only source of water nearby, and this water is not suitable for potable purposes, although the water is consumed for these purposes. Consequently, the nitrate-nitrogen concentration in the borehole waters should be reduced to potable standards (< 10 mg/ℓ NO3-N). Many clinics require only about 250 ℓ/d of potable water. Therefore, small-scale treatment technologies are required for water denitrification.
Reverse osmosis (RO), ion-exchange (IX), electrodialysis (ED) and biological denitrification technologies, which are successfully used for large-scale denitrification of water, should all be suitable technologies for small-scale application. A newly-developed membrane biofilm reactor also appears to have merit for small-scale usage (Chung et al., 2007). However, each of these technologies has its own advantages and disadvantages for water denitrification. Biological denitrification, for example, can remove nitrate-nitrogen very effectively from water. However, the perception that the water is in contact with bacteria, which are responsible for the removal of nitrate-nitrogen, is not always acceptable to people. The control of a biological process could also be difficult in a rural area. Reverse osmosis, IX and ED can also remove nitrate-nitrogen very effectively from contaminated waters (Tisseau, 1998; Kesore et al., 1997; Lauch and Guter, 1986). The control of these processes in rural areas should be easier than that of a biological process. Very little information is available regarding the biofilm reactor for nitrate-nitrogen removal. Therefore, the RO, IX and ED processes were selected for the small-scale removal of nitrate-nitrogen from boreholes serving clinics in rural areas.
The objectives of the investigation were to:
- Evaluate RO, IX and ED for nitrate-nitrogen removal at clinics
- Establish the most suitable technology for use at clinics
- Determine the preliminary economics of the processes
- Recommend the most suitable technology for use at clinics
Nitrogen sources
Waste of organic origin in soil contains nitrogen in protein form. The 1st transformation step is protein degradation (proteolysis and ammonia fixation of molecules) into ammonia-nitrogen by micro-organisms (DWAF, 1996). The 2nd step is the nitrification (2 phases) performed by autotrophic bacteria:
- NH4+ is oxidised into NO2- by Nitrosomonas
- NO2- is oxidised into nitrate (nitration) by Nitrobacter.
It is believed that high nitrate concentrations in borehole waters in rural areas originate from natural organic matter in soil and from pit latrines in the vicinity of boreholes. Other potential nitrogenous sources include runoff from agricultural land, wastewater and domestic water (Tisseau, 1998). However, it is doubtful whether any of these sources contribute significant quantities of nitrate-nitrogen to the groundwater in rural areas.
Water quality at clinics
The water quality experienced at some of the clinics in the Limpopo Province is shown in Tables 1, 2 and 3 ( Crosby, 2003), along with the resulting classification of this water quality in terms of an applicable water quality assessment tool (DWAF, DoH and WRC, 1998). The high nitrate-nitrogen concentrations are due to the location of pit latrines and other community sewage-disposal systems in the vicinity of production boreholes. It should be noted that the nitrate-nitrogen concentration levels (Class 4) indicate a dangerous water quality – totally unsuitable for use. The salinity levels, including chlorides and hardness, are also high in some of the waters. Therefore, water desalination would be required to reduce water quality to potable standards.
Methods
Clinic A
Reverse osmosis unit
An RO Model 10F4 with booster pump was used at Clinic A (Fig. 1) (Schoeman, 2004).
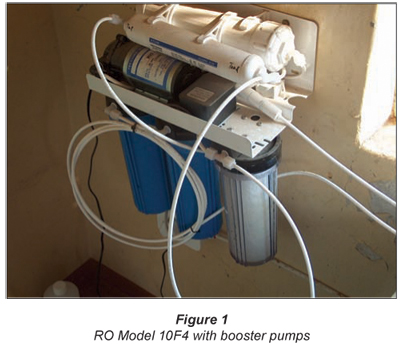
The RO unit containing Filmtec TW30-18-12 membranes (96% rejection) was tested in the laboratory prior to installation at the clinic in order to ensure correct procedure of operation and performance. Water flow rates, water recovery and salt rejections were determined on tap water.
Feed water at the clinic was supplied from a 10 m3 plastic tank (4 m high) to the RO unit that was installed indoors against a wall. Water flow rates (product or permeate and brine), water recovery and salt rejection were measured on a regular basis. Personnel from the clinic assisted in sample taking. The nitrate-nitrogen concentrations of the RO feed, product and brine were determined by chemical analysis. The major ions in the RO feed, product and brine were also determined at irregular intervals, along with the bacteriological composition of the untreated and treated feed.
IX unit
A POU-200-N600 Ion-Exchange Nitrate Removal Unit containing Lewatit M600 strong base anion resin was used at Clinic A (Figs. 2a and 2b) (Schoeman, 2004). The IX unit is similar to the units that are used for water softening.
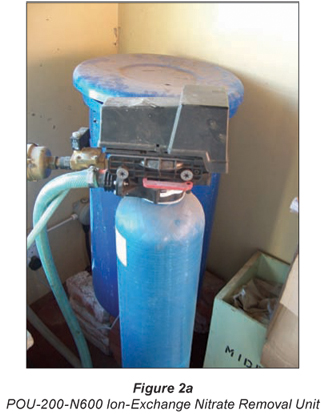
A bag of salt (25 kg) was put in the regeneration tank (height of water = 22 cm ; tank diameter = 41.5 cm ; volume = approx. 30 ℓ; anion-exchange resin was regenerated with approximately 10% salt solution (0.4 bed volumes (BVs); 1 BV = 20.5 ℓ)). Excess salt was removed by water rinses before the service cycle was started. A breakthrough curve was first established by taking hourly samples of the treated water for nitrate-nitrogen analysis. The nitrate-nitrogen concentration in the treated water was plotted as a function of throughput and the number of BVs produced at nitrate-nitrogen breakthrough (10 mg/ℓ NO3-N). Note that 20.5 ℓ resin (1 BV = 20.5 ℓ) was used.
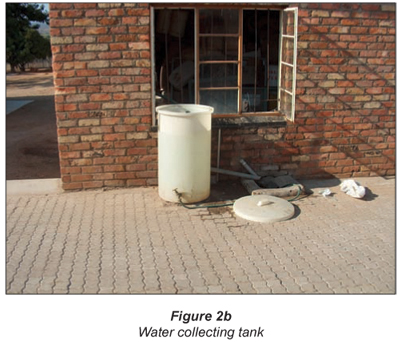
Nitrate-nitrogen removal with the IX unit was studied over a 7-month period. Treated water was collected for approximately 1 to 3 hours every day in a 200 ℓ container (Fig. 2b). Samples for nitrate-nitrogen analysis were taken where the treated water entered the 200 ℓ container through a float, and the treated water volume (throughput) was recorded. Personnel from the clinic assisted in the taking of samples and flow-meter readings.
The IX unit is an automated unit (Schoeman, 2004). Regeneration is conducted with salt using an Autotrol 400 series control. The resin is first backwashed, then regenerated, followed by rinses to remove excess salt prior to the service cycle. Salt must be added to the regeneration tank when the salt bag (25 kg) in the tank is empty. Water is automatically sucked into the regeneration tank when it is empty.
ED unit
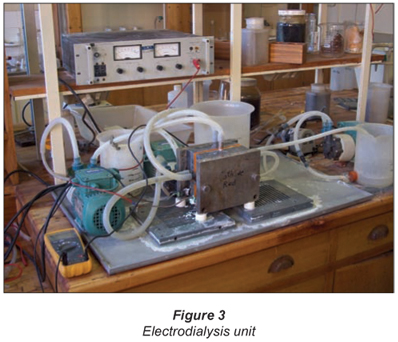
A laboratory-scale ED unit with an effective membrane area of 81 cm2 was evaluated in the laboratory for the removal of nitrate-nitrogen from borehole waters obtained at the clinics (Fig. 3) (Schoeman, 2004). The experiments were performed in the batch mode; 4 ℓ feed and 1 ℓ brine (feed) were used. The feed and brine solutions were circulated through 10 cell pairs (Selemion AMV and CMV membranes) at a constant cell stack voltage (20 V), and the decrease in electrical current was measured as a function of time. Samples of the treated water were taken regularly for nitrate-nitrogen analysis.
Clinic B
A similar RO unit to that used at Clinic A was used at Clinic B (Schoeman, 2004). Clinic B receives water of a poorer quality than that received by Clinic A. Note that the membrane module size was 5 cm by 25 cm at both clinics.
Results and discussion
Clinic A
RO test results on tap water
The RO unit was first tested on tap water prior to installation at the clinic. The desalination performance of the RO unit on tap water is shown in Table 4.
Salt rejection and water recovery were 96.06% and 27.01%, respectively. The low water recovery is due to the low feed inlet pressure (approx. 300 kPa). The product water output was 10.26 ℓ/h or 246.24 ℓ/d (1 d = 24 h).
RO test results on borehole water at clinic A
The nitrate-nitrogen concentration, measured in the RO feed, product and brine over the test period, is shown in Fig. 4. The nitrate-nitrogen concentration in the RO feed varied between 35 and 43 mg/ℓ. The nitrate-nitrogen concentration in the RO product varied between 1.4 and 5.2 mg/ℓ. Therefore, a high quality product water could be produced with RO desalination of the water. The nitrate-nitrogen concentration in the RO brine varied between 46 and 56 mg/ℓ; this concentration was not much higher than the feed concentration due to the low water recovery.
The initial nitrate-nitrogen concentration in the RO product was 1.4 mg/ℓ. This concentration in the product water was 5.2 mg/ℓ when approximately 23.3 m3 of the feed water had been treated. Therefore, it appears that there was a steady increase in the nitrate-nitrogen concentration in the product water. However, the nitrate-nitrogen concentration of 5.2 mg/ℓ in the product water at the end of the run was still far below the value of 10 mg/ℓ which is recommended for potable purposes.
The per cent nitrate-nitrogen removal, as a function of throughput over the test period, is shown in Fig. 5. The percentage nitrate-nitrogen removal varied between 96.7% and 86.7%. The results showed that there was a decline in the percentage nitrate-nitrogen removal from the beginning to the end of the run. However, there were highs and lows in the percentage nitrate-nitrogen removal over the test period. This phenomenon could not be explained at this stage.
The electrical conductivity of the RO feed, product and brine over the test period, as a function of throughput, is shown in Fig. 6. The electrical conductivity of the borehole water varied between 1 279 and 1 310 µS/cm over the test period and was very constant. The product water conductivity was lowest at the beginning of the run (78.9 µS/cm) with a maximum of 116 µS/cm occurring during the run. It also appeared that there was a steady increase in the conductivity of the product from the beginning to the end of the run. Brine conductivity varied between 1 560 and 1 722 µS/cm. There was again not much difference between the brine and the feed conductivity as a result of the low water recovery, and the brine could be used for toilet flushing.
The percentage conductivity rejection as a function of throughput over the test period is shown in Fig. 7. Conductivity rejection varied between 91.14% and 93.56% over the test period. Conductivity rejection was the highest at the beginning of the run (93.95%) and was 92.03% at the end of the run. This decline in conductivity rejection might indicate some degree of membrane fouling. However, the reduction in conductivity rejection was minimal and it appeared that membrane fouling should not be a serious problem.
It is interesting to note that the highs and lows in the conductivity rejection (Fig. 7) correspond with the highs and lows in the percentage nitrate-nitrogen removal (Fig. 5). These highs and lows in ion removal could be ascribed to a non-constant feed pressure during desalination.
The RO product and brine flow rates, as a function of throughput over the test period, are shown in Fig. 8. The product flow rate started at 120 mℓ/min, increased slightly, then declined slightly, increased again and was 135 mℓ/min at the end of the run. Therefore, the output of product water was higher at the end of the run than at the beginning of the run. This could indicate that membrane fouling should not be a problem. Brine flow rate varied between 264 and 438 ℓ/min over the test period. The brine flow rate was not significantly higher than the feed flow rate due to the low water recovery.
Water recovery as a function of throughput over the test period is shown in Fig. 9. Water recovery was 31.25% at the beginning of the run, declined to a low of 20%, then increased again and was 28.1% at the end of the run. (Note: The increase in water recovery and product flow is due to higher feed water temperatures during the summer months.)
The pH of the RO feed varied between 6.62 and 7.02 over the test period and was fairly constant. The product water pH was lower and varied between 5.61 and 6.59. This lower pH of the product water is due to the removal of alkalinity from the feed with the RO membranes. Brine pH was higher and varied between 6.77 and 7.15.
The 5 µm cartridge filter ahead of the RO membrane was replaced after 17.63 m3 of water had been processed. The cartridge filter had a brownish colour on the outside but was still white on the inside showing that no contaminants had leaked into the membranes. The brownish material entrapped in the filter consisted of 72.33% iron and 16.12% silicon as analysed by EDX (Schoeman, 2004; Isner and Williams, 1993).
A typical chemical composition of the RO feed, product and brine is shown in Table 5.
High-quality water could be produced with RO treatment (Class 0). This quality of water is ideal for life time use. The bacteriological quality of the RO feed, product and brine at the end of the run is shown in Table 6.
Reverse osmosis membranes are a good barrier against bacterial contamination. This is demonstrated by the results shown in Table 6 (Class 0). The heterotrophic plate count, however, was high. This showed that the water should be further disinfected by chlorine, prior to use.
Performance of the IX unit for nitrate-nitrogen removal at Clinic A
Data from a breakthrough curve has shown that approximately 100 ℓ (995 ℓ; 48.54 BVs) of denitrified water could be produced with ease (Schoeman, 2004). The nitrate-nitrogen concentration was only 0.8 mg/ℓ after 995 ℓ of water had been treated. It should be possible to produce significantly more denitrified water (approximately 2 000 ℓ) before regeneration would be required.
The electrical conductivity of the feed to the IX unit was 129 mS/m and the conductivity of the product water was significantly higher (146 mS/m) at the beginning of the run due to the displacement of chloride by nitrate from the resin. The conductivity of the product water, however, dropped to lower levels towards the end of the run.
The nitrate-nitrogen concentration in the treated water as a function of throughput over a number of regeneration and service cycles is shown in Fig. 10.
The IX unit was set at 1 regeneration per week at the beginning of the run. The feed flow rate was set at 13.2 BVs/h (1 BV = 20.5 ℓ) and a sample of the treated water was taken after approximately 2 to 3 hours every day, at the float. The tap at the outlet of the product water collecting tank was then closed and the tank was allowed to fillup to approximately 200 ℓ, when the float stopped the production of treated water. Therefore, at least a 1 000 ℓ of treated water was produced each day.
The data in Fig. 10 show that between approximately 2 and 3 m3 of denitrified water (< 10 mg/ℓ NO3-N) could be produced between regeneration cycles (zero to 31.03 m3 throughput; 1 regeneration per week). The nitrate-nitrogen concentration in the product water exceeded 10 mg/ℓ when approximately 3 m3 of product water had been produced. However, the run was continued waiting for regeneration to commence with the result that the product concentration was approximately the same as the feed concentration prior to regeneration. Therefore, the resin should be regenerated more frequently, i.e. at least twice per week.
The ion-exchange unit was set at 3 regenerations per week after 33.9 m3 of product water had been produced. The data in Fig. 10 clearly show that a product water with a nitrate-nitrogen concentration of 10 mg/ℓ and less could be continuously produced (from 35.9 m3 to 57.1 m3 throughput). Regeneration was not very effective (possibly no salt was added) at a throughput of between 57.6 m3 and 67.9 m3, and a poor quality product water was produced. However, water quality improved after a throughput of 68.9 m3, lasting for a short period until a throughput of 70.3 m3 (0.4 to 0.2 mg/ℓ NO3-N) was reached. Regeneration improved again and highquality water was produced at throughputs of between 74.3 m3 and 102.6 m3 (28.3 m3). Water quality then deteriorated (101.3 m3 to 107.4 m3 throughput) and further deteriorated from 107.9 m3 to 112.7 m3 throughput because no salt was added to the regeneration tank by the operator.
It was determined that approximately 90 ℓ of an approximately 10% salt solution was used for each regeneration of the resin.
The nitrate-nitrogen removal performance data show that it should be possible to continuously produce a good quality water (< 10 mg/ℓ NO3-N) with ion-exchange treatment. However, care should be taken that salt is always added to the regeneration tank once all the salt has been used. A disadvantage of the ion-exchange unit was that it was not refilling the regeneration tank properly with water after regeneration, with the result that the tank had to be filled manually. This problem, however, should be rectified by using an improved controller.
The chloride concentration in the borehole water is approximately 181 mg/ℓ (Class 1) (Schoeman, 2004). However, the chloride concentration in the treated water is approximately 300 mg/ℓ and higher (Class 2). Therefore, the treated water quality deteriorates as a result of the release of chloride ions into the treated water. However, a higher concentration of chloride ions in the treated water should be less of a problem than a high nitrate-nitrogen concentration. An excess concentration of chloride ions in the feed water and an excess total dissolved ion concentration will limit the use of ion-exchange for nitrate-nitrogen removal. Use of sodium bicarbonate as a regenerant instead of sodium chloride offers the potential of not adding chloride ions to the treated water (Matosic et al., 2000).
Performance of the ED unit for nitrate-nitrogen removal at Clinic A
The nitrate-nitrogen removal results are shown in Table 7.
It should be possible to reduce the nitrate-nitrogen concentration from 42 mg/ℓ in the feed to less than 10 mg/ℓ in the product water with ED. The ED process, however, is a much more complicated process to operate than the RO and IX processes. Electrodialysis is therefore not suggested for water denitrification in a rural area.
Clinic B
Performance of the RO unit for nitrate-nitrogen removal
The nitrate-nitrogen concentration in the RO feed was significantly higher at Clinic B than at Clinic A. The nitrate-nitrogen concentration in the RO feed varied between 54 and 69 mg/ℓ (Fig. 11). The initial nitrate-nitrogen concentration in the RO product was 21 mg/ℓ and declined to approximately 15 mg/ℓ after approximately 1 m3 of water had been processed and remained at this level until the run was terminated (10.8 m3). The nitrate-nitrogen concentration in the brine varied between 73 and 101 mg/ℓ.
The RO product flow rate started at 216 mℓ/min and was 198 mℓ/min after 10.8 m3 of water was treated. Brine flow rate was 318 mℓ/min at the beginning of the run and was 330 mℓ/min at the end of the run.
Water recovery decreased from 40.5% at the beginning of the run to 37.5% after 10.8 m3 of feed had been treated. The feed pH was 6.92 and the product pH was 5.98. Brine pH was slightly higher than the feed pH. The chemical composition of the RO feed, product and brine is shown in Table 8.
A high quality water could be produced with RO desalination. This is a Class 0 water, with the exception of nitrate-nitrogen concentration (Class 1). The nitrate-nitrogen removal characteristics of the small RO modules that are currently available are not high enough to produce a treated water with very low nitrate-nitrogen concentration from high nitrate-nitrogen feed waters. Such membrane modules should be developed. It was also found that the low pressure RO feed pump became damaged after use as a result of the relatively high TDS of the feed. Improved quality pumps should be used for this type of water.
Performance of the ED unit for nitrate-nitrogen removal
The nitrate-nitrogen removal results are shown in Table 9.
It should again be possible to reduce the higher nitrate-nitrogen concentration at Clinic B to approximately 10 mg/ℓ with ED. It should also be possible to reduce the salinity of the feed to potable quality.
Economics
The estimated capital and operational costs of the RO and IX technologies for use in rural areas are shown in Table 10 (Schoeman, 2004).
Summary and conclusions
Small-scale RO, IX and ED units were evaluated for water denitrification at clinics. The following conclusions can be made as a result of the investigation:
- High-quality water (1.4 to 5.5 mg/ℓ NO3-N) could be produced with RO desalination at Clinic A, where the feed-water nitrate-nitrogen concentration was lower (35 to 43 mg/ℓ NO3-N) than at Clinic B. However, the heterotrophic plate count of the treated water was high and the water should be disinfected before use. Small-scale RO should be a suitable technology for the treatment of this type of water.
- The quality of the RO treated water (12 to 17 mg/ℓ) at Clinic B, where the feed-water NO3-N (54 to 72 mg/ℓ) concentration was higher, was less satisfactory. The heterotrophic plate count of the treated water was also high and the water should be disinfected before use. Small-scale RO should be a suitable process for treatment of this water, especially with the high salinity of the water. However, higher rejection nitrate-nitrogen membranes should be found for this application.
- The ion-exchange process should be a suitable process for treatment of the water at Clinic A. Nitrate-nitrogen should be reduced to less than 10 mg/ℓ with ease. The ion-exchange process, however, adds chloride to the treated water, which might adversely affect the taste of the water. The ion-exchange process also does not desalinate the feed water properly and would not be a suitable process for a high TDS water as is the case at Clinic B.
- Electrodialysis should also be a suitable technology for the treatment of the water at both clinics. However, the ED process is considered to be too difficult to operate and maintain in rural areas.
- The RO process appears to be easier to operate and maintain than either the IX and ED processes and is therefore recommended for use at clinics. The RO brine concentration is only slightly higher than the feed concentration and can be used for the flushing of toilets. The IX process should also be a suitable process where the salinity of the feed is not too high. Proper maintenance of these units is very important and is the key to success for use in rural areas.
- The capital and operational costs of a small-scale RO unit (output of 195 to 259 ℓ/d) are estimated at approximately ZAR7 000 and ZAR3.16/m3 treated water, respectively (membrane replacement costs excluded).
- The capital and operational costs of an IX unit (output of approximately 3 m3/d) are estimated at approximately ZAR10 000 and ZAR3.60/m3 treated water, respectively (resin replacement costs excluded).
References
CROSBY R (2003) Personal communication. AGES, PO Box 2526, Polokwane 0700. [ Links ]
CHUNG J, RITTMANN BE, WRIGHT WF and BOWMAN RH (2007) Simultaneous bio-reduction of nitrate, perchlorate, selenate, chromate, arsenate and dibromochloropropane using a hydrogen-based membrane biofilm reactor. Biodegradation 18 199-209. [ Links ]
DWAF (DEPARTMENT OF WATER AFFAIRS AND FORESTRY, SOUTH AFRICA) (1996) South African Water Quality Guidelines (2nd edn.) Vol. 1, Domestic Water Use. Department of Water Affairs and Forestry, Pretoria, South Africa. [ Links ]
DWAF, DoH and WRC (DEPARTMENT OF WATER AFFAIRS AND FORESTRY, DEPARTMENT OF HEALTH and WATER RESEARCH COMMISSION) (1998) Quality of Domestic Water Supplies Vol. 1: Assessment Guide (2nd edn.). WRC Report No. TT 101/98. Water Research Commission, Pretoria, South Africa. [ Links ]
HOLDEN WA, CHURCHILL A and CHURCHILL J (1970) (eds.) Water Treatment and Examination. 104 Gloucester Place, London, UK. [ Links ]
ISNER RJD and WILLIAMS RC (1993) Analytical techniques for identifying reverse osmosis foulants. In: Amjad Z (ed.) Reverse Osmosis, Membrane Technology, Water Chemistry and Industrial Applications. Van Nostrand Reinhold, New York. [ Links ]
KESORE K, JANOWSKI F and SHAPOSHNIK VA (1997) Highly effective electrodialysis for selective elimination of nitrates from drinking water. J. of Membrane Sci. 127 17-24. [ Links ]
LAUCH RP and GUTER GA (1986) Ion-exchange for the removal of nitrate from well water. J. AWWA 78 (5) 83-88. [ Links ]
MATOSIC M, MIJATOVIC I and HODZIC E (2000) Nitrate removal from drinking water using ion-exchange – comparison of chloride and bicarbonate form of the resins. Chem. Biochem. Eng. Q. 14 (4) 141-146. [ Links ]
SCHOEMAN JJ and STEYN A (2000) Defluoridation, denitrification and desalination of water using ion-exchange and reverse osmosis. WRC Report No. TT 124/00. Water Research Commission, Pretoria, South Africa. [ Links ]
SCHOEMAN JJ (2004) Evaluation of reverse osmosis, ion-exchange and electrodialysis for nitrate-nitrogen removal from borehole water at clinics in the Northern Province. Unpublished report, available from: Japie.schoeman@up.ac.za. [ Links ]
TISSEAU MA (1998) Nitrates. In IWSA (ed.) The Blue Pages, The IWSA Information Source on Drinking Water Issues. IWSA . [ Links ]
WEYER P (2001) Nitrate in drinking water and human health. Review paper prepared for the University of Illinois Urbana-Champaign Agriculture Safety and Health Conf., March 2001. URL: http://www.cheec.uiowa.edu/nitrate/health.html (Accessed 2009) [ Links ]
Received 22 December 2008; accepted in revised form 28 August 2009.
* To whom all correspondence should be addressed.
+2712 420 3569; fax: +2712 362 5089;
e-mail: japie.schoeman@up.ac.za

