


Serviços Personalizados
Artigo
 Inglês (pdf)
 Artigo em XML
 Referências do artigo
Indicadores

Links relacionados
-
 Citado por Google
 -
 Similares em Google
Compartilhar

 Permalink
Water SA
versão On-line ISSN 1816-7950
versão impressa ISSN 0378-4738
Water SA vol.35 no.5 Pretoria Out. 2009
The analysis was carried out using a spreadsheet-based model specifically designed for the task. A sequence of actions (Strategy 5) that the municipality may implement to improve and manage stormwater quality as part of capital and operational projects includes:
- 100% of feasible pervious surface area (i.e. after formalisation of the settlement) will be managed with erosion and sediment control techniques in the first 5 years
- Daily street-sweeping (including refuse removal) will be accomplished in 75% of all feasible streets in the settlements in the first 5 years
- Formalisation of the settlement will be completed in the next 10 or more years with 15% of the feasible impervious cover reduced
- 50% of feasible areas will have their downspouts disconnected after formalisation of the settlement
- 83% of all illicit connections will be removed after formalisation of the settlement
- 100% of the feasible households will be provided or equipped with rainwater tanks after formalisation of the settlement
- 100% of the feasible roads will be retrofitted with stormwater exfiltration system during the formalisation of the settlement
Non-structural and operational controls such as educational programmes, erosion and sediment control, frequent street sweeping and refuse removal, and maintenance operations should be ongoing procedures since they are preventive measures, cost-effective and constitute good house-keeping. As part of a de-densification and relocation of dwellings project, feasible residential and commercial areas should gradually have impervious cover areas reduced (converted to pervious areas) and downspouts disconnected. Ways to achieve higher per cent coverage of impervious cover reduction, downspout disconnection, illicit connection removal, and rainwater tanks should also be further investigated as well as the use of subsidies, regulatory measures and soak-away pits to enhance the implementation of these interventions. It will take time to de-densify and formalise Alexandra settlement and also to confirm the cost and effectiveness, under local conditions, of emerging interventions such as exfiltration systems, impervious cover reduction, downspout disconnection, illicit connection removal, and riparian buffer interventions. Thus they should be implemented gradually over a long period of time.
The main limitations of the model are:
- The model is analytically based on lumped parameters which are subject to many assumptions and limitations as opposed to continuous modelling
- The model provides estimates of many source loads and load reductions for which reliable monitoring or performance data is not yet available especially in developing areas. It must be recognised, however, that the model defaults are nothing more than informed judgments or heuristics based on literature review. They have been included in the framework to help stormwater managers, who would otherwise not have access to these data, to evaluate as many sources and treatment/management options as possible.
- The model makes simplified assumptions and employs analytical methods for the calculation of loads and load reductions (Owusu-Asante, 2008) for which much more complicated analyses may be conducted. The simplifications in the model lead to 'uncertainty' in the results. Hence output values are subject to imprecision.
- The model tracks only 6 pollutants: nitrogen, phosphorus, chemical oxygen demand, lead, suspended solids and faecal coliforms
The following recommendations are made towards enhancement of the model developed under this research:
- The general scarcity of appropriate quantitative information on urban water quality characteristics and management interventions (including design parameters, costs, and removal effectiveness) hampers the selection of suitable management interventions that can be deployed to manage the impacts of urban water quality pollution. Consequently, it is essential that carefully targeted research should be conducted to fill these information gaps. The input parameters into the model can be used to guide the type of information needs.
- Development of a database to capture all monitored information is crucial to water quality management in settlements. This should include a database on structural treatment measures' performance to help establish their important design parameters and elucidate the parameter effects on the structural treatment measures' performance. A database on non-structural programmes will help to establish the factors that are critical to their effectiveness and sustainability. Any developed database should be readily available to the public or at least all stakeholders and should be a driving force for knowledge sharing.
- The original research proposal included an undertaking of field treatability tests of some interventions as a case study. This action was initiated in Kliptown, a township in Johannesburg, but could not be completed due to financial constraints. Hence all the interventions identified and included in the model have not been tested locally to ascertain their applicability and suitability. It is therefore recommended that the model be tested using actual monitored data from a selected settlement. This will require a long-term data collection programme.
- The extent to which geographic information systems (GIS) can be locally used as appropriate management and communications technologies to quantify urban runoff, identify and select appropriate management interventions and communicate choices to decision-makers needs further research
- The model will be greatly enhanced if it can be re-designed to run continuous simulation to accommodate temporal and spatial variation of input parameters
- Selection of least-cost strategy with the model is presently achieved by a process of trial and error. The selection process can be improved if the model can be linked to an optimiser, and research into this aspect is recommended.
- The model has enormous input data requirements, each of which have their own uncertainties. Classical uncertainty analysis may not be feasible for this type of model but further elucidation of how uncertainty can be accounted for remains an important research gap.
A methodology for evaluating the benefits of the interventions to the Jukskei River, health and wellbeing of the people of Alexandra should be developed. This would also require continuous performance monitoring to assess the actual performance of the interventions relative to their expected performance. Most of the information used in the model was assumed and sourced from other international studies. It is recommended that future data capture should be encouraged and this data substituted in the model to enhance the accuracy in the parameter estimations. Thus the study's recommendations are only preliminary and should be examined rigorously before adoption, and reviewed and updated periodically as part of the capital and operational budget process.
References
ASHTON PJ and BHAGWAN J N (2001) Guidelines for the Appropriate Management of Urban Runoff in South Africa. Integrated Report. WRC Report No. TT/155/01. Water Research Commission, Pretoria, South Africa. [ Links ]
BKS INC. (1996) Jukskei River Water Quality Management: Development of Water Quality Management Objectives. Final Report to the Department of Water Affairs and Forestry, Directorate of Water Quality Management, South Africa. [ Links ]
BROWN E, CARACO D, CENTER FOR WATERSHED PROTECTION and PITT R (2004) Illicit Discharge Detection and Elimination. A Guidance Manual for Program Development and Technical Assessments. Centre for Watershed Protection, Ellicott City, M.D. USA. [ Links ]
CAMPBELL LA (2001) A Study on the Fate of Urban/Stormwater Runoff from Alexandra Township in the Jukskei River. WRC Report No. 598/3/01. Water Research Commission, Pretoria, South Africa. [ Links ]
CANDARAS AM, CARVALHO MJ and MAN-KIT KOO (1995) City of Etobicoke Exfiltration and Filtration Systems Pilot/Demonstration Project. In: James W (ed.) Modern Methods for Modeling the Management of Stormwater Impacts. Computational Hydraulics International, Guelph, Ontario. [ Links ]
CWP (CENTRE FOR WATERSHED PROTECTION) (2001) Watershed Treatment Model. Centre for Watershed Protection, Ellicott City, M.D. USA. [ Links ]
DEHD (DEPARTMENT OF ECONOMIC AND HUMAN DEVELOPMENT, SOUTH AFRICA (2007) The Economic Imperatives of Environmental Sustainability. City of Cape Town, South Africa. December 2007. URL: www.capetown.gov.za/en/ehd/Documents/ EHD_-_The_Economic_Imperatives_of_Environmental_Sustainability_161200813435_.pdf (Accessed January 2008). [ Links ]
DWAF (DEPARTMENT OF WATER AFFAIRS AND FORESTRY, SOUTH AFRICA) (2006) Resource Directed Management of Water Quality: Management Instruments. Volume 4.2. Guideline for Determining Resource Water Quality Objectives (RWQOs), Allocatable Water Quality and the Stress of the Water Resource. (2nd edn.). Water Resource Planning Systems Series, Sub-Series No. WQP 1.7.2. Department of Water Affairs and Forestry, Pretoria, South Africa. [ Links ]
LI J and KOO M (1994) Development of stormwater percolation technology. Proc. Environmental Engineering Conf. 1994. Winnipeg, Manitoba, Canada. 278-288. [ Links ]
LI J, TRAN J, HENRY D, and LIANG W (1997) Development and evaluation of the City of Etobicoke Exfiltration System. Proc. The Operational Water Management Conf. 1997. Copenhagen, Denmark. 407-413. [ Links ]
MTSHELWANE Z (2002) Thousand new houses in Alex upgrades. City of Johannesburg website. URL: www.joburg.org.za/Thousand New Houses in Alex Upgrades.htm (Accessed June 2007). [ Links ]
OWUSU-ASANTE Y (2008) Decision Support System for Managing Stormwater and Greywater Quality in Informal Settlements in South Africa. Ph.D. Thesis. School of Civil and Environmental Engineering, University of the Witwatersrand, South Africa. [ Links ]
OWUSU-ASANTE Y and STEPHENSON D (2006) Estimation of storm runoff loads based on rainfall-related variables and power law models – case study in Alexandra. Water SA 32 (2) 137-143. http://www.wrc.org.za/downloads/watersa/2006/April%2006/1818.pdf. [ Links ]
ROSSMAN LA (2004) Stormwater Management Model, Version 5, User Manual. United States EPA, Cincinnati. [ Links ]
SCHUELER TR (1987) Controlling Urban Runoff – A Practical Manual for Planning and Designing Urban BMPs. Metropolitan Washington Council of Governments, Washington DC. [ Links ]
STEPHENSON and ASSOCIATES (2002) Investigation of stormwater culverts on the tributaries of the Jukskei River in the Alexandra Township. Consolidated report to City of Johannesburg, South Africa. Final report. [ Links ]
STEPHENSON D and BARTA B (2005) Impacts of Stormwater and Groundwater Ingress on Municipal Sanitation Services. WRC Report No. 1386/1/05. Water Research Commission, Pretoria, South Africa. [ Links ]
WALSH G (2001) quoted in TAYLOR A and WONG THF (2002) Non-structural Stormwater Quality Best Management Practices – A Literature Review of Their Value and Life cycle Costs. Technical Report 02/13, Cooperative Research Centre for Catchment Hydrology. Melbourne, Australia. [ Links ]
Received 6 February 2009; accepted in revised form 4 June 2009.
* To whom all correspondence should be addressed.
+2772 1707610; fax: +2711 7177045;
e-mail: Owusuy@hotmail.com
Heavy daily-rainfall characteristics over the Gauteng Province
Liesl L Dyson*
Department of Geography, Geoinformatics and Meteorology, Geography Building 2-12, University of Pretoria, Pretoria 0001, South Africa
ABSTRACT
Daily rainfall over the Gauteng Province, South Africa, was analysed for the summer months of October to March using 32-yr (1977 to 2009) daily rainfall data from about 70 South African Weather Service stations. The monthly and seasonal variation of heavy rainfall occurrences was also analysed. Three 24-h heavy rainfall classes are defined considering the area-average rainfall. A significant rainfall event is defined when the average rainfall exceeds 10 mm, a heavy rainfall event when the average rainfall exceeds 15 mm and a very heavy rainfall event when the average rainfall exceeds 25 mm. January months have the highest monthly average rainfall as well as the highest number of heavy and very heavy rainfall days. The month with the second-highest number of heavy and very heavy rainfall days is February followed by March and October. December has the second-highest monthly average rainfall and the most days with rain. However, it is also the month with the lowest number of heavy and very heavy rainfall days. The highest 24-h rainfall recorded at a single station during the 32-yr period was 300 mm in December 2006. However, rainfall exceeding 115 mm at a single rainfall station in the Gauteng Province is very rare and does not occur every year. January months receive these events more than any other month but this only transpires in approximately a third of years. The central and north-western parts of the Province experience the most events where the rainfall at a single station surpasses 75 and 115 mm. With regard to seasonal rainfall, the 1995/96 summer rainfall season had the highest seasonal rainfall during this 32-yr period followed by the 1999/2000 season. The 1995/96 season had above normal rainfall in both early and late summer but the 1999/2000 season was dry in early summer and very wet in late summer. Significantly high seasonal rainfall is associated with above-normal rainfall in late summer.
Keywords: widespread heavy rainfall, Gauteng, daily rainfall, weather forecasting, summer rainfall, climatology of heavy rainfall
Introduction
Rainfall resulting in flooding occurs from time to time over the Gauteng Province. The heavy rainfall events may take place over most of the province and last for days, resulting in widespread flooding and disruption of infrastructure and even loss of life. Examples of such events took place during January and February 1996 (De Coning et al., 1998) and February 2000 (Dyson and Van Heerden, 2001). However, heavy rainfall may also occur in isolated areas over the Gauteng Province from so called mesoscale weather systems, resulting in flash flooding. In these instances the heavy rainfall may be of a short duration (but intense) and is often associated with strong winds and hail (Viviers and Chapman, 2008; Ngubo et al., 2008).
Gauteng Province (hereafter Gauteng) is situated on the interior plateau of South Africa and receives most of its rainfall in summer. The annual average rainfall in Gauteng varies between just over 700 mm on the Witwatersrand (approximately 1 700 m a. m. s. l.) and just over 600 mm north of the Magaliesberg (approximately 1 100 m a. m. s. l.) (SAWS,1998). Most of Gauteng falls into the climate region: Moist Highveld Grassland, and is relatively cool with average annual maximum temperatures of about 22°C in the south but increasing to 25°C in the north. There are about 100 d with rain in Johannesburg and 85 in Pretoria (Kruger, 2004). The extreme northern parts of Gauteng fall into the Central Bushveld climate region. According to Kruger (2004) the maximum rainfall over Gauteng occurs during the December and January months.
Gauteng is responsible for over a third of South Africa's Gross Domestic Product (GDP) and a tenth of Africa's GDP. Geographically, Gauteng is the smallest province in South Africa, covering approximately 16 500 km2, but nearly 20% (9.6 m.) of South Africa's population reside in Gauteng. It is estimated that Gauteng will be home to 14.6 m. people by 2015. There were 405 informal settlements in Gauteng in 2006 (Gauteng Department of Housing, 2006); the overcrowding in these settlements has reached extreme proportions with as many as 24 people sharing a living space of approximately 40 m2 (Beavon, 2004). The vacant land on the river banks in the informal settlements has also become populated by shacks and these communities are especially vulnerable to flash flooding. This study focuses on Gauteng due to its importance to the economy of South Africa and its high population density, but also due to the availability of observed meteorological data in the province. In addition it is also one of the regions for which weather forecasts are issued on a daily basis.
In an attempt to understand more about the characteristics of heavy rainfall over Gauteng, observed daily rainfall data were analysed for the summer months (October-March) for a period of 32 years. In this paper early summer refers to October to December and late summer to January to March. The rainfall at individual stations is investigated, but the emphasis is on the areal average rainfall over Gauteng. One of the forecasting challenges for Gauteng is that the type of weather system responsible for precipitation, and indeed heavy rainfall, differs considerably from early to late summer. During early summer the atmosphere has a distinct extra-tropical nature when weather systems such as cut-off lows are frequent (Singleton and Reason, 2007). However, in late summer (January and February) tropical circulation systems are much more prevalent over South Africa (Dyson and Van Heerden, 2002). In this paper the emphasis is not on the weather systems responsible for the heavy rainfall but rather concentrates on rainfall statistics over Gauteng. The results from this paper form the basis of ongoing research investigating the atmospheric variables and synoptic circulation patterns associated with heavy rainfall over Gauteng.
An example of heavy rainfall 'climatology' in the scientific literature is by Maddox et al. (1979), who described aspects of flash flooding over the USA. More recently, Brooks and Stensrud (2000) created an hourly rainfall climatology over the USA, followed by Schumacher and Johnson (2006), who described characteristics of extreme rain events over the eastern two-thirds of the United States. They found that extreme rain events (where the 24-h precipitation total at 1 or more stations exceeds the 50-yr recurrence amount for that location) are most common in July, and that in the northern USA these events transpire almost exclusively in the warm season. They also concluded that most of these events (66%) are associated with mesoscale convective systems while synoptic and tropical systems play a larger role in the south and east. Chen et al. (2007) used a similar statistical approach to investigate heavy rainfall in Taiwan. They found that heavy rainfall occurs with a pronounced afternoon maximum over Taiwan and that the orographic effects are important in determining the spatial distribution of heavy rainfall.
A better understanding and knowledge of the climatology of heavy rainfall will facilitate the forecasting of these extreme events. The main aim of this paper is to make weather forecasters aware of how likely heavy rainfall events are over Gauteng during a particular summer month. Understanding the spatial and temporal distribution of heavy rainfall events is a key aspect in furthering this aim. As flood-producing heavy rainfall events are infrequent, knowledge of the climatology of these events could therefore also aid inexperienced weather forecasters, by providing guidance as to how likely heavy rainfall might be during a particular time of the year.
The data used in this analysis are discussed first and some of the problems encountered in the dataset are highlighted. Information is consequently supplied about the seasonal, monthly and daily rainfall characteristics in Gauteng. Three different heavy rainfall classes are defined for average daily Gauteng rainfall and the monthly characteristics of these events are examined. Lastly, heavy rainfall characteristics at individual stations are discussed for each of the summer months.
Data and methods
Daily rainfall data were obtained from the South African Weather Service (SAWS) for all summer months (October to March) from 1977 to 2009. SAWS rainfall stations report 24-h accumulated rainfall in the morning (0800 South African Standard Time). All the rainfall stations over Gauteng were investigated for their suitability for use in this analysis. Only stations where data were available for at least 75% of the period were considered. There were 58 stations with a record length spanning between 90-100% of the period and another 10 stations with record lengths between 75-90%. However, data from selected rainfall stations with records spanning shorter parts of the period were also included. This was done mainly to capture data in cases where rainfall stations were replaced by new stations, with only slightly different locations, within the period under consideration. An example is the rainfall station at OR Tambo International Airport which closed on the 31 May 1989 while another station opened on 1 June 1989 at almost the same location. Data from both these stations were then used in the analysis. Data for 5 locations were combined in this way resulting in a total number of 73 stations available for analysis over Gauteng. Not all of the rainfall stations were operational every day (i.e., there are discontinuities within the time series of some stations) and consequently the number of rainfall stations which were available for analysis varied between 55 and 73 on any given day within the 32-yr period.
Figure 1 depicts the location of the SAWS rainfall stations over Gauteng. The rainfall stations are generally spatially well-distributed throughout the province, with the exception being the north-eastern extremes where no rainfall stations were available. There is a higher concentration of rainfall stations in the major metropolitan areas of Gauteng (Pretoria in the north and Johannesburg, about 50 km from Pretoria to the south).

Quality control of rainfall data
The quality of the rainfall data used, especially in such a large dataset, is of significant concern, and a considerable amount of time was spent performing quality control on the data. Some obvious errors were easy to identify and were removed from the data set. However there were some questionable data values where it was close to impossible to determine the reliability of the observations. The raw rainfall data from SAWS include possible error information, with the daily rainfall values labelled as 'Normal', or 'Error' or 'Accumulated' (if accumulated over more than 1 d). If the rainfall value was labelled anything other than Normal it was not used in the analysis for that particular day. As this research focuses on heavy rainfall it was important to have confidence in the high 24-h rainfall values. Brooks and Stensrud (2000) explain how difficult it is to distinguish between 'rare interesting' rainfall events and 'bad data', as these often look similar. Therefore all rainfall events where 24-h rainfall at a specific station exceeded 115 mm were investigated for possible errors. As will be explained later, 115 mm was identified as a 'single very heavy rainfall event' and represents the 99th percentile of daily maximum rainfall over Gauteng. It does happen from time to time that rainfall which was accumulated is not identified as such in the raw data set. This was relatively easy to identify in the data set when there was missing data for 1 or more days followed by a day reporting very high rainfall. This high rainfall value was then rejected only after comparison with rainfall from surrounding stations, in the process discussed below.
A 2nd set of errors removed from the data was all the cases where a station reported very heavy rainfall for several days in a row while there was no indication from surrounding stations that this did indeed occur. When rainfall at any station over Gauteng exceeded 115 mm on any particular day, the rainfall values at other stations over Gauteng were also analysed. If there were other stations reporting significant rainfall on that day or if there was a high percentage of rainfall stations over Gauteng reporting rainfall the value was accepted as correct. The last error check was to compare the events remaining, after the elimination of events considered by the previous checks, against other meteorological data and journals such as the SAWS newsletters and website and archived Meteosat 2nd Generation data. This was done in order to identify if there was a physical cause for a heavy rainfall event to occur. The real difficulty was in attempting to detect errors in the much larger number of rainfall events where the daily rainfall at a single station was more than 50 mm but did not exceed 115 mm (later defined as a 'single significant rainfall event'). There were too many of these events to hand-check and it would be difficult to determine the accuracy as there were no other data with which to compare it. It is therefore possible that the daily rainfall dataset created as part of this research does contain some errors which may have led to some inaccuracies in the results. However, the impact of this would be limited as the research focused on the heavy rainfall events.
Calculation of average daily rainfall
Using the rainfall data from the selected stations, an average daily rainfall value for Gauteng was calculated. Additionally, the percentage of rainfall stations recording more than 0 mm of rainfall was calculated and the highest rainfall measured at any of the stations was also noted. The average Gauteng rainfall was computed using a weighted average method proposed by Tennant and cited in Marx et al. (2003). This method takes the geographical position of each station relative to the other stations into consideration. The following weighting function was applied to the daily rainfall values of all the stations:

where:
Wgt = weight assigned to station
= sum of the distance between the specific station and all other stations
rmax = maximum distance between the specific station and any other station
N = total number of stations
When rainfall stations are distributed evenly over an area, this method renders results which are very close to the mathematical average (the total rainfall at all the stations divided by the number of rainfall stations). The use of the weighting method becomes important when the rainfall stations are not distributed evenly over an area, as is the case for Gauteng. A rainfall station which is geographically distant (close) to other stations will have a larger (smaller) weight factor and will therefore contribute more (less) in the computation of the average rainfall. The stations with the largest weights were over the western extremes of Gauteng (Fig. 1). Hekpoort in the north-west had a weight of 0.573 and Welverdiend in the south-west 0.568. Other stations with weights larger than 0.5 were Rus De Winter in the extreme north (0.55) and Devon (0.506) and Nigel (0.507) in the south-east. These stations contributed more to the calculation of the average rainfall than the stations over central Gauteng such as Irene (0.390), Pretoria (0.414) and OR Tambo International Airport (0.398). The results from the 2 averaging methods are very similar to those of the weighted average method, generally giving slightly higher daily average values. Of the 5 673 d analysed, the weighted average method produced higher (lower) values than the mathematical average on 753 (560) d. The largest difference occurred on 27 January 1978 when the weighted average was 67 mm and the mathematical average 59 mm. This was a particularly wet day as 23 stations measured more than 50 mm of rain and 11 more than 115 mm. Stations over western Gauteng in particular measured high rainfall values, e.g. Randfontein (100 mm), Krugersdorp (116 mm) and Hekpoort (66 mm). From Fig. 1 one can see that these stations also have higher weights in the calculation of the average and therefore the weighted average was higher than the mathematical average for this day. On 18 December 2006 the weighted average rainfall was 18 mm but the mathematical average was 23 mm. On this day there were only 4 stations with rainfall of more than 50 mm over southern Gauteng, but with 300 mm at Viljoensdrift. Due to the isolated nature of the heavy rainfall, the weights assigned to the stations resulted in the weighted average being lower than the mathematical average; the influence of the extreme rainfall at a single station is therefore de-emphasised.
The average Gauteng daily rainfall was henceforth used to calculate the average Gauteng monthly rainfall and the data standardised in order to identify wet and dry months. Moreover, the rainfall at the individual rainfall stations was investigated in order to identify those locations in Gauteng where heavy rainfall occurs most frequently. This was done by dividing Gauteng into eight 0.5° by 0.5° grid boxes and calculating the number and percentage of stations that exceeded certain thresholds for each grid box for each 24-h period considered.
Defining heavy rainfall
An extreme precipitation event is usually defined by using a daily amount exceeding a certain threshold (Zhang et al., 2001). However, different threshold values apply for different parts of the world. One approach is to define heavy rainfall by considering when the areal average rainfall exceeds a particular threshold. For example, Houze et al. (1990) define a 'major rain event' as one in which more than 25 mm rain falls over an area greater than 12 500 km2 in 24 h. In a South African study, Poolman (contributing to Dyson et al., 2002) defines a heavy rainfall event when more than 25 mm occurs in 24 h in an area of at least 20 000 km2.
The Gauteng Province is approximately 16 500 km2 in size. When the average daily rainfall is at least 25 mm over Gauteng it would fall into the major rain event definition provided by Houze et al. (1990). However, analysis of the daily average rainfall data over Gauteng for the 32-yr period reveals that 25 mm is exceeded only 1% of the time. Over the 32-yr period the daily average rainfall exceeded 25 mm on only 65 occasions. In order to capture 10% of the heaviest rainfall events, a 'significant rainfall event' is defined here by using the 90th percentile, which is 9 mm. A further classification is made, with a 'heavy rainfall event' defined as the 95th percentile, in this case 13 mm, and a 'very heavy rainfall event', similar to Houze's major rain event, when average daily rainfall exceeds 26 mm. However as these thresholds may be applied in an operational environment they were adjusted slightly to fall in line with thresholds commonly used in the forecasting offices. Therefore a 'significant rainfall event' is classified as rainfall exceeding 10 mm, a 'heavy rainfall event' when the rainfall exceeds 15 mm and a 'very heavy rainfall event' when the rainfall exceeds 25 mm.
Extreme precipitation events are often defined by referring to the rainfall from individual stations. Bradley and Smith (1994) define extreme rainstorms as a 'major rain event' when the daily rainfall accumulation is at least 125 mm at 1 or more rainfall stations. However, Chen et al. (2007) define a heavy rainfall event in Taiwan when more than 50 mm occurs in 24 h at 1 or more weather stations and an extremely heavy rain event when 130 mm occurs in 1 d (Chen and Yu, 1988). In a recent study Fragoso and Tildes Gomes (2008) identified an extreme rainfall event over southern Portugal when 40 mm occurred in 24 h.
Zhang et al. (2001) define heavy rainfall separately for different stations in Canada by identifying a threshold value that is exceeded by an average of 3 events per year. They also discuss the characteristics of heavy rainfall by examining the 90th percentile of daily rainfall and the 20-yr return values. Extreme rain events in the U.S. were identified when rainfall at 1 or more rain gauge reported a 24-h rainfall total greater than the 50-yr recurrence amount. This spatially-varying threshold is most relevant to identify truly extreme events for this location (Schumacher and Johnson, 2006).
The maximum daily rainfall which occurred at any station over Gauteng was identified for all summer months. Following the definition for the areal average rainfall the 90th (59 mm), 95th (75 mm) and 99th (113 mm) percentile of these values was used to identify a heavy rainfall event at an individual station. However, the forecasters at SAWS issue advisories and warnings for heavy rainfall when more than 50 mm of rain is expected at any location (Rae, 2008). Therefore a 'single significant rainfall' event is defined when the rainfall at any rainfall station exceeds 50 mm. A 'single heavy rainfall' event is when the rainfall exceeds 75 mm at a single station and a 'single very heavy rainfall event' when the rainfall at a single station exceeds 115 mm. This value is close to the 125 mm used by Bradley and Smith (1994) and the 130 mm used by Chen et al. (2007).
Two additional heavy rainfall classes are defined which combined the areal average rainfall and rainfall at individual rainfall stations. A 'major rain event' is defined when the average daily rainfall over Gauteng exceeds 10 mm with at least 50 mm at a single station and an 'extreme rain event' is defined when the average Gauteng rainfall exceeds 15 mm with more than 75 mm at a single station.
Seasonal rainfall characteristics over Gauteng
The average Gauteng monthly rainfall was calculated for each summer month from 1978 to 2008. The monthly values were used to calculate an average rainfall value for early summer (October to December) and late summer (January to March) as depicted in Table 1. The average summer rainfall (October to March) over Gauteng for this 32-yr period was 587 mm. The highest summer rainfall occurred during the 1995/96 season with 968 mm followed by the summer of 1999/2000 with 793 mm. The driest summer was 1978/79 when the average Gauteng rainfall was 341 mm. The second-driest summer was in 2006/07 when the average rainfall was 364 mm.
The totals depicted in Table 1 were standardised with respect to the long-term average and standard deviation for early and late summer rainfall and the results are depicted in Fig. 2. The 32-yr average early summer rainfall was 278 mm and late summer rainfall 309 mm. The early summer with the highest average rainfall was in 1995 when 452 mm occurred over Gauteng. There were only 2 other years when the early summer rainfall exceeded 400 mm − 1986 (412 mm) and 1993 (406 mm). The early summer rainfall was less than 200 mm on 5 occasions in the past 32 years. Three of these very dry early summers occurred in the past decade (2002, 2003 and 2005). Also note from Fig. 2 the 5 consecutive years of below-normal early summer rainfall (2002 to 2006). This had not transpired before during this 32-yr period, although the early 80s had 3 consecutive dry years.
It is no surprise to find that the wettest late summer over Gauteng was in 2000, with 568 mm of rain, as tropical cyclone Eline invaded southern Africa in February 2000 (Dyson and Van Heerden, 2001) and was responsible for widespread heavy rainfall over the entire sub-continent, including Gauteng. Other particularly wet late summers were 1978, 1991, 1996, 1997, 2006 and 2008, with more than 400 mm of rain. The driest late summer in this 32-yr period was in 2007 when a meagre 110 mm occurred. This value is lower than in 1992 (164 mm) and 1983 (186 mm). The latter 2 years have been identified as the years when the strongest droughts occurred over the summer rainfall area of South Africa (Rouault and Richard, 2003) since the 1921 drought. Although Fig. 2 depicts only Gauteng rainfall, it may be noted that a contributing factor to the severity of the drought during these 2 years was that the dry late summers were preceded by dry early summers. Indeed, from considering Fig. 2 it seems that notably low average early and late summer rainfall occurs rather seldom in 1 rainfall season. The correlation coefficient between early and late summer rainfall is only 0.027 indicating that there is no significant correlation between early and late summer rainfall over Gauteng. The appreciably dry early and late summers of 1978/79, 1982/83 and 1991/92 are therefore quite noteworthy. An equally rare event is a very wet early summer followed by a very wet late summer, which only happened in 1979/80 and 1995/96.
The very high rainfall totals over Gauteng in early 2000 (568 mm) were preceded by a dry early summer rainfall season when only 225 mm occurred. On 4 occasions a noteworthy wet (0.5 on the ordinate on Fig. 2) early summer was followed by a very dry late summer (1983/84, 1998/99, 2000/01 and 2001/02). It also happened at least 4 times that very dry early summers were followed by very wet late summers.
The dashed line on Fig. 2 is the trend line for early summer rainfall and the solid line the trend line for late summer rainfall. These trend lines indicate a decrease in the early summer rainfall while an increase is observed in the late summer rainfall over Gauteng. Trend analysis was done using the nonparametric Mann-Kendall test (Hcigizoglu et al., 2005). The downward trend in early summer rainfall has a confidence level of only 62% while the confidence level of the upward trend in late summer is 82%. Therefore the trends observed on Fig. 2 are considered to be statistically not significant. However, further statistical trend analyses of the rainfall over Gauteng is recommended as recent work by Engelbrecht et al. (2009) found that the model-projected climate change shows an increase in summer rainfall over north-eastern South Africa.
Monthly and daily rainfall characteristics over Gauteng
January months
January months received the highest average monthly and daily rainfall over Gauteng. They also have the second-highest number of days with rain. The standard deviation of the monthly average rainfall was the highest in January and February months indicating the high variability in the monthly average rainfall during these 2 months. This is reflected in the values in Table 2 indicating that the average January rainfall is 126 mm but the minimum monthly average rainfall was only 56 mm in 2001. In contrast, in 1978 rainfall of 324 mm was recorded; this is the highest monthly rainfall for any month during this 32-yr period. In the same month the monthly averaged daily rainfall was 10.5 mm, more than double the average for all January months (4.1 mm). On average rainfall occurs quite often during January months as more than 0 mm of rain was recorded on 23 d. In 2005 there were 28 d with some rain and in 2001 and 2007 only 14 d with rain.
December months
December months have the second-highest monthly average rainfall (109 mm) and they have the most days with some rain (24 d). The December months of 1988 and 1991 had 29 d on which some rainfall occurred. The standard deviation of the average monthly December rainfall is 30 mm. This value is about half of the standard deviation in January and February months.
February and November months
The average monthly rainfall for November months (96 mm) and February months (97 mm) is very similar as is the number of days with more than 0 mm of rain at approximately 20 d. However, the standard deviation in November was 45 mm while it is 59 mm in February. The minimum average monthly rainfall in a November month was 17 mm (2002) with a maximum of 183 mm in 1989. The minimum average monthly rainfall value in February months (25 mm) is similar to November months but the maximum monthly rainfall was significantly higher at 277 mm.
March and October months
The average monthly rainfall during March (86 mm) was higher than in October (72 mm) even though the number of days with some rain was very similar (15 to 17 d). The standard deviation of the average monthly rainfall in March was 54 mm and 40 mm in October. The maximum monthly average rainfall in a March month was approximately 100 mm more in March (296 mm) than in October (190 mm).
It is also interesting to note from Table 2 that the month with the most rain days did not necessarily coincide with the month with the highest rainfall. For example, the highest rainfall in a December month was in 1995 but this month had only 23 d with rain, very close to the monthly average. Some rainfall occurs on average on 118 d in the summer season, which is 64% of all days in summer. The 2006/07 rainfall season was particularly dry as it had only 98 d with rain. The 1993/94 season had 142 d with some rain; this is close to 80% of the summer days.
A South African weather forecaster should be aware of the increase in the average monthly rainfall during the progression of the summer from October to January with a decrease in February and March. On average October will receive some rainfall on about 50% of the days while in December and January more than 70% of the days receive some rainfall on average. By March the number of rain days has decreased to about 50%. Weather forecasters should also take cognisance of the fact that even though the average monthly rainfall in January is higher than in December months, December has slightly more days with rain with a lower variability in the monthly average rainfall. The average monthly rainfall in late summer has high variability with maximum average monthly rainfall values all above 250 mm.
Synoptic circulation in wet and dry seasons
The average 850 and 500-hpa geopotential heights for the wettest and driest early and late summer seasons are displayed in Fig. 3. The average early summer rainfall of 1995 was 452 mm and there were 5 d when the area-average rainfall was more than 25 mm, while there were 4 d when rainfall at a single station exceeded 115 mm. At the 850 hPa level a deep low pressure system (1 490 gpm) was located over northern Namibia, extending a trough to the south coast of South Africa (Fig. 3A). The Indian Ocean High (IOH) was responsible for the inflow of warm moist air from over the Mozambique Channel into Gauteng. At the 500 hPa level (Fig. 3C) the average early summer geopotential height field shows a weak trough west of South Africa and a high over northern Namibia/Botswana. The early summer of 1978 had only 159 mm of rain, there were no days which had area-average rainfall of more than 25 mm and only 2 d which had area-average rainfall of more than 15 mm. There were 5 d where rainfall at a single station exceeded 50 mm (compared to the 20 d in 1995), and there was not a single day that had more than 115 mm. At the 850 hPa level the trough was established over the western interior of South Africa while the low pressure over Namibia was considerably weaker (1 510 gpm) and located further west than in 1995 (Fig. 3B). The IOH extended over the eastern interior of the subcontinent. At the 500 hPa level the trough which was present in 1995 was not present and the high pressure over northern Namibia was stronger than in 1995 (Fig. 3D).
In the late summer of 2000, 568 mm of rain occurred. There were 5 d when the area-average rainfall was more than 25 mm and there were 7 d when the rainfall at a single station exceeded 115 mm. There are many similarities between the 850 hPa geopotential height fields in the early summer of the 1995/96 season and the late summer of the 1999/2000 season. In both instances the low over northern Namibia was dominant and the trough extended southwards over central and western South Africa. The IOH was located south-east of South Africa in 2000 allowing for a more direct inflow of moisture from the Mozambique Channel over South Africa (Fig. 3E). At the 500 hPa level a trough was present west of South Africa extending northwards and dividing the high pressure over Namibia into 2 cells. The eastern cell was located far to the south-east over southern Botswana and northern South Africa. In 2007 only 110 mm of rain occurred on average over Gauteng. There were no days when the area-average rainfall exceeded 25 mm, and 50 mm at a single station was exceeded only on 4 d. In 2000 it happened on 46 d. At the 850 hPa level the high pressure was located over the eastern interior and although the low over Namibia was present (1 505 gpm) it was considerably weaker than in 2000 (1 480 gpm). A strong 500-hPa high (5 890 gpm) was present over Namibia (Fig. 3H).
Daily area-averaged heavy rainfall characteristics over Gauteng
The maximum area-averaged rainfall which occurred on any day over Gauteng during this period was 70 mm on 28 October 1986 (Table 2). The second-highest average daily rainfall occurred on 27 January 1978 (67 mm). The average daily rainfall exceeded 50 mm on only 5 d during this 32-yr period. Two of these events occurred in January months and 2 in March months. On 28 October 1986 the weather system over South Africa was what Taljaard (1996) defined as a southward extending V-shaped trough. There was a well-established low pressure system over Botswana at 850 hPa advecting warm humid surface level air into Gauteng. At 500 hPa a weak trough was present over the south-western parts of the country. All the other weather systems responsible for rainfall in excess of 50 mm over Gauteng were westerly troughs, cold cored in the upper troposphere, the only exception being that of 27 January 1978 when there was a continental low pressure system over Botswana (Dyson and Van Heerden, 2002).
Daily area-averaged rainfall in January months
Table 2 presents the average number of days per month on which the areal average rainfall exceeds the thresholds of the 3 different heavy rainfall classes ('significant rain event', 'heavy rain event' and 'very heavy rain event'). January months have the most 'significant' (3.8 d), 'heavy' (1.6 d) and 'very heavy' (0.5 d) rainfall days. Rainfall exceeding 10 mm occurred quite regularly during January as 94% of the years had at least 1 such an event. Heavy rainfall occurred in 63% of the Januaries (the same percentage of October and December months) and very heavy rainfall occurred in 34% of the Januaries. The average number of significant rainfall days per month may give the weather forecaster an idea of how likely such an event is in any particular month. It may also be instructive to provide information on how often these events occur on consecutive days in any month. January was the month with the highest number of multiple heavy rainfall days for all 3 heavy rainfall classes. There were 11 significant rainfall days in 2006, 8 heavy rainfall days and 4 very heavy rainfall days in 1978. These values were not surpassed in any of the other summer months. Rainfall exceeding 25 mm was not observed in a January on 2 d in a row but in 1978 there were 5 consecutive days with 'heavy rainfall' and 6 with 'significant rainfall'.
Daily area-averaged rainfall in February and March months
The heavy rainfall characteristics in February and March are similar to January. Significant rainfall occurred on average on 2.8 d in February and 2.6 d in March. These events were quite frequent as 91% of the years had days with significant rainfall and multiple events had been regular in both months. February had the highest number of average heavy rainfall days (1.7 d) and these events occurred in 72% of the years. In February 1996 there were 5 consecutive days when the average rainfall exceeded 15 mm. Very heavy rainfall occurred in approximately a quarter of February and March months.
Daily area-averaged rainfall in December months
December had the second-highest number of significant rainfall days (2.9 d) and these events occurred in 97% of the years. However, December had the lowest average number of heavy rainfall (1 d) and very heavy rainfall (0.22 d) days. Very heavy rainfall is rare in December months as it occurred in only 16% of the years.
Daily area-averaged rainfall in October and March months
The characteristics of heavy rainfall during October and November months are similar. Both months had on average just over 2 d per month with significant rainfall, 1.1 d with heavy rainfall and approximately 0.3 d with very heavy rainfall. Significant rainfall occurred in more than 80% of the years and both months had 4 consecutive days with these events. There were less multiple days with significant, heavy and very heavy rainfall per month than in late summer. Very heavy rainfall occurred in only 19% of October months and 28% of November months.
There are on average 16.8 significant rainfall days per season. This is more than 100 d less than the number of days when the average daily rain exceeds 0 mm (Table 2). There are on average 7.8 heavy rainfall days and 2.16 very heavy rainfall days. In the very wet 1995/96 season there were 31 significant rain days, 18 heavy rainfall days, and 10 very heavy rainfall days.
Heavy rainfall at individual stations
The highest 24-h rainfall which was recorded at any rainfall station during this 32-yr period was 300 mm which occurred on 18 December 2006 at Viljoensdrift, located in southern Gauteng (Fig. 1). On 18 December 2006 the atmospheric circulation over South Africa was dominated by a deep surface trough, extending to a low off the south-east coast. There was a strong inflow of surface moisture into the central interior from Botswana and Zambia. At 500 hPa there was a high pressure system located over northern Namibia causing south-westerly winds over Gauteng. The second-highest 24-h rainfall at a single station, 280 mm, occurred on 27 January 1978 at Rietondale in Pretoria. This was the same day which received the highest area-averaged rainfall and, as mentioned earlier, the weather system on this day was a continental tropical low pressure. There were a further 6 d when the maximum daily rainfall at any station exceeded 200 mm. Two of these events happened in October months (29 October 1995 and 25 October 2001) and 1 in March (19 March 2003). On these days a cut-off low pressure system was present over South Africa. The other 3 events were all caused by westerly troughs. The monthly maximum rainfall was less than 200 mm only in February months as the highest rainfall recorded during a February was 142 mm in 1996.
The average and maximum number of days when rainfall at an individual station exceeds the 3 different heavy rainfall classes is depicted in Table 3. The percentage of years in which these events occurred is also indicated on Table 3 as well as the maximum number of consecutive days of occurrence. The last row indicates the seasonal averages and extremes.
Single station significant rainfall
Rainfall exceeded 50 mm at a single station on nearly 28 d in a summer season. January months had the most days with single station significant rainfall events (7 d), followed by December and February with close to 5 d. In January 2006 there were 17 d when daily rainfall exceeded 50 mm for at least 1 station, and in January 2008 there were 8 consecutive days with single station significant rainfall over Gauteng. This was surpassed only in February of 1996 when 50 mm was exceeded at a single station on 9 consecutive days. The season with the highest number of single station significant rainfall days was the 1999/2000 summer season which had 56 d, 46 of these days occurring in late summer. The lowest seasonal total of significant single station rainfall was in 1985/86 with only 7 of these days. Figure 2 shows that it was the late summer of the 1985/86 season that was particularly dry but during this time there were at least 3 d when rainfall exceeded 50 mm at a single station. Even the extremely dry 1982/83 and 1991/92 had 11 and 15 of these events respectively. Significant rainfall at single stations occurs frequently, even during years which are considered to be dry. All January months had some days with these events and it occurred in 78% of October months.
Single station heavy rainfall
Rainfall exceeding 75 mm at a single station (single station heavy rainfall) occurred infrequently, with the average monthly occurrences being less than 2 d for all summer months, except for January (2.6 d). January months had at least 1 such event in 88% of the years, while in December these events occurred in about half of the years (53%). February 2000 and March 1997 had a maximum of 10 of these days in a single month. During February 1996, there were 6 consecutive days when the rainfall exceeded 75 mm. Single station heavy rainfall events occur on nearly 10 d a season. There were 24 of these days during the 1999/2000 summer and not a single day during the 1983/84 season. Figure 2 shows that the average early summer rainfall of the 1983/84 season was above normal, as 377 mm was recorded over Gauteng from October to December. There were 69 d with rain during these 3 months; however, on none of these days did the rainfall at a single station exceed 75 mm.
Single station very heavy rainfall
Single station rainfall exceeding 115 mm is very rare over Gauteng. During the 32-yr period, rainfall at any station exceeded 115 mm on only 59 d. On average these events occur on less than 1 d in each of the summer months. January months have the highest average value (0.59 d) but only 38% of the years recorded at least 1 of these events. There were only 19 d in all the January months where rainfall at a single station exceeded 115 mm. Rainfall at a single station exceeded 115 mm on 3 d during October 2000. However, these events were rare in October as it occurred in only 19% of the years. The events were most infrequent in November months as only 6% of the years received some of these events. There were only 2 Novembers, 1995 and 2001, which had days with very heavy rainfall at a single station. Bearing in mind the areal average rainfall as depicted in Table 2, February had the second-highest number of very heavy rainfall days. However, Table 3 shows that very heavy rainfall at a single rainfall station during February months is very rare, as only 13% of the years had days when the rainfall at a single station exceeded 115 mm. Considering that there were only 59 d during this 32-yr period which had rainfall of more than 115 mm at a single station, the unique rainfall character of the 1995/96 rainfall season is again emphasised (Table 3), as there were 10 'single station very heavy rainfall' days during this 1 season alone – 5 d in early summer and 5 d in late summer.
Location of heavy rainfall at individual stations
The number of stations which recorded more than 75 mm and more than 115 mm were calculated for the 8 grid boxes over Gauteng for the entire period. These results are depicted in Fig. 4 and are expressed as the total number of events per 100 stations. Single station significant and heavy rainfall events occur most frequently over the central and north-western parts of Gauteng. The main watershed in the Witwatersrand which divides the province into 2 major catchments, the Crocodile catchment to the north and the Vaal catchment to the south, lies between 26°S and 26°15′S. The 3 grid boxes located south of this watershed receive only half the number of single station heavy and very heavy rainfall events when compared with those grid boxes further to the north. Consider Fig. 3 and the average 850 hPa geopotential height fields in the very wet early summer of the 1995/96 season (Fig. 3A) and in the late summer of the 1999/2000 season (Fig. 3E). These maps illustrate that during seasons which receive a high number of heavy and very heavy rainfall days there is a deep surface low pressure system over northern Namibia and an IOH located east or south-east of South Africa. This high pressure causes an inflow of warm moist tropical air from the Mozambique Channel, which curves around the high pressure system and enters Gauteng from the north. The moisture-laden air is then forced to rise against the Witwatersrand resulting in a higher number of heavy rainfall events at the stations north of the watershed than further to the south.
Major and extreme rain events
The last 2 columns of Table 3 depict the results for the major (rainfall at a single station exceeded 50 mm and the average rainfall exceeded 10 mm) and extreme (rainfall at a single station exceeding 75 mm and the average rainfall exceeding 15 mm) rain events. On average January months have 3.1 major rain events per year followed by February which has 2.3 events. October months have the lowest number of events at 1.3 events. There is an average of 12.1 of these events per summer season. The maximum number of days with major rain events occurred in 1995/96 which had 23 such events. The maximum number of these events occurred in January 2006 with 11 d, followed by 9 d in February 1996. Major rain events occur relatively frequently as 84% of all December and January months had at least 1 of these events compared to only 63% of October and November months. Extreme rain events occur much less frequently. Fifty-six percent of January months received extreme rain events, followed by 50% of February months and 44% of March months. January and February on average both have approximately 1 d with major rain events and all the early summer months 0.4 d. The late summer months all had a maximum of 5 of these events.
Discussion
January months have the highest average monthly rainfall; January had, on average, 23 d with rain and January also had the most significant, heavy and very heavy rainfall days. Approximately 20% of all significant, heavy and very heavy rainfall events occurred in January months. Every single January of this 32-yr period had at least 1 d with rainfall of more than 50 mm and there were in total 19 d in January where the rainfall at an individual station exceeded 115 mm. This is a third of the total number of these events.
December had the second-highest average monthly rainfall and on average receives 24 d with some rain. December had approximately 3 d per year when the average Gauteng rainfall exceeded 10 mm. However December had the lowest number of heavy and very heavy rainfall days. The highest 24-h rainfall at any station (300 mm) did occur in a December month but, considering the rainfall at individual rainfall stations, 115 mm was exceeded on only 7 d during December months and this occurred in about 20% of all the years.
The average monthly rainfall in February was lower than in December and it had, on average, only 19 d with rain. The average monthly rainfall during February months had a greater variance than in December months, as depicted by the standard deviation in Table 2. There were fewer days with some rain than in December but more heavy and very heavy rainfall days. However extreme rainfall at an individual station was rare in February. There were only 6 d when the rainfall exceeded 115 mm. This seems to suggest that heavy and very heavy rainfall events during February months are associated with widespread rainfall over the entire province rather than copious rainfall at a single station.
October and March months may be considered the transition months as summer starts in October and ends in March. On average March receives more rainfall than October and also had slightly more days with rain. Heavy rainfall events occur on average approximately on 1 d per month in both months and very heavy rainfall on about 0.35 d per month. The highest average daily rainfall was recorded in an October month at 69 mm. There were on average more days with rainfall in excess of 50 and 75 mm at a single station in March than in October.
Heavy and very heavy rainfall events occur more frequently in late summer, when 60% of these events were recorded. The same distribution is also present in the rainfall at individual stations. Sixty percent of days with more than 50 mm at a station, 65% of the days with more than 75 mm, and 63% of those days with more than 115 mm occur in late summer. Rainfall stations located over the central and north-western part of Gauteng receive rainfall in excess of 75 and 115 mm more frequently than those in the south and south-east. On 7 of the 8 days when rainfall at a station surpassed 200 mm the atmospheric circulation was dominated by cold upper tropospheric temperatures and troughs or lows in the westerly circulation. On the remaining day a continental tropical low was situated over Botswana.
Whenever the rainfall over Gauteng exceeds 0 mm, the percentage of rainfall stations reporting some rainfall is 40% on average. For significant, heavy and very heavy rainfall events the percentage of rainfall stations reporting more than 0 mm exceeds 80%. These events happen when most of Gauteng receives some rainfall and may be classed as widespread heavy rainfall events. However, when the rainfall at an individual rainfall station exceeds 50 mm (the criteria used by the forecasters to issue warnings of heavy rainfall) the average percentage of rainfall stations reporting some rainfall is approximately 50%. Heavy rainfall at single stations is therefore an isolated event which does not necessarily occur on days when the entire province receives some rainfall.
Acknowledgements
The author would like to express her sincere appreciation to Colleen de Villiers from the South African Weather Service for the rainfall data. Francois Engelbrecht is acknowledged for his many useful suggestions to enhance this paper and Christien Engelbrecht for the interest shown and many fruitful discussions. The South African Water Research Commission Project No. K5/1333 deals with the early warning of heavy rainfall and its support is acknowledged. The author also acknowledges the 2 anonymous reviewers, whose comments helped to clarify and improve the manuscript.
References
BEAVON KSO (2004) Johannesburg: The Making and Shaping of the City. UNISA Press, Pretoria. 373 pp. [ Links ]
BRADLEY AA and SMITH JA (1994) The hydrometeorological environment of extreme rainstorms in the southern plains of the United States. J. Appl. Meteorol. 33 1418-1431. [ Links ]
BROOKS HE and STENSRUD DJ (2000) Climatology of heavy rain events in the United States from hourly precipitation observations. Mon. Weather Rev. 128 (4) 1194-1201. [ Links ]
CHEN GT and YU C (1988) Study of level jet and extremely heavy rainfall over northern Taiwan in the Mei-Yu season. Mon. Weather Rev. 116 884-891. [ Links ]
CHEN C, CHEN Y, LIU C, LIN P and CHEN W (2007) Statistics of heavy rainfall occurrences in Taiwan. Weather Forecasting 22 (5) 981-1002. [ Links ]
DE CONING E, FORBES GS and POOLMAN EP (1998) Heavy precipitation and flooding on 12-14 February 1996 over the summer rainfall regions of South Africa: Synoptic and isentropic analyses. Natl. Weather Dig. 22 25-36. [ Links ]
DYSON LL and VAN HEERDEN J (2001) The heavy rainfall and floods over the northeastern interior of South Africa during February 2000. S. Afr. J. Sci. 97 80-86. [ Links ]
DYSON LL and VAN HEERDEN J (2002) A model for the identification of tropical weather systems. Water SA 28 (3) 249-258. [ Links ]
DYSON LL, VAN HEERDEN J and MARX HG (2002) Short-Term Forecasting Techniques for Heavy Rainfall. WRC Report No. 1011/1/02. Water Research Commission, Pretoria, South Africa. [ Links ]
ENGELBRECHT FA, McGREGOR JL and ENGELBRECHT CJ (2009) Dynamics of the Conformal-Cubic Atmospheric Model projected climate-change signal over South Africa. Int. J. Climatol. 29 (7) 1013-1033. [ Links ]
FRAGOSO M and TILDES GOMES T (2008) Classification of daily abundant rainfall patterns and associated large-scale atmospheric circulation types in Southern Portugal. Int. J. Climatol. 28 (4) 537-544. [ Links ]
GAUTENG DEPARTMENT OF HOUSING (2006) Gauteng Housing Annual Report 2006. Gauteng Department of Housing, Marshalltown. [ Links ]
HCIGIZOGLU HK, BAYAZIT M and ÖNÖZ B (2005) Trends in the maximum, mean, and low flows of Turkish rivers. J. Hydrometeorol. 6 (3) 280-290. [ Links ]
HOUZE RA, SMULL BF and DODGE P (1990) Mesoscale organization of springtime rainstorms in Oklahoma. Mon. Weather Rev. 118 613-654. [ Links ]
KRUGER AC (2004) Climate of South Africa. Climate Regions. WS45. South African Weather Service, Pretoria, South Africa. [ Links ]
MADDOX RA, CHAPPELL CF and HOXIT LR (1979) Synoptic and meso-α scale aspects of flash flood events. Bull. Am. Meteorol. Soc. 60 115-123. [ Links ]
MARX HG, DYSON LL and VAN HEERDEN J (2003) Verification of rainfall forecasts for the Vaal Dam catchment for the summer rainfall seasons of 1994 to 1998. Water SA 29(2) 195-200. [ Links ]
NGUBO N, MALALA R, MABUSELA X, DE CONING E, ROSENFELD D and KERKMANN J (2008) Hailstorm in Potchefstroom area (South Africa, 27 October 2004). URL: http://www.eumetsat.int/Home/index.htm (Accessed 14 November 2008). [ Links ]
RAE KJ (2008) Personal communication. Chief Forecaster, National Forecast Centre, South African Weather Service, Bolepi House, Pretoria. [ Links ]
ROUAULT M and RICHARD Y (2003) Intensity and spatial extension of droughts in South Africa at different time scales. Water SA 29 (4) 489-500. [ Links ]
SCHUMACHER RS and JOHNSON RH (2006) Characteristics of U.S. extreme rain events during 1999-2003. Weather Forecasting 21 (1) 69-85. [ Links ]
SINGLETON AT and REASON CJC (2007) Variability in the characteristics of cut-off low pressure systems over subtropical southern Africa. Int. J. Climatol. 27 (3) 295-310. [ Links ]
SAWS (SOUTH AFRICAN WEATHER SERVICE) (1998) Climate of South Africa. Climate statistics 1961-1990. WB42. South African Weather Service, Pretoria, South Africa. [ Links ]
TALJAARD JJ (1996) Atmospheric Circulation Systems, Synoptic Climatology and Weather Phenomena of South Africa. Part 6: Rainfall in South Africa. South African Weather Service Technical Paper 32. South African Weather Service, Pretoria, South Africa. [ Links ]
VIVIERS G and CHAPMAN V (2008) Severe thunderstorm at Johannesburg International Airport (03 December 2004). URL: http://www.eumetsat.int/Home/index.htm (Accessed 14 November 2008). [ Links ]
ZHANG X, HOGG WD and MEKIS E (2001) Spatial and temporal characteristics of heavy precipitation events over Canada. J. Climate 14 1923-1936. [ Links ]
Received 9 February 2009;
accepted in revised form 26 August 2009.
* To whom all correspondence should be addressed.
+2712 420 2469; fax: +27 (0)86 6592154;
e-mail: liesl.dyson@up.ac.za
WA WelderufaelI,II; PAL le RouxI,*; M HensleyI
IDepartment of Soil, Crops and Climate Sciences University of the Free State, Bloemfontein 9300, South Africa
IIDepartment of Civil Engineering & Built Environment, Central University of Technology, Bloemfontein, 9300, South Africa
ABSTRACT
Droughts, resulting in low crop yields, are common in the semi-arid areas of Ethiopia and adversely influence the well-being of many people. The introduction of any strategy that could increase yields would therefore be advantageous. The objective of this study was to attempt to assess the influence of in-field rainwater harvesting (IRWH), compared to conventional tillage, on increasing the amount of water available to a crop like maize on a semi-arid ecotope at Melkassa situated in the eastern part of the Rift Valley.
To achieve the objective of the study rainfall-runoff measurements were made during 2003 and 2004 on 2 m x 2 m plots provided with a runoff measuring system and replicated 3 times for each treatment. There were 2 treatments: conventional tillage (CT) on which hand cultivation was practised in a way that simulated the normal local CT; and a flat surface simulating the no-till, undisturbed surface of the IRWH technique (NT).
Rainfall-runoff measurements were made over 2 rainy seasons during which there were 25 storms with > 9 mm of rain. From the 25 storms, only the 2nd season storms (8 storms) had runoff measurements. These storms were used for calibration and validation of the Morin and Cluff (1980) runoff model (MC Model). Appropriate values for final infiltration rate (If), surface storage (s) and for the crusting parameter (γ) were found to be: 6 mm·h-1; 1.0 mm for NT and 6.0 mm for CT; 0.6 mm-1, respectively.
The measured runoff (R) for the 2004 rainy season expressed as a fraction of the rainfall during the measuring period (P), i.e. R/P, gave values of 0.59 and 0.40 for the NT and CT treatments, respectively. There was a statistical difference between the runoff on the 2 treatments.
Selected results from 7 years of field experiments with IRWH at Glen in South Africa were used together with measured maize yields and climate data over 16 seasons on the nearby Melkassa Experiment Station to estimate the yield benefits of IRWH compared to CT on the ecotope studied. The results ranged between 35 and 1 437 kg with a mean of 711 kg·ha-1 over the 16 years. At Melkassa this was an estimated yield increase ranging from 13% to 49%. The mean increase was 33%.
Keywords: in-field rain-water harvesting, maize, yield increase, rainfall intensity, runoff, semi-arid ecotope
Nomenclature
| CT | conventional tillage |
| Di | accumulated rain depth during time segment i (mm) |
| DoY | day of year |
| Es | evaporation from the soil surface (mm) |
| ET | evapotranspiration (mm) |
| ETo | reference evapotranspiration (mm) |
| ETinc | increment in evapotranspiration (mm) (see Table 5) |
| FΔti | total infiltration (mm) during time segment Δti with rainfall intensity |
| If | final infiltration rate (mm·h-1) |
| Ii | initial infiltration rate of the soil (mm·h-1) |
| It | instantaneous infiltration rate (mm·h-1) |
| IRWH | in-field rainwater harvesting |
| MC Model | Morin and Cluff (1980) runoff model |
| NT | no-till |
| P | rainfall during the measuring period (mm) |
| Pi | rainfall intensity (mm·h-1) |
| Pi | rainfall intensity during time segment i (mm·h-1) |
| s | surface storage |
| ﻻ | crusting parameter (mm-1) |
| R | runoff (mm) |
| Ri | runoff during time segment i of the storm (mm) |
| ratio of runoff to rainfall (dimensionless) | |
| RWP | rain-water productivity (kg·mm-1) |
| SDi | maximum storage and detention (mm) |
| SDm | maximum surface detention (mm) |
| T | transpiration (mm) |
| ti | time from beginning of the storm (h) |
| WPET | water productivity for a particular growing season expressed in terms of the grain yield per unit of water used for evapotranspiration (kg·ha-1·mm-1) |


Willmot statistical parameters
| D-index | index of determination |
| MAE | mean absolute error |
| RMSE | root main square error; with subscripts s and u indicating the contributions of systematic and unsystematic error, respectively |
| R2 | regression coefficient |
Introduction
More than 80% of Ethiopia's population is involved in agriculture, the backbone of the country's economy. Crop production is mostly under rain-fed conditions, most of which is marginalised by water stress (Ministry of Agriculture (MoA), 2000). This, and the frequent droughts, is a serious threat to those engaged in agriculture. The optimum utilisation of rain-water is therefore of utmost importance, requiring diligent adherence to the principle of 'more crop per drop', as appropriately stated recently by the former UN Secretary General, Kofi Annan. In scientific terms this means improving RWP, recently defined by Botha (2007) as the total long-term grain yield divided by total long-term rainfall.
One way of improving RWP is through the use of water harvesting. Many types of water conservation techniques that show significant crop yield increases have been tested worldwide (Berry and Mallet, 1988; Mwakalila and Hatibu, 1993; Kronen, 1994; Gicheru et al., 1998 and Ojasvi et al., 1999). A technique that has given good results in a semi-arid area of South Africa is IRWH as described by Hensley et al. (2000). This technique is also known as mini-catchment runoff farming (Oweis et al., 1999). The technique is illustrated in Fig. 1. It combines the advantages of water harvesting from the no-till, flat, crusted runoff strip, and decreased evaporation from the deeply infiltrating runoff water which accumulates in the mulched basin area. The technique led to maize yield increases of between 25% and 50% compared to conventional tillage practices, and resulted in significant increases in RWP. It was shown that the technique is suited to semi-arid areas with crusting soils that have a high water storage capacity (Botha et al., 2003).

Rainfall in semi-arid areas with fine-textured soils is mainly lost through evaporation from the soil surface (Es) and runoff (R). Under these conditions Es can be 60% to 70% of the annual rainfall (Bennie and Hensley, 2001), and R can vary between 8% and 49% of the annual rainfall depending on the prevailing conditions (Haylett, 1960; Du Plessis and Mostert, 1965; Bennie et al., 1994; Hensley et al., (2000) and Botha et al., 2003). Studies by Morin and Benyamini (1977) and Morin and Cluff (1980) showed that the most important factors influencing runoff in semi-arid areas were: rainfall intensity (Pi); the final infiltration rate of the soil (If), which is greatly decreased by crusting; the extent to which the soil surface can store water before runoff starts which is described by a parameter termed surface detention (SD); and a crusting parameter (γ) describing its rate and extent of development. Their studies resulted in the formulation of a runoff model that satisfactorily predicted runoff from crusted soils in Arizona (Morin and Cluff, 1980), and in Israel (Morin et al., 1983). The model has been successfully used by Zere et al. (2005) for predicting the runoff measured by Du Plessis and Mostert (1965) over 18 years on a Tukulu form soil (Soil Classification Working Group, 1991) at Glen, South Africa.
The basis for the Morin and Cluff (1980) runoff model is provided by the following infiltration equation for crusted soils developed by Morin and Benyamini (1977):

Morin and Cluff (1980) showed that by integrating Eq. (1) with regard to time, and introducing changes in Pi over time segments of a storm (Δti), the following expression was valid:

where:
FΔti = total infiltration during time segment Δti with rainfall intensity Pi (mm)
The other parameters are as defined for Eq. (1).
If the soil surface were such that it did not store any water before runoff occurred, then for any time segment during which Pi > If, the runoff for each time segment Δti of a storm, i.e. Ri, could be calculated as:

This is, however, not the case in practice as a soil surface always has some degree of surface roughness which will cause rain-water to accumulate, to an extent dependent on the degree and configuration of the roughness before runoff commences. Morin and Cluff (1980) deal with this factor by combining the Di of Eq. (2) and 'a surface detention' parameter (SD) into a parameter, SDm, termed 'maximum storage and detention'. By introducing this term into Eq. (3) they showed that it was possible to compute the runoff of any storm, segment by segment, using the following equation:

Substitution of the right-hand side of Eq. (2) into the FΔti term of Eq. (4) provides the complete Morin and Cluff (1980) runoff equation, i.e. Eq. (5):

Equation (5) provides the basis for the MC Model. It enables the computation of the runoff of any storm, segment by segment.
Now consider the importance of the flat, crusted, no-till runoff strip in Fig. 1 in relation to Eq. (5). The parameters SDm and If are minimised, and Ri into the basin area is therefore maximised. The result is efficient conservation of runoff water which otherwise would have been lost. Values for Ii and If are relatively easily measured for a particular soil. Therefore if Pi and R are measured on an experimental plot (rainfall-runoff relationships) γ and SDm can be determined by iteration. The Morin and Cluff (1980) runoff model (MC Model) is thus clearly well suited for predicting the benefits of IRWH for crop production in semi-arid areas with crusted soils. It was therefore concluded that if rainfall-runoff relationships on selected ecotopes in Ethiopia could be determined, it would enable researchers to quantify the extent to which the IRWH technique would result in increased yields.
Hypothesis
- The in-field water harvesting technique described in Fig. 1 will result in increased crop yields compared with conventional tillage on certain semi-arid ecotopes of Ethiopia.
- The MC Model will satisfactorily predict runoff on the chosen ecotopes.
- It will be possible to make reasonable estimates of yield increases on the selected ecotopes using IRWH by predicting the extent of runoff collected in the basins, and therefore prevented from leaving the field and becoming unavailable to the crop.
Objectives
- To quantify rainfall-runoff relationships on the semi-arid Melkassa ecotope in Ethiopia over 2 rainy seasons.
- To calibrate the MC Model for the Melkassa ecotope.
- To estimate for the Melkassa ecotope the maize yield benefits using the IRWH technique described in Fig. 1, compared to conventional tillage. Data from the first objective will be used to do this.
Procedure
Study site
The study was carried out at Melkassa in one of the semi-arid regions of Ethiopia for 2 main rainy seasons during 2003 and 2004. Melkassa is located in the central part of the rift valley at longitude 39.31º E and latitude 8.43º N. The altitude is 1 550 m a. m. s. l. and the chosen site represents a gently sloping plain with a slope ranging from 0% to 5% comprising a foot slope of the rift valley. The ecotope is described by the geographic site name followed by the name of the soil. The soil is classified as a Hypo Calcic Regosol (WRB classification). The ecotope name is therefore Melkassa Calcic Fluvic Regosol. This soil covers about 10% of Ethiopia and about 16% of the rift valley (FAO, 1984; FAO, 1998b; Itanna, 2005).
Experimental design
The experiment was carried out at Melkassa Agricultural Research Center (MARK) research field with a slope of 1%. There were 2 treatments and 3 replications in a randomised complete block design. The plot size was 2 m x 2 m. The treatments were:
- Conventional tillage (CT), i.e. the normal/traditional farmer's tillage practice
- No tillage on a flat surface (NT), i.e. simulating the runoff strip of IRWH.
Both treatments were uncropped and weeds were controlled by hand weeding. The lower side of each plot was equipped with a runoff collecting device. Each plot was surrounded by a galvanised iron sheet protruding 20 cm to 30 cm above the surface of the soil, and inserted about 20 cm deep into the soil. This 'wall' served to isolate each plot hydraulically. Runoff was collected in a gutter at the lower side of the plot. The gutter channelled the runoff water into a 200 ℓ barrel buried at the side of each plot.
Runoff data were collected for each rainfall event. The MC Model describes a rainstorm as a group of rain segments for which the breaks in the rain are less than 24 h. Huff (1967) defines a storm as a rain period separated from a preceding and succeeding rainfall event by 6 h or more. The latter definition was used. Runoff was simply measured by recording the height of the runoff inside the barrel.
Rainfall amount and intensity was measured by an automatic tipping bucket rain gauge (Hobo Event (C) Onset Computer Corp, Model No. 7, Version No. 4) installed at the experimental site to store detailed data for every storm. Each bucket tip measures 0.2 mm in a time interval determined by the intensity of the rainfall. The rain gauge is capable of measuring 0.2 mm in 0.01 s. The rain gauge was equipped with a data-logger with memory capacity of 32 768 bytes. The data were downloaded to a laptop computer, and then prepared to 1 min intensity. The record included the starting date and time, as well as the terminating date and time of each storm. The data collected were analysed to characterise each rainstorm at the Melkassa ecotope during the measuring period.
Ecotope characterisation
Climate
The Melkassa Hypo Calcic Regosol ecotope is located about 15 km south-east of Nazret City. The main rainy season is during the months June to September, during which 68% of the annual rainfall occurs (Table 1). The measured Class A pan evaporation data (Eo) and the potential evapotranspiration (ETo), calculated using the Penman-Monteith equation, correlate well with R2 of 0.92. The highest evaporative demand occurs during the months of March, April and May. During these months, the mean maximum temperature (Txm) is around 30ºC while the mean relative humidity (RHm) drops to 51%. During the main crop growing season of June to September conditions are more favourable with Txm and RHm approximately 27ºC and 64% respectively.
According to the recent agroecological zones classification of Ethiopia (MoA, 2000), the Melkassa Hypo Calcic Regosol ecotope falls in the zone termed hot to warm semi-arid lowlands (SA1). This belt exhibits 2 growing seasons of 50 d and 100 d in length for the 1st and 2nd seasons, respectively, and has an annual rainfall (P) and potential evapotranspiration (PET) of about 772 mm and 1 994 mm, respectively. The aridity index (AI) (P/PET) of 0.39 (Table 1) identifies this as a semi-arid area.
Soil
A profile pit was dug to a depth of 3 000 mm. The soil profile was described and classified as follows: Hypo Calcic Regosol according to the World Resource Base System (FAO, 1998b); Etosha Vetkuil (2111) according to the South African System (Soil Classification Working Group, 1991); Regosol according to the FAO system (FAO, 1984). A soil map (FAO, 1998a) of the Rift Valley in this vicinity shows the dominance of the Regosols (Fig. 2). Important characteristics of the Melkassa soil are a favourable clay loam texture of the fine earth throughout the profile, with high silt content. The topsoil is strongly crusting. The water holding capacity of the potential root zone for maize is considered to be high.
Determinations of the following physical properties were made: drainage curve; soil water retention curves; bulk density; initial (Ii) and final (If) infiltration rates. Detailed results are presented in Welderufael (2006).
Calibration and validation of the MC Model
The measured rainfall and runoff data during the main season of 2004 were used to calibrate and validate the MC Model. Half of the data were used for calibration and the other half for validation. The data were used together with the determined values of Ii and If to run the model. The remaining parameters in the model, i.e. maximum surface detention (SDm), and γ were fixed using a sensitivity analysis to obtain 'best fit' values. Model calibration was carried out by changing the values of γ between 0.1 and 0.9 and SDm between 0 and 10 mm, while keeping the measured and first approximation Ii and If values fixed. Once the optimum values for γ and SDm were obtained, the sensitivity analysis was conducted manually and expertly (Madsen et al., 2002) to improve the If value until the performance evaluation functions had reached their optimum level, and the observed and simulated runoff values matched reasonably well. Once the models were calibrated and the parameters fixed, validation was carried out on the remaining data using the procedure of Willmott (1981).
Result and discussions
Rainfall-runoff relationships
Measurements
Rainfall amounts (P) and intensities (Pi) were measured during the main rainy seasons of 2003 and 2004. Runoff (R) measurements were taken only for 2004. Melkassa storms generally exhibited intense rainfall during the 1st and 2nd quartiles of the events. Huff (1967) in his study at Illinois in the USA also found a similar pattern. In the 2003 rainy season the total amount of the rainfall for events ≥ 9 mm was 297 mm. It was uniformly distributed throughout the season. There were six storms in July, seven in August and four in September, with 103 mm, 114 mm and 80 mm rainfall amounts, respectively (Table 2 A). After calibration the MC Model predicted R/P as 0.3 and 0.16 on NT and CT plots respectively. Most of R (57%) came from the 3 big storms on DoY 199, 236 and 249. For 2004, rainfall events ≥9 mm totalled 210 mm. Rainfall for the entire season amounted to 251 mm producing R/P values of 0.6 and 0.4 on the NT and CT plots respectively (Table 2 B). Unlike 2003, the rainfall distribution in 2004 was non-uniform with 2 large storms in July followed by 1 large storm in August, and 1large storm each in September and October. This pattern would have caused a shortage of water during the flowering and maturity stage of the cropping period. During 2004, where measured runoff data were available, there was a significant difference at the 0.05 probability confidence level between the runoff on the 2 cultivation practices, with an overall mean per storm of 15.5 mm and 10.5 mm on the NT and CT plots respectively. The significant difference is attributed to the larger SDm values of the CT plots, presumably due to the 2 cultivation practices carried out on them during the season, and also due to the relatively few heavy storms capable of producing a similar crusted surface to that on the NT plots. The CT plot was cultivated at the beginning of the study and after the storm on DoY 212. This left a rough surface with considerable depressions that persisted for a longer period throughout the rainy season.
The MC Model was calibrated and validated using the rainfall-runoff measurements for 2004. The validated model was then used to predict R for each storm of the 2003 season.
A similar procedure for model calibration and validation to that used at Dera was followed (Welderufael, 2006). Results are presented in Tables 3 A and B and Table 4. Appropriate values for If and γ were found to be 6 mm·h-1 and 0.6 mm-1, respectively. These are the same as those selected for Dera (Welderufael, 2006).
The calibration procedure revealed that the s values (= SDm) which gave the best results with the MC Model were 1 mm and 6 mm for the NT and CT plots, respectively. The following criteria were used for making the decision: D-index, R2, and RMSEu/RSME as close as possible to 1.0. A high value of the latter parameter is of particular importance since it indicates that the error is mainly not of a systematic nature.
These values, and their assessment parameters, are printed in bold (Table 3). Results of the validation test using these values, and the Ii, If and γ values (Table 3) are presented in Table 4. Significant aspects for both NT and CT are the relatively low RMSE values, very high D-index and R2 values, and very high RMSEu/RMSE values. These are also compatible to the good overall correlation finally obtained between measured and predicted runoff values during 2004 for both the NT and CT treatments; R2 values were 0.86 and 0.94, respectively.
Once the model had been calibrated and validated, it was used to simulate the runoff of each storm during both years (Table 2). The good agreement between the measured and predicted values is reflected by the R2 values of 0.86 and 0.94 for the NT and CT plots, respectively, for all the storms during the 2 seasons (P≥9 mm).
Well-simulated storms
Included are storms that start with intense rainfall (Pi > If), and those storms that acquire high intensities (Pi > If) later than in the 1st quartile, and continued with Pi > If for sufficient time to fulfil the sorptivity and SDm demand of the soil. A study of the rainfall vs. time graphs for a number of storms of this type indicates that about 4 mm of rain is needed to satisfy the requirements of sorptivity and SDm (1 mm) on the NT plots. Therefore, subtracting 4 mm from the cumulative rainfall value at the point where Pi becomes less than If, or at the point where the steepest part of the cumulative rainfall line terminates, will directly give an estimated amount of runoff on the NT plots.
Figures 3 and 4 show storms that begin with high intensity, during 2003 and 2004 respectively. For the storm on DoY 199 of year 2003, the point where Pi < If is indicated by an arrowed line. The Pi > If part of the storm lasted for about 48 min. The arrow gives a value of 18 mm on the y-axis of the cumulative rainfall. Therefore, subtracting 4 mm (the value of sorptivity + SDm) from 18 mm will give 14 mm. This is a similar result to the amount of runoff simulated by the Morin and Cluff (1980) runoff model for NT plot which equals 13.9 mm (Table 2). Similarly, for CT plots if we subtract 3 mm plus the value of SDm for CT plots (3 + 6 = 9), we will obtain 9 mm of runoff. Again the result is very close to the one estimated by the model as 10.2 mm (Table 2). Since no measurements of runoff were recorded during 2003, this analysis enables us to further validate the MC Model.
The storm on DoY 252 of 2004 (Fig. 4) had Pi > If throughout its 22 min duration giving 22 mm of cumulative rainfall. Subtracting 4 mm from 22 mm gives an expected runoff of 18 mm on NT plots. The measured runoff was 16.4 mm, while the model simulated 18.2 mm. Using the same calculation as for storm on DoY 199 the expected runoff on CT plots is 13 mm. The measured and simulated values were 11.4 mm and 13.8 mm respectively. Storms with Pi < If were also well simulated, in all cases giving zero runoff.
The 2nd group of storms that were well simulated were characterised by Pi > If for a certain period during the middle of the storm's duration (2nd, 3rd or 4th quartiles). It can be assumed that the sorptivity and SDm demand for these storms was satisfied by the rain that fell before the intense part started, or else by bursts of intense rains (Pi > If) that occurred before or after the major intense period (m.i.p.). Huff (1967) defined 'burst' as a cessation in rainfall or an abrupt, persistent change in rainfall rate. But here 'burst of intense rain' was taken as part of the storm that showed Pi > If for a short time interval compared to the m.i.p. of Pi > If. At Melkassa this kind of storm was rare. Figure 5 shows one of these storms (DoY 277) during 2004. In this storm the starting point and end-point of the m.i.p. are indicated by the arrowed lines giving 14 mm and 6 mm of rainfall on the cumulative rainfall y–axis. Thus, by subtraction, 14 mm minus 6 mm, gives 8 mm of expected runoff, the same as the measured value. The model simulated 8.2 mm. Similarly, for storm on DoY 249 of 2003 (Fig. 6) the arrowed lines indicate 26 mm and 7 mm of the cumulative rainfall as boundary values of the m.i.p. This gives 19 mm of expected runoff on NT plots, while the model simulated 18.2 mm.


It is clear that a long dry period between storms will increase the sorptivity of the soil. In addition, high SDm values were encountered when storms occurred immediately after cultivation on CT plots.. Both these factors will influence the accuracy of simulations. Unlike the Dera Calcic Fluvic Regosol ecotope (Welderufael, 2006), the CT plots on the Melkassa Hypo Calcic Regosol ecotope retained an almost similar SDm value (6 mm) throughout the 2004 rainy season. This may be due to the smaller number of intense rain events after the 2nd cultivation practice carried out on DoY 215.
Examples of storms not well simulated
Storm on DoY 223 of 2004 gave an exceptionally high measured runoff value on the NT plot of 25.9 mm whereas the simulated value was only 12.2 mm (Fig. 7). The high measured R was probably due to the fact that it occurred 48 h after 2 continuous storms on DoY 220 and 221. Although these storms produced little R (1.8 mm and 2.3 mm from NT) they probably contributed enough water to leave the soil surface wet after 48 h. As a result the demand for sorptivity was minimised (an indication of how the model could be improved). The other relevant factor was the occurrence of continuous small bursts of Pi > If that lasted for about 133 min, between 49 min and 182 min (Fig. 7). They covered approximately 3 quarters of the storm's duration. These bursts may not have been considered by the model as significant enough time segments to produce runoff. Similarly, storms on DoY 232 and 251 of 2004 and 2003, respectively, were under-simulated by the model.
Estimating yield increases using IRWH
Empirical procedures were followed to estimate the benefit of IRWH to maize production on the Melkassa Hypo Calcic Regosol ecotope. Maize yields and climate data from the Melkassa Agricultural Research Center (MARC) for 16 growing seasons (1988 to 2003) were used. The average maize yield for this period using conventional tillage was found to be 2115 kg·ha-1 (Table 5). The climate data included rainfall (P), temperature (T), relative humidity (RH), sunshine hours (SH) and wind speed (WS).
The CROPWAT programme developed by FAO was used for making Es + T estimates. (Es + T) is termed ET in the programme. The detailed description of this programme and the calculations used are given in Welderufael, 2006. The programme first makes use of the climatic data needed (i.e. P, T, RH, SH, and WS) to calculate ETo for each day of each growing season using the Penman-Monteith equation. In the 2nd step the programme combines a crop coefficient (Kc) with ETo to estimate the potential ET of maize (Kc*ETo) for each growth stage, i.e. the amount of water it would require for ET to attain maximum yield. For each of the 16 growing seasons the ratio of the final grain yield to the sum of the ET values for the season yielded the water productivity (WPET) for that particular season (Table 5). The mean WPET value over all the seasons was found to be 6.5kg·ha-1·mm-1 (Table 5).
To proceed further it is necessary to have an estimate of the fraction of the extra water produced by runoff on the NT plots that will become used for increasing yield, i.e. in this case used specifically for ET. The results obtained by Hensley et al. (2000) and Botha (2007) for field experiments comparing the IRWH and CT production techniques with maize on the Glen/Bonheim ecotope, over 7 growing seasons, was employed as follows to estimate this fraction. The following information was extracted for each growing season:
- Infield runoff (Rinf) from the IRWH treatment with a bare runoff area
- The difference in water used for ET on IRWH compared to CT (ETIRWH – ETCT = ΔET)
- The ratio of ΔET/ Rinf
The average value of ΔET/ Rinf over the 7 seasons was 0.62. This indicates that on average, on the Glen Bonheim ecotope with maize, ETIRWH can be expected to be increased to the extent of 0.62 x Rif above the ET of maize with conventional tillage, i.e. ΔET ≈ 0.62 * Rif. A comparison of the runoff characteristics of the Melkassa ecotope and the Glen/Bonheim ecotope shows that they have similar characteristics. Their If values are also the same (6 mm·h-1). It is therefore a reasonable 1st approximation to employ the calculated ET:Rif relationship for the Glen/Bonheim ecotope on the Melkassa Hypo Calcic Regosol ecotope.
The following is the description of the procedure used to estimate the expected maize yield increment with IRWH. Results are presented in Table 5. The rainfall-runoff measurements made on the Melkassa Hypo Calcic Regosol ecotope during 2003 and 2004 are described in Welderufael (2006). From the measurements an empirical/regression equation relating NT plot runoff to rainfall events > 9 mm was developed. The equation is:
R = 0.714P – 6.8959 (R2 = 0.87)
where:
R is the estimated runoff in mm
P is the amount of rain (> 9 mm) of the rainfall event (Welderufael, 2006)
Applying this equation to each rainfall event during each growing season from 1988 to 2003 (Table 5) provides an estimate of what the runoff (Rif) would have been from the runoff strip (Fig. 1) had IRWH been employed. Multiplication of this value by 0.62 gives an estimate of the expected ET increment (ETinc). The multiplication of ETinc*WPET provides a logical estimate of the increased yield with IRWH.
Results are presented in Table 5. Values vary between 13% and 49%. The mean increase is shown to be 33%, which represents an estimated average annual yield increase of 711kg·ha-1.
Conclusions
The 3 objectives of the study were achieved. Firstly, the Morin and Cluff runoff model was successfully calibrated and validated. Appropriate values for the 3 parameters needed by the model for use on the Melkassa Hypo Calcic Regosol were determined, i.e. If = 6 mm·h-1; s for NT and CT were 1 mm and 6 mm respectively; and γ = 0.6 mm-1. Secondly, rainfall-runoff relationships on the Melkassa ecotope during 2004 were quantified giving values of 0.59 and 0.40 for the NT and CT treatments, respectively. The significant difference between the runoff on the 2 treatments during 2004 was caused mainly by the 2 cultivation operations on the CT plots that caused large SDm and had a major influence on runoff. Thirdly, maize yield benefits using the IRWH technique instead of conventional tillage on this ecotope were estimated to be between 35 and 1 437 kg·ha-1.
The study shows how crop yields in semi-arid regions of Sub-Saharan Africa could be increased significantly by employing in-field rainwater harvesting rather than conventional tillage. Since it is expected that the technique will only be successful on ecotopes with specific properties, prior detailed characterisation of these relevant properties is recommended.
References
BENNIE ATP and HENSLEY M (2001) Maximizing precipitation utilization in dry land agriculture in South Africa. J. Hydrol. 241 125-139. [ Links ]
BENNIE ATP, Hoffman JE, COETZEE MJ and VREY HS (1994) Storage and Use of Rain Water in Soil for the Stabilization of Plant Production in Semi-Arid Areas [Afr]. WRC Report No. 227/1/94. Water Research Commission, Pretoria, South Africa. [ Links ]
BERRY WAJ and MALLETT JB (1988) The effect of tillage: Maize residue interactions upon soil water storage. S. Afr. J. Plant Soil5 57-64. [ Links ]
BOTHA JJ (2007) Evaluating Maize and Sunflower Production in a Semi-Arid Area Using Infield Rainwater Harvesting. Ph. D. Thesis. University of the Free State, Bloemfontein, South Africa. [ Links ]
BOTHA JJ, VAN RENSBURG LD, ANDERSON JJ, HENSLEY M, MACHELI MS, VAN STADEN PP, KUNDHLANDE G, GROENEWALD DG and BAIPHETHI MN (2003) Water Conservation Techniques on Small Plots in Semi-Arid Areas to Enhance Rainfall Use Efficiency, Food Security, and Sustainable Crop Production. WRC Report No. 1176/1/03. Water Research Commission, Pretoria, South Africa. [ Links ]
DU PLESSIS MC and MOSTERT JWC (1965) Runoff and soil losses at the Agricultural Research Centre, Glen. S. Afr. J. Agric. Sci. 8 1051-1061. [ Links ]
FAO (1984) Provisional Soil Association Map of Ethiopia (1:2 000 000) based on the work of H.Y. Wijntje-Bruggeman AG:DP/ETH/82/010, Field Document 6, Addis Ababa, Ethiopia. [ Links ]
FAO (1998a) Soils of East Africa. www.67.95.153.93/RiftValley_soils.php (Accessed on 5 May 2005). [ Links ]
FAO (1998b) World Reference Base for Soil Resources. World Soil Resource Reports 84. FAO, Rome. [ Links ]
GIBBS MD, RUSSEL WB and KLOPPERS PP (1993) Erosion studies using natural runoff plots. Annual Report on Research Facet No. N5711/38/1/1 to the Department of Agriculture, Pretoria, Republic of South Africa. [ Links ]
GICHERU PT, GACHENE CKK and BIAMAH EK (1998) Effects of tillage and mulching on soil moisture conservation and crop production. Appl. Plant Sci. 12 5-9. [ Links ]
GRAEF F and STAHR K (2000) Incidence of soil surface crust types in semi-arid Niger. Soil Tillage Res. 55 213-218. [ Links ]
HAYLETT DG (1960) Runoff and soil erosion studies at Pretoria. S. Afr. J. Agric. Sci. 3 379-394. [ Links ]
HENSLEY M, BOTHA JJ, ANDERSON JJ, VAN STADEN PP and DU TOIT A (2000) Optimizing Rainfall Use Efficiency for Developing Farmers with Limited Access to Irrigation Water. WRC Report No. 878/1/00. Water Research Commission, Pretoria, South Africa. [ Links ]
HUFF FA (1967) Time distribution of rainfall in heavy storms. Water Resour. Res. 3 1007-1019. [ Links ]
ITANNA F (2005) Sulphur distribution in five Ethiopian Rift Valley soils under humid and semi-arid climate. J. Arid Environ. 62 597-612. [ Links ]
KRONEN M (1994) Water harvesting and conservation techniques for smallholder crop production system. Soil Tillage Res. 32 71-86. [ Links ]
MADSEN H, WILSON G and AMMENTORP HC (2002) Comparison of different automated strategies for calibration of rainfall-runoff models. J. Hydrol. 261 Issue (1-4) 48-59. [ Links ]
MINISTRY OF AGRICULTURE (MoA) (2000) Agro-Ecological Zones of Ethiopia, Natural Resource Management and Regulatory Department, Addis Ababa, Ethiopia. [ Links ]
MORIN J and BENYAMINI Y (1977) Rainfall infiltration into bare soils. Water Resour. Res. 3 813-817. [ Links ]
MORIN J and CLUFF CB (1980) Runoff calculation on semi-arid watersheds using a Rotadisk Rainulater. Water Resour. Res. 16 1085-1093. [ Links ]
MORIN J, RAWITZ E, HOOGMOED WB and BENYAMINI Y (1983) Tillage practice for soil and water conservation in the Semi-Arid Zone III: Runoff modelling as a tool for conservation tillage design. Soil Tillage Res. 4 215-224. [ Links ]
MWAKALILA SS and HATIBU N (1993) Rain water harvesting for crop production in Tanzania. Proc. 3rd Annual Scientific Conference of the SADC – L & WMRP. October 1992, Harare, Zimbabwe. 513-525. [ Links ]
OJASVI PR, GOYAL RK and GUPTA JP (1999) The micro-catchment water harvesting technique for the plantation of jujube (Zizyphus mauritiana) in an agroforestry system under arid conditions. Agric. Water Manage. 41 95-105. [ Links ]
OWEIS T, HACHUM A and KIJNE J (1999) Water harvesting and supplementary irrigation for improved water use efficiency in dry areas. IWMI Contribution (No. 7) to System-Wide Initiative on Water Management (SWIM), Colombo, Sri Lanka. [ Links ]
SOIL CLASSIFICATION WORKING GROUP (1991) Soil Classification – a Taxonomy System for South Africa. Mem. Agric. Nat. Resource No. 15. Department of Agricultural Development, Pretoria, South Africa. [ Links ]
WELDERUFAEL WA (2006) Quantifying Rainfall-Runoff Relationships on Selected Benchmark Ecotopes in Ethiopia: A Primary Step in Water Harvesting Research. Ph.D. Thesis, University of the Free State, Bloemfontein, South Africa. [ Links ]
WILLMOTT CJ (1981) On the validation of models. Phys. Geogr.2 184-194. [ Links ]
ZERE TB, VAN HUYSSTEEN CW and HENSLEY M (2005) Estimation of runoff at Glen in the Free State Province of South Africa. Water SA 31 (1) 17-21. [ Links ]
Received 11 February 2008; accepted in revised form 11 September 2009.
* To whom all correspondence should be addressed.
+2751 401 2386; fax: +2751 401 2212;
e-mail: leRouxPA.SCI@ufs.ac.za
Evaluation of potential changes in hydrologically relevant statistics of rainfall in Southern Africa under conditions of climate change#
TG LumsdenI, *, RE SchulzeI; BC HewitsonII
ISchool of Bioresources Engineering and Environmental Hydrology, University of KwaZulu-Natal, Private Bag X01, Scottsville, 3209, South Africa
IIClimate Systems Analysis Group, Department of Environmental and Geographical Science, University of Cape Town, Private Bag X3, Rondebosch, 7701, South Africa
ABSTRACT
Scenarios of present, intermediate and future climates for Southern Africa were analysed to evaluate potential changes in hydrologically relevant statistics of rainfall that could be observed this century as a result of climate change. These climate scenarios were developed in previous studies by applying empirical downscaling techniques to relatively coarse-scale climate scenarios simulated by general circulation models (GCMs) as part of the Intergovernmental Panel on Climate Change 3rd and 4th Assessment Reports (TAR and AR4, respectively). The regional climate scenarios were available at a daily time-step and for a spatial grid resolution of 0.25º over Southern Africa, comprising South Africa, Lesotho and Swaziland. In the study, the regional climate scenarios were related to the 1946 quaternary catchments in the region since the possible hydrological impacts of climate change will ultimately be assessed explicitly by applying the regional climate scenarios in a daily time-step hydrological model. The analysis of potential changes in hydrologically relevant rainfall statistics was qualitative in nature and focused on determining where convergence exists amongst the different climate models with respect to changes in rainfall, and what the likely hydrological implications would be for the region. According to all of the GCMs evaluated in the study, more rainfall is projected for the east of the region. The greater rainfall projected for the east would be in the form of more rain days and more days with bigger rainfalls. If these scenarios are correct, the combination of wetter antecedent conditions and larger rainfall events would result in more runoff being generated and this would have implications for, inter alia, filling of dams and water quality. According to all of the GCMs evaluated, less rainfall is projected along the west coast and the adjacent interior, with the possibility of a slight increase in inter-annual variability. If correct, this would result in a decrease in flows and an increase in flow variability, since changes in precipitation are amplified in the hydrological cycle. As convergence in climate-change scenarios becomes apparent, there is now an arguable basis for developing appropriate response strategies for incorporation into adaptation policy. Perhaps one of the greatest challenges in this regard is now to explore the issues of uncertainty and probability in order to develop a more rigorous basis to enable proactive responses.
Keywords: climate change, rainfall, rainfall statistics, hydrology, Southern Africa, South Africa
Introduction
A focus on potential impacts of climate change on the water sector of Southern Africa (i.e. the Republic of South Africa together with Lesotho and Swaziland) was triggered by a series of activities and events in the first few years of the new millennium which included the South African Country Study on Climate Change, the World Summit on Sustainable Development, the Intergovernmental Panel on Climate Change (IPCC) reports in 2001, the 3rd and 4th World Water Forums, as well as active South African participation in the International Geosphere-Biosphere Programme and the International Dialogue on Water and Climate, among others. Additionally, there was the realisation that perturbations in climate parameters, particularly of rainfall, were amplified by the hydrological system and that if climate changes were to manifest themselves in the manner which international science was projecting, it would add a further layer of concern to the management of Southern Africa's already high-risk and stressed water sector, with potential implications to the entire region's socio-economic well-being, but particularly that of the poor.
Long-term changes in observed rainfall in South Africa have been noted in a number of studies. Some of these studies were focused on localised areas while others were focused at a national level. Lynch et al. (2001) noted a gradual increase in annual rainfall in the Potchefstroom area from 1925 to 1998, while Van Wageningen and Du Plessis (2007) noted a reduction in annual rainfall (with an accompanying increase in rainfall intensity) over the latter half of the 20th century at Table Mountain, Cape Town. Mackellar et al. (2007) reported both wetting (central coastal belt, north-eastern areas) and drying (escarpment) over the Namaqualand region during the latter half of the 20th century. At a national level, Richard et al. (2001) and Fauchereau et al. (2003) noted no overall wetting or drying, but did report an increase in inter-annual rainfall variability during the 20th century. Warburton and Schulze (2005) reported that over the latter half of the 20th century, median annual rainfall has decreased markedly over the Limpopo, North-West and into the Northern Cape Provinces along the border of South Africa with Botswana, with decreases evident in the south-eastern Free State as well, but with increases in the winter rainfall region.
The impact of climate change on future rainfall and water resources in South Africa has been studied utilising climate scenarios derived from GCMs. The South African Country Study on Climate Change (SACSCC) was the first study which involved South African scientists from a wide range of disciplines in assessing the issue of climate change at the national and key sectoral levels. The study formed one of the elements of South Africa's First National Communication to the United Nations Framework Convention on Climate Change, and the National Climate Change Response Strategy. The vulnerability and adaptation component of the study (Kiker, 2000) utilised 3 GCMs. The HadCM2 GCM projected that summer rainfall will decrease over most of the country (changes ranged between a 15% decrease to a 5% increase) while the Genesis Model projected an increase for most of the country (Perks et al., 2000). CSM projections were similar to HadCM with changes ranging between a 10% increase and 10% decrease. Winter rainfall was projected by CSM to decrease by more than 25% in the northern part of the country, and increase slightly in the south-western part, while HadCM2 projected a similar pattern, but a 25% decrease in the south-western areas. Genesis simulated an increase in winter rainfall over most of the country (Perks et al. 2000). Although a significant study at the time, the results produced during the SACSCC are now somewhat dated.
More recently the South African Water Research Commission (WRC) has funded 2 successive multi-institutional projects to investigate the potential impacts of climate change on South Africa's water sector. The development of climate scenarios for future and present conditions, at a relatively high spatial and temporal resolution, has been a focus in these projects. In the first of the projects, regional climate scenarios for a present (1975 to 2005) and future (2070 to 2100) climate were produced at a 0.5 degree spatial resolution for Southern Africa using the Conformal-Cubic Atmospheric Model (C-CAM) (Engelbrecht, 2005). Lower boundary forcing was obtained from the CSIRO Mk3 Ocean-Atmosphere GCM, which was integrated for the period 1961 to 2100 with increasing greenhouse gas concentrations. Potential changes in the regional climate, from present to future conditions, were evaluated in terms of changes in 'hydrologically relevant' rainfall statistics (Schulze et al., 2005). The potential impact of climate change on hydrological responses was then subsequently explicitly assessed by applying the daily time-step regional climate scenarios in a daily hydrological model (Schulze et al., 2005). The results of the analysis of changes in rainfall over the region showed that a strong reduction (of up to 70%) in rainfall was likely over the west coast and adjacent interior. Over south-eastern parts of the region a slight increase in rainfall was projected (less than 10%), while the rest of the region was projected to experience either no change, or a slight reduction in rainfall (less than 10%). At the time of performing the analyses reported in Schulze et al. (2005), regional climate scenarios from only one climate model were available. This was a limitation of the study since it is considered important in climate-change impact studies to consider climate projections derived from a number of climate models in order to better characterise the envelope of possibilities.
At a later stage in the course of the above WRC-funded project, however, and in the one succeeding it, regional climate scenarios derived from a number of GCMs were subsequently produced (Hewitson et al., 2005a). These regional climate scenarios were developed by empirically downscaling GCM simulation output, and were produced at a quarter degree spatial resolution for Southern Africa. At the time of conducting the research reported in this paper, regional climate scenarios derived from 6 GCMs had been produced at a daily time-step for climate-change impact assessments in Southern Africa. These scenarios have been evaluated in terms of future vs. present changes in hydrologically relevant rainfall statistics, and will later be applied with a daily hydrological model to explicitly assess the potential impact of climate change on hydrological responses.
In this paper, the evaluation of the future vs. present changes in hydrologically relevant rainfall statistics, as derived from the 6 abovementioned GCM scenarios, is presented. Apart from determining where convergence exists amongst the different GCMs, the qualitative analysis of changes also focuses on exploring the likely implications for the Southern African water sector.
Methodology
Regional climate scenarios
The GCMs used to develop the global climate scenarios which were downscaled to a quarter degree resolution spatial grid for Southern Africa for application in this research, included 3 from the IPCC 3rd Assessment Report (IPCC, 2001), and 3 from the World Climate Research Programme's Coupled Model Intercomparison Project Phase 3 (CMIP3) multi-model dataset used in the IPCC 4th Assessment Report (IPCC, 2007) – the CMIP 3 Archive. The GCMs are as follows:
- CSIRO
- ECHAM
- HadAM
- GFDL
- MIROC
- MRI-CGCM
The first 3 GCMs in the above list were employed in the IPCC 3rd Assessment Report (TAR), while the remaining 3 were employed in the 4th Assessment Report (AR4). The future global climate scenarios were simulated based on the A2 emissions scenario defined by the IPCC Special Report on Emission Scenarios (SRES) (Nakićenović and Swart, 2000). This scenario of greenhouse gas emissions assumes that efforts to reduce global emissions this century are relatively ineffective. Regardless of the emission scenario selected, a further increase of at least 0.6ºC in global mean temperature is likely, owing to past greenhouse gas emissions (Hewitson et al., 2005b).
Two methods are commonly employed in downscaling global climate-change scenarios to produce regional scenarios; downscaling with regional climate models (RCMs) embedded within the low resolution GCM fields, and empirical downscaling forced by the GCM fields (Hewitson et al., 2005b). The IPCC TAR reviews these approaches and their relevant strengths and weaknesses concluding that, while they have different attributes, they are nonetheless of comparable skill. In the long term, it is likely that both methods will remain of value in different contexts. However, at present it is arguable that the empirical downscaling approach is the more mature of the 2 in developing climate-change projections for immediate use by the impacts community, if for no other reason than that practical exploration of the projected climate change envelope is possible owing to the substantially lower computational requirement. Empirical downscaling was therefore employed in the production of the regional climate scenarios evaluated in this study. Empirical downscaling techniques involve deriving relationships between synoptic scale and local climates using observational data, and then applying these relationships to GCM output to generate higher resolution regional climate scenarios (Hewitson et al., 2005b).
Regional scenarios were developed for present, intermediate future and more distant future climates represented by the following time periods (Hewitson et al., 2005a):
- Present climate: ± 1960 to 1990 for both AR4 and TAR models
- Intermediate future climate: ± 2046 to 2065 for AR4 models only
- Distant future climate: ± 2081 to 2100 for AR4 models;± 2070 to 2100 for TAR models
All the above regional scenarios included a daily time series of rainfall for each climatic period and the ± denotes that the respective scenarios derived from the different GCMs were not for identical time periods.
In this paper, more emphasis was placed on assessing the possible changes in rainfall under the intermediate future climate, rather than the distant future climate. The reason for this is that the distant future climate is more dependent on the emission scenario adopted than the intermediate one, and is thus subject to greater uncertainty. It is also easier for most individuals to relate to a time period that commences ± 40 years from now, rather than a period that commences ± 70 years from now.
Linking regional climate scenarios to quaternary catchments
Since the possible hydrological impacts of climate change will ultimately be assessed explicitly by applying the regional climate scenarios in a daily time-step hydrological model, the assessment of possible changes in hydrologically relevant rainfall statistics presented in this paper was performed at a scale suitable for hydrological modelling in the region, this being the quaternary catchment (QC) scale. In this way the results of the analyses presented in this paper can inform a future, more detailed approach where a hydrological model is applied in assessments. In order to represent the regional climate scenarios at QC scale, pixels were selected from the 0.25º regional scenario grids to represent each of the 1946 QCs in Southern Africa. In doing this, the 1st step was to compare the relative scale of the regional climate grids to the QCs. In Fig. 1, a grid having the same resolution as the regional climate scenarios has been overlaid by a map of the QCs. A close-up view of the area highlighted by the blue rectangle in Fig. 1 is given in Fig. 2. Figure 1 shows that the larger QCs in the region (mostly in the more arid Northern Cape Province of South Africa) are generally greater in area than the climate scenario pixels, while in other areas, such as that shown in Fig. 2, the QCs and pixels have areas that are of a similar size. It was undesirable to simply average the data contained in the pixels falling within a catchment, since this would exacerbate the differences in temporal rainfall variability between climate model (areal) and station (point) rainfall data (Chen et al., 1996; Osborn and Hulme, 1997). Instead, the approach adopted was to assign a single representative pixel to each QC. In this regard, it was assumed that the pixel containing the centroid of a QC would be selected to represent that catchment. The time series of daily climate for the various periods considered in the study were then extracted for the selected pixels from the set of available regional climate scenarios. Hydrologically relevant rainfall statistics were then calculated based on these time series as described in the following section. As explained previously, these time series could be directly input to a hydrological model in a future study to explicitly assess the hydrological impacts of climate change for the quaternary catchments.
Hydrologically relevant rainfall statistics
The hydrologically relevant statistics of rainfall assessed in this study focused on characterising the annual means and variances of the rainfall scenarios, as well as the distribution of daily rainfall amounts. The distribution of daily rainfall amounts was represented by determining the total number of days in the relevant daily time series on which rainfall either equalled or exceeded certain defined threshold amounts. This would give an indication of whether individual rainfall events are likely to be larger or smaller in future, than at present. It is important to consider individual rainfall events, as these trigger key hydrological responses such as stormflow and sediment generation. The statistics that were selected included:
- Mean annual precipitation (MAP)
- Coefficient of variation (CV) of annual precipitation
- Total number of days in the time series with no rainfall
- Total number of days in the time series with more than 5 mm of rainfall
- Total number of days in the time series with more than 10 mm of rainfall
- Total number of days in the time series with more than 20 mm of rainfall.
Considering days with no rainfall vs. days with rainfall has significance in terms of general antecedent wetness. The threshold of 10 mm on a given day was considered in the distribution analysis since this is often viewed as a threshold for stormflow to occur, or for farmers not being able to implement mechanical field operations. The threshold of 5 mm was selected as an intermediate threshold between zero and 10 mm. The threshold of 20 mm was selected to represent heavier rainfall events associated with higher stormflows.
In order to make a fair comparison, the number of years of data considered in statistical calculations was kept the same when comparing the intermediate future and distant future climates to the present climate. Thus, for the regional scenarios derived from the AR4 GCMs, only 20 of the 30 years of available data in the present climate scenario were used in calculating statistics so as to be comparable with the 20 years of data available for the intermediate and distant future climates. The last 20 years of data from the 30-year present climate series were considered since the selection of this period resulted in a more equal spacing of the different climates over time.
Results
The potential changes in hydrologically relevant rainfall statistics are presented as maps of the ratio of the intermediate future (or distant future, as the case may be) climate statistic to that of the present climate statistic. Thus, a ratio value of greater than 1 indicates an increase in that statistic over time (mapped in shades of green and blue), while a value of less than 1 indicates a decrease (mapped in shades of red and brown). A ratio in the range 0.95 to 1.05 was considered to be a negligible change and was indicated in the maps as un-shaded areas of 'No Change'. The ratios presented in the maps represent a more qualitative assessment of changes in rainfall (in direction and magnitude) rather than a quantitative, statistical assessment. A quantitative, statistical assessment was deemed to be less appropriate since the analyses focused mostly on the intermediate future climate for which climate scenarios were only available for 3 GCMs,
Potential changes in hydrologically relevant rainfall statistics under an intermediate future climate
The potential changes in hydrologically relevant rainfall statistics under an intermediate (mid-21st century) climate are presented in Fig. 3 for a) mean annual precipitation, b) CV of annual precipitation, c) total number of days with no rainfall, d) total number of days with rainfall exceeding 5 mm/d, e) total number of days with rainfall exceeding 10 mm/d, and f) total number of days with rainfall exceeding 20 mm/d. The changes in Fig. 3 are all based on the regional climate scenarios derived from AR4 GCMs, since there were no regional climate scenarios derived from TAR GCMs for the intermediate future climate.
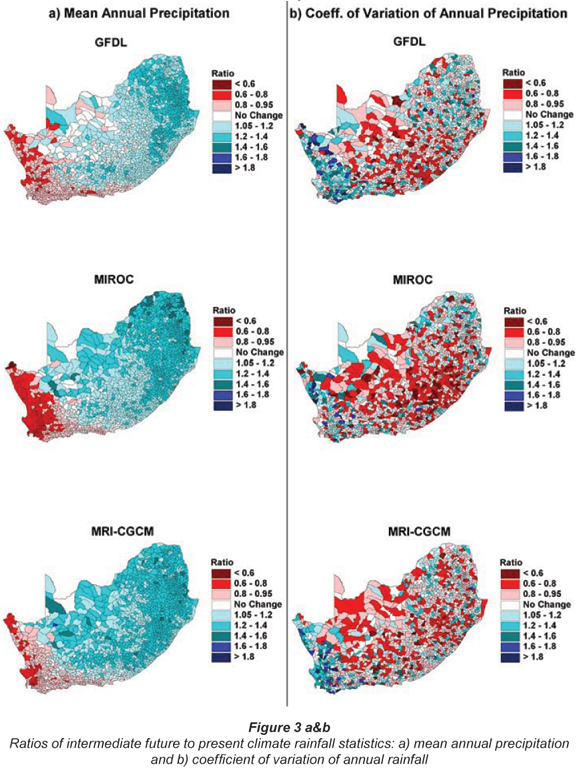
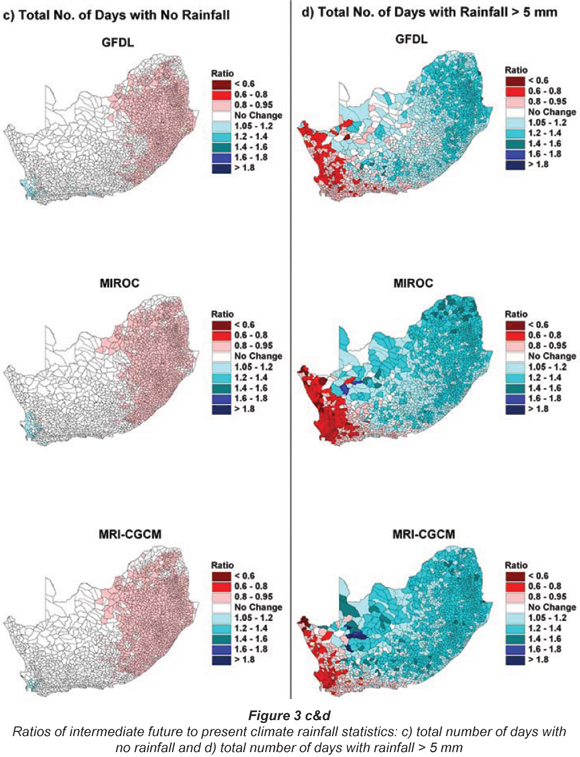
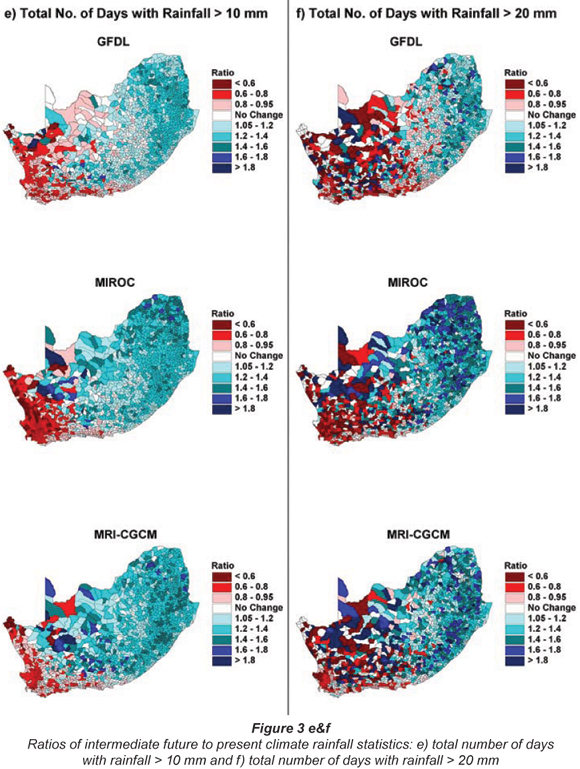
In Fig. 3a, the regional climate scenarios derived from the AR4 GCMs considered project a reduction in MAP on the west coast and adjacent interior of the region. This is bordered by a transition zone in the western interior where there are catchments experiencing little or no change in MAP. For the remainder of the region, a pattern of increasing MAP is evident. The MIROC scenario presents the driest scenario for the west (60 to 80% of present MAP), while the MRI-CGCM presents the wettest pattern in the east (20 to 40% higher MAP). The GFDL scenario appears to be a 'middle-of-the-road' scenario.
In Fig. 3b, there are no obvious patterns in the changes in inter-annual variability of rainfall in the various regional scenarios, although there is a slight tendency towards higher variability where MAP was projected to decrease, i.e. along the west coast and adjacent interior.
In terms of changes in the distribution of daily rainfall amounts, all scenarios project an increase in the number of rainless days in a small area in the South Western Cape, and a decrease in the number of days in the eastern half of the region (Fig. 3c). For the remainder of the region there is no change evident in the number of rainless days. In the map of the number of days with more than 5 mm of rainfall (Fig. 3d), all scenarios project a decrease in the number of days in the west, while there is an increase in the central and eastern parts, and a transition zone in the western interior. This map displays similar patterns and magnitudes of change to the map for MAP (Fig. 3a).
In the maps of the number of days with more than 10 and 20 mm of rainfall (Figs. 3e and 3f, respectively), the scenarios project the same pattern for the east of the region as the 5 mm threshold map (Fig. 3d), with the increases becoming progressively more marked for the bigger events. The decreases in the number of days in the west of the region become less evident, with the transition zone (very mixed signal) in the western interior now effectively extending through to the west coast.
Potential changes in hydrologically relevant rainfall statistics under a distant future climate
Since more emphasis was placed in this study on comparing the intermediate future climate to the present climate, only potential changes in mean annual precipitation under the distant future climate are presented here in order to give a general indication of changes in rainfall over the remainder of the century. These changes are presented in Fig. 4 for the regional climate scenarios derived from both AR4 and TAR GCMs.
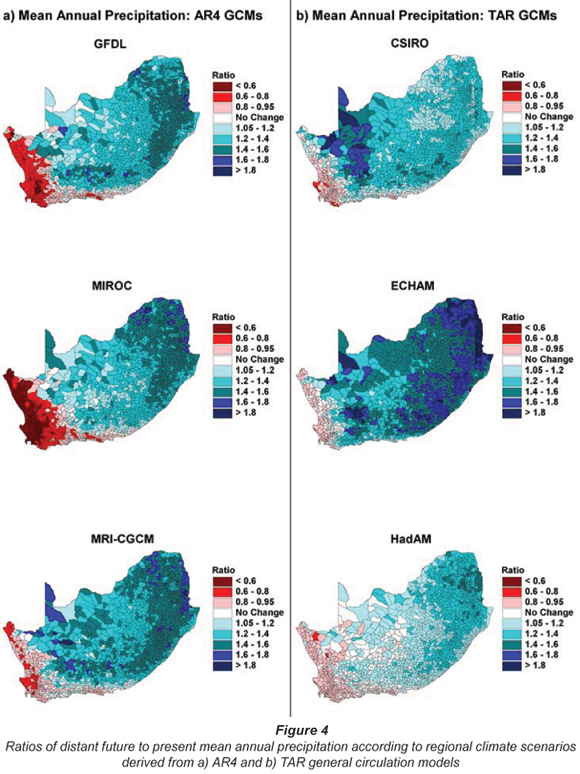
For the regional climate scenarios derived from the AR4 GCMs considered, the patterns in MAP evident under the intermediate future climate become more pronounced for the distant future climate. For the regional climate scenarios derived from the TAR GCMs considered, there is less consistency in the patterns in MAP under the distant future climate than there is in those scenarios derived from the AR4 GCMs considered. The change in MAP according to the ECHAM derived scenarios shows wetting over almost the whole region, except along the west coast. Some of the wetting is extremely marked, with certain areas projected to receive 80% more rainfall. The HadAM-derived scenario shows the largest transition zone between eastern and western areas of the region, with the zone extending more eastward than any other model and having more catchments with no change. The CSIRO derived scenario shows a strong wetting pattern in the western interior, whereas other models show a mixed signal transition zone. The scenarios derived from the TAR GCMs considered all show drying in the west of the region, but this is generally less in terms of area and severity than the more recent scenarios derived from the AR4 GCMs considered.
Discussion
The analysis of rainfall changes in Figs. 3 and 4 has shown that there is more consistency in the patterns for scenarios derived from the AR4 GCMs considered, as opposed to the older (~ 2000) TAR GCMs considered. The main differences between the scenarios derived from TAR GCMs (in terms of patterns in MAP for the distant future climate) include the following:
- The strong wetting in the western interior according to the CSIRO-derived scenarios
- The relatively large area in the western and central interior showing no change according to the HadAM-derived scenarios
- The very marked increase in MAP (of more than 80%) projected for the extreme eastern parts of the region and parts of the Limpopo Province of South Africa by the ECHAM-derived scenarios.
Although there is greater consistency in the patterns projected by the AR4 GCMs considered, this cannot necessarily be attributed to the data having originated from the later IPCC study (AR4), since the same GCMs were not considered in both the TAR and AR4 studies. If downscaled data were available for the same GCMs for both the TAR and AR4 studies (or at least for a larger, more representative sample of GCMs for both IPCC assessments), and greater consistency were observed in the AR4 GCMs, then this consistency could be ascribed to the later AR4 study.
According to all of the scenarios evaluated in the study, more rainfall is projected for the east of the region. This rainfall comes in the form of more rain days and more days with bigger rainfalls. If these scenarios are correct, the combination of wetter antecedent conditions and larger rainfall events would result in more runoff being generated and this would have implications for, inter alia, filling of dams. There would also be implications for water quality, and in particular, sediment related water quality which affects, inter alia, water treatment, dam siltation and aquatic ecosystems. The above patterns are projected to extend to the end of the century. It is unclear at this stage whether the projected change will be more rapid in the former or latter half of the century.
According to all of the scenarios evaluated, less rainfall is projected along the west coast and the adjacent interior, with the possibility of a slight increase in inter-annual variability. If correct, these patterns would result in a decrease in flows and an increase in flow variability, since changes in precipitation are amplified in the hydrological cycle. It is likely that the mixed signal in the temporal distribution of rainfall would also be reflected in the incidence of stormflow events in this area.
It is significant that the regional climate scenarios evaluated in this paper project much larger increases in rainfall in the east of the region than the scenarios of Engelbrecht (2005), as evaluated by Schulze et al. (2005). The scenarios evaluated in this paper, which were developed over a longer period of time, were produced at a 4 times finer spatial resolution and were also derived from a number of climate models, as opposed to one. The unanimous pattern of wetting in the east projected by the scenarios is noteworthy, and is in agreement with the multi-model mean as projected in the IPCC AR4 for summer.
In contrast to the east of the region, where disparities in projected changes exist between the C-CAM climate scenarios in Engelbrecht (2005) and the scenarios evaluated in this paper, both sources project relatively strong drying along the west coast and adjacent interior. The C-CAM future climate scenarios, like the scenarios evaluated in this paper, were simulated assuming the SRES A2 emissions scenario.
The regional climate scenarios evaluated in this paper project more distinctive patterns in changes in rainfall in the future than has been detected in observed rainfall records for the last century. This might be attributable, in part, to the challenges associated with detecting changes in observed records in South Africa, where these records are characterised by high inter-annual and intra-annual variability (Warburton and Schulze, 2005). The spatial scale of the analyses performed and the methods used are also factors determining the outcome of detection studies (Lloyd, 2009).
Recommendations for further research
It is recommended that the following be investigated in future research:
- The rate of expected change in the 1st half of this century vs. that in the 2nd half of the century
- Possible shifts in the seasonal timing of rainfall
- Projected changes in extreme rainfall events
- The impact of projected climate change on other climatic variables, e.g. temperature and potential evaporation
- The explicit assessment of the impacts of projected climate change on hydrological responses through the application of climate scenarios in a hydrological model
- The application of alternative emission scenarios in climate scenario development to define the full envelope of possible change.
Conclusion
The regional scenarios of climate change evaluated in this paper facilitate studies of the impact of climate change on water resources to be conducted at a finer spatial scale and with a greater degree of confidence (stemming from the availability of multiple scenarios), than has previously been the case. As convergence becomes apparent, there is now an arguable basis for developing appropriate response strategies for incorporation into adaptation policy. Perhaps one of the greatest challenges in this regard is now to explore the issues of uncertainty and probability in order to develop a more rigorous basis to enable proactive responses. This paper has highlighted preliminary patterns of change that are likely, and has recommended future areas of research in support of efforts to adapt to climate change in the region.
Acknowledgements
The authors wish to thank the Water Research Commission for funding the research. The modelling groups, the Program for Climate Model Diagnosis and Intercomparison (PCMDI) and the World Climate Research Programme's (WCRPs) Working Group on Coupled Modelling (WGCM) are also thanked for their roles in making available the WCRP CMIP3 multi-model dataset. Support of this dataset is provided by the Office of Science, US Department of Energy.
References
CHEN M, DICKINSON RE, ZENG X and HAHMANN AN (1996) Comparison of precipitation observed over the continental United States to that simulated by a climate model. J. Clim. 9 (9) 2233-2249. [ Links ]
ENGELBRECHT F (2005) Simulations of climate and climate change over Southern and tropical Africa with the conformal-cubic atmospheric model. In: Schulze RE (ed.) Climate Change and Water Resources in Southern Africa: Studies on Scenarios, Impacts, Vulnerabilities and Adaptation. WRC Report No. 1430/1/05. Chapter 4, 57-74. Water Research Commission, Pretoria, RSA. [ Links ]
FAUCHEREAU N, TRZASKA S, ROUAULT M and RICHARD Y (2003) Rainfall variability and changes in Southern Africa during the 20th century in the global warming context. Nat. Hazards. 29 (2) 139-154. [ Links ]
HEWITSON BC, TADROSS M and JACK C (2005a) Scenarios developed with empirical and regional climate model-based downscaling. In: Schulze RE (ed.) Climate Change and Water Resources in Southern Africa: Studies on Scenarios, Impacts, Vulnerabilities and Adaptation. WRC Report No. 1430/1/05. Chapter 3, 39-56. Water Research Commission, Pretoria, RSA. [ Links ]
HEWITSON BC, TADROSS M and JACK C (2005b) Climate change scenarios: Conceptual foundations, large scale forcing, uncertainty and the climate context. In: Schulze RE (ed.) Climate Change and Water Resources in Southern Africa: Studies on Scenarios, Impacts, Vulnerabilities and Adaptation. WRC Report No. 1430/1/05. Chapter 2, 21-38. Water Research Commission, Pretoria, RSA. [ Links ]
IPCC (2001) Climate Change 2001: The Scientific Basis. Contribution of Working Group I to the Third Assessment Report of the Intergovernmental Panel on Climate Change [Houghton JT, Ding Y, Griggs DJ, Noguer M, van der Linden PJ, Dai X, Maskell K and Johnson CA (eds.)]. Cambridge University Press, Cambridge, United Kingdom and New York, NY, USA. 881 pp. [ Links ]
IPCC (2007) Climate Change 2007: The Physical Science Basis. Contribution of Working Group I to the Fourth Assessment Report of the Intergovernmental Panel on Climate Change [Solomon S, Qin D, Manning M, Chen Z, Marquis M, Averyt KB, Tignor M and Miller HL (eds.)]. Cambridge University Press, Cambridge, United Kingdom and New York, NY, USA. 996 pp. [ Links ]
KIKER G (2000) South African Country Study on Climate Change: Synthesis Report for the Vulnerability and Adaptation Assessment Section. Report to the National Climate Change Committee, Department of Environmental Affairs and Tourism, Pretoria, South Africa. 74 pp. [ Links ]
LLOYD P (2009) On the determination of trends in rainfall. Water SA 35 (3) 237-244. [ Links ]
LYNCH SD, ZULU JT, KING KN and KNOESEN DM (2001) The analysis of 74 years of rainfall recorded by the Irwins on two farms south of Potchefstroom. Water SA 27 (4) 559-564. [ Links ]
MACKELLAR NC, HEWITSON BC and TADROSS MA (2007) Namaqualand's climate: Recent historical changes and future scenarios. J. Arid Environ. 70 (4) 604-614. [ Links ]
NAKIĆENOVIĆ N and SWART R (eds.) (2000) Special Report on Emissions Scenarios. A Special Report of Working Group III of the Intergovernmental Panel on Climate Change. Cambridge University Press, Cambridge, United Kingdom and New York, NY, USA. 599 pp. [ Links ]
OSBORN TJ and HULME M (1997) Development of a relationship between station and grid-box rainday frequencies for climate model evaluation. J. Clim. 10 (8) 1885-1908. [ Links ]
PERKS LA, SCHULZE RE, KIKER GA, HORAN MJC AND MAHARAJ M (2000) Preparation of Climate Data and Information for Application in Impact Studies of Climate Change over Southern Africa. Report to South African Country Studies for Climate Change Programme. ACRUcons Report 32. School of Bioresources Engineering and Environmental Hydrology, University of Natal, Pietermaritzburg. 75 pp. [ Links ]
RICHARD Y, FAUCHEREAU N, POCCARD I, ROUAULT M and TRZASKA S (2001) 20th century droughts in southern Africa: Spatial and temporal variability, teleconnections with oceanic and atmospheric conditions. Int. J. Clim. 21 (7) 873-885. [ Links ]
SCHULZE RE, LUMSDEN TG, HORAN MJC, WARBURTON M and MAHARAJ M (2005) An assessment of impacts of climate change on agrohydrological responses over Southern Africa. In: Schulze RE (ed.) Climate Change and Water Resources in Southern Africa: Studies on Scenarios, Impacts, Vulnerabilities and Adaptation. WRC Report No. 1430/1/05. Chapter 9, 141189. Water Research Commission, Pretoria, RSA. [ Links ]
VAN WAGENINGEN A and DU PLESSIS JA (2007) Are rainfall intensities changing, could climate change be blamed and what could be the impact for hydrologists? Water SA 33 (4) 571-574. [ Links ]
WARBURTON M and SCHULZE RE (2005) Historical precipitation trends over Southern Africa: a hydrology perspective. In: Schulze RE (ed.) Climate Change and Water Resources in Southern Africa: Studies on Scenarios, Impacts, Vulnerabilities and Adaptation. WRC Report No. 1430/1/05. Chapter 19, 326-338. Water Research Commission, Pretoria, RSA. [ Links ]
Received 16 May 2009; accepted in revised form 10 August 2009.
# This paper (now modified) was originally presented at the 13th SANCIAHS Symposium, 6-7 September 2007, Cape Town, South Africa
* To whom all correspondence should be addressed.
+2733 260 5486; fax: +2733 260 5818;
e-mail: lumsden@ukzn.ac.za
Is Groenvlei really fed by groundwater discharged from the Table Mountain Group (TMG) Aquifer?
Roger Parsons*
Parsons & Associates Specialist Groundwater Consultants, PO Box 2606, Somerset West, 7129, South Africa
ABSTRACT
Vankervelsvlei is a unique wetland located in the stabilised dunes east of Sedgefield. Groenvlei is one of a series of 5 brackish coastal lakes along the Southern Cape coast of South Africa, but is the only one disconnected from the sea. It has been hypothesised that discharge from the underlying Table Mountain Group Aquifer sustains Vankervelsvlei, which in turn discharges into Groenvlei. This paper critically reviews the conceptual model and information on which the hypothesis was based. It is argued that the conceptual model is flawed as it does not take account of topographical and geohydrological conditions prevalent in the area. Analysis of limited hydrochemical data did not explore other possible water sources, and the electrical conductivity characteristics used to confirm the link between the wetlands and the deeper secondary aquifer also apply to 56.3% of boreholes located in a variety of aquifer types across the Western Cape Province. No information is available that supports a link to the Table Mountain Group. Rather, it appears that Vankervelsvlei is sustained by direct rainfall and there is no hydraulic link between Vankervelsvlei and Groenvlei.
Keywords: surface water/groundwater interaction, wetlands
Introduction
Groenvlei is a brackish coastal lake known for its diverse bird life and is one of the best venues for large-mouth black bass angling. It is one of a series of 5 brackish coastal lakes along the Southern Cape coast of South Africa, but is the only one disconnected from the sea. It is located about 5 km east of the holiday town of Sedgefield (Fig. 1). Growing concern about the impact of proposed development in the vicinity of the near-pristine wetland has highlighted the need to understand the hydrological functioning of the system.
Roets (2008) researched the wetland in the context of groundwater dependence of aquatic ecosystems associated with Table Mountain Group (TMG) Aquifers. Together with Roets et al. (2008a; 2008b) and Roets (2009), he contends that discharge from the TMG Aquifer sustains Vankervelsvlei – a unique wetland located in the stabilised dunes east of Sedgefield – and thereafter discharges into Groenvlei. A critical review of this work indicates that the Roets conceptual model is flawed and not supported by basic geohydrological principles and available information. This paper evaluates the conceptual model in view of available information and presents an alternative model that takes account of existing information.
Description of study area
Groenvlei
Groenvlei has been described by Martin (1956), Fijen (1995) and Parsons (2008a). It has a west-east elongated shape being some 3.7 km long and 0.9 km wide. The surface area of the water body is 2.34 km2 while the surrounding vegetation in and peripheral to the water body covers 1.52 km2. The lake has a perimeter of 9 000 m, while that of the total wetland is 11 400 m. The maximum depth of Groenvlei is about 5 m, but much of the lake is less than 3.7 m deep (Martin, 1956). Groenvlei is located at an elevation of some 3 m a.m.s.l. on unconsolidated aeolian sands of Pleistocene and Recent age.
Little information is available regarding the thickness of the sands or the nature of the underlying geology. The contact between shale and quartzite of the Kaaimans Group and sandstone and quartzite of the Peninsula Formation of the Table Mountain Group is covered by sand, but is probably located directly west of the wetland (Coetzee, 1979). These rocks are at least of Ordovician age (495-443 Ma). Groenvlei started to form about 17 000 years ago during the last glacial period. Martin (1959) postulated that Groenvlei had an estuarine origin, and was connected to Swartvlei some 5 km to the west about 8 000 years ago. Wind-blown sand deposits covered the area between Groenvlei and the sea some 6 000 years ago, effectively covering evidence of the lake's earlier connectivity to the sea.
The lake does not have any influent rivers, and is fed only by direct rainfall and groundwater inflow (Parsons, 2008a). This is offset by evaporation losses from the lake surface, evapotranspiration losses from vegetation in and peripheral to the water body, and subsurface discharge along the southern shores. Long-term monitoring of the water level of the lake by the Department of Water Affairs and Forestry (DWAF, now the Department of Water and Environmental Affairs) shows levels ranging between 2.25 m a.m.s.l. and 3.40 m a.m.s.l., with a median of 2.76 m a.m.s.l. The water level displays an interannual range of about 0.3 m.
Vankervelsvlei
Vankervelsvlei is located about 2 km north-east of Groenvlei, and was described by Irving and Meadows (1997) as a floating bog. It has no open water and the peat is in the order of 10 m thick. Vankervelsvlei is a rare geomorphological feature located at an elevation of some 150 m higher than Groenvlei.
The wetland is located on a stabilised aeolian dune described by Illenberger (1996). Irving and Meadows (1997) reported that clay layers at least 3.5 m thick underlie the upper peat layers. The wetland is thought to overlie rocks of the Peninsula Formation of the Table Mountain Group, but the depth to the fractured aquifer system is not known. Vankervelsvlei is at an elevation of 150 m a.m.s.l. and covers an area of only 0.5 km2. It is an enclosed interdunal depression with no surface water inflows. Water in the wetland is completely concealed by a dense covering of matted sedge vegetation to a depth of approximately 2 m below the surface. The basal sediments of Vankervelsvlei have been dated at 40 000 years old.
Roets conceptual model
Roets et al. (2008b) presented a hypothetical cross-section through the southern Cape coastal belt to illustrate their understanding of surface water/groundwater interaction and the role that the TMG Aquifer plays in sustaining both Vankervelsvlei and Groenvlei (Fig. 2). Their thesis is that groundwater is discharged from the confined TMG Aquifer up into Vankervelsvlei, and then flows into Groenvlei. Analysis of groundwater chemistry data is used to cement the link between the underlying TMG Aquifer and the wetlands. However, available topographical, geological, geohydrological and hydrochemical data do not support this model.

Topography
Critically, the hypothetical section misrepresented the topography of the area and incorrectly portrayed the elevation of Groenvlei in relation to both the sea and Vankervelsvlei (Fig. 3). Groenvlei is at an elevation of about 3 m a.m.s.l., while Vankervelsvlei is at an elevation of about 150 m a.m.s.l. If there is a hydraulic link between the 2 water bodies, the average hydraulic gradient would be in the order of 0.054. This is an extraordinarily steep hydraulic gradient, the likes of which are not reported in scientific literature. Typically, hydraulic gradients range between 0.0005 and 0.01 (Hartner, 2003). The hydraulic gradients of major primary aquifers in South Africa conform to this range (Table 1). The steep hydraulic gradient postulated in the conceptual model would also result in significant groundwater discharge along the northern slope of the valley between Groenvlei and Vankervelsvlei, a phenomenon not observed in the field. Given the highly transmissive nature of the Sedgefield Aquifer and the measured hydraulic gradients ranging between 0.001 and 0.004 reported by Parsons (2005), a hydraulic gradient in the order of 0.05 is refuted.
Groundwater levels
Seven deep boreholes have been drilled into the stabilised dunes within 2 km of Groenvlei (Parsons, 1997; 2004). All are located west of the water body. In all instances, the groundwater level was measured to be within 3.7 m of mean sea level (Table 1). Further, groundwater level monitoring has revealed that groundwater levels display little interannual variation (~0.2 m) (Parsons, 2006). Given that Vankervelsvlei is located in the same geological and geohydrological setting as that into which the boreholes were drilled, the water levels of 148.6 m a.m.s.l. and 148.8 m a.m.s.l. measured by Roets (2008) in piezometers VKA and VKB at Vankervelsvlei are in all likelihood perched water levels, and not representative of a regional water table or piezometric surface. The perched condition is in line with the description of Vankervelsvlei presented by Irving and Meadows (1997) and means that the water body is disconnected or detached from the underlying groundwater system. This also refutes the hydraulic link between Groenvlei and Vankervelsvlei.
It is noteworthy that the groundwater levels measured in piezometers VKA and VKB do not support the piezometric surface illustrated in the Roets conceptual model (Fig. 2). Except for water levels measured by himself in shallow piezometers at 10 locations around Groenvlei and Vankervelsvlei, Roets (2008) and Roets et al. (2008a; b) fail to present or refer to any groundwater level data in support of the groundwater flow patterns illustrated in Fig. 2. The piezometric surface indicated in the conceptual model would result in widespread artesian conditions if artesian conditions existed in the manner required by the conceptual model to discharge into Vankervelsvlei. It is recognised that the piezometric head can only be measured if boreholes penetrate through the confining layer and into the confined aquifer. None of the boreholes in the vicinity of the wetlands achieve this. Further, artesian conditions are not reported in any of the regional geohydrological assessments of the area (Meyer, 1999; Parsons and Veltman, 2006). Given the absence of artesian conditions in the region and the measured borehole data presented in Table 2, it is not possible for discharges from the TMG Aquifer to lift or push up more than 150 m through permeable sand to sustain Vankervelsvlei.
In addition to TMG groundwater discharging from depth upwards into Vankervelsvlei, the conceptual model also requires water to be discharged from the 0.5 km2 wetland downward into the subsurface to create and maintain the hydraulic link with Groenvlei. It is simply not possible for the opposing groundwater flow directions to co-exist in such a small area.
Geology
Roets (2008) chose to rely on national geological shape files presented in ENPAT and used by Fortuin (2004) rather than the published 1:250 000 geological map of the area (Coetzee, 1979). The position of the contact between the Kaaimans Group and the Table Mountain Group presented by Fortuin (2004) does not correlate with that presented by the more authoritative and site-specific Coetzee (1979). Use of the simplified 1:1 000 000 scale geological shape file from the WR90 data set (Midgley et al., 1994) to define geology at a local scale is problematic. Some correlation exists with the ENPAT data set and that presented by Coetzee (1979), but the principle lithology of a geological unit is presented as opposed to the stratigraphic groupings. This may account for the apparent confusion regarding whether the Peninsula Formation or the Nardouw Subgroup underlies the wetlands.
Notwithstanding these differences, the geological detail presented in Fig. 2 does not conform to any of the geological information referred to above. In all likelihood, both Groenvlei and Vankervelsvlei are underlain by rocks of the Table Mountain Group (and more specifically the Peninsula Formation). Neither the thickness of the sand (depth to hard rock) nor the lithology of the underlying aquifer is known. The presence of a laterally extensive 'shale aquitard' is pure speculation and without foundation. The aquitard is required to support the thesis that Groenvlei and Vankervelsvlei are sustained by discharge from the underlying TMG Aquifer as the confining layer provides the mechanism needed for groundwater from depth to flow upwards and into the wetlands. The relatively thin and distinctive Cederberg Formation, which could act as the aquitard, has not been mapped in the vicinity of the 2 wetlands (Coetzee, 1979), and interpretation of the geological map indicates that they are underlain by arenites of the Peninsula Formation. The map also indicates that the Table Mountain Group is folded. Consequently, it is improbable that the Cederberg Formation would have the near-horizontal orientation indicated in Fig. 2. The absence of the Cederberg Formation further undermines the validity of the conceptual model, and portrayal of the TMG Aquifer as a confined aquifer is a misrepresentation of prevailing geohydrological conditions.
Roets (2008, p 123) states that 'Groenvlei and Vankervelsvlei are lowland wetland systems associated with major east-west running fault systems located to the south of the Outeniqua Mountains.' At no point does he indicate where these major fault systems are, and none are indicated on the geological map of the area (Coetzee, 1979). Faulting of the Cederberg Formation is a key component of the conceptual model, as it provides the mechanism for groundwater in a confined aquifer to discharge into overlaying primary aquifer system and Vankervelsvlei. The absence of any indication of faults in the area advocates this aspect of the conceptual model to be speculative and the above statement to be without foundation.
Chemical character
Roets (2008) argues that because the electrical conductivity (EC), pH and concentrations of Na, Cl and Fe of water sampled from shallow wellpoints at 2 sites at Vankervelsvlei and 3 sites around Groenvlei – all collected on 30 July 2006 – fall within ranges presented by Brown et al. (2003) as being typical of groundwater from the TMG Aquifer, the sampled water must originate from the deeper secondary aquifer system. In their report, Brown et al. (2003) presented a table from Smith et al. (2002) that displayed the mean, minimum and maximum for 13 chemical parameters from 75 boreholes drilled into the Nardouw Subgroup and 28 boreholes drilled into the Peninsula Formation in the Klein Karoo.
By simply comparing 5 chemical parameters measured at the 5 sites at Vankervelsvlei and Groenvlei to ranges considered by Brown et al. (2003) as being typical of groundwater from TMG aquifers, Roets (2008, p. 138) concludes that 'the hydrochemical data of the groundwater from this study suggests that Vankervelsvlei and Groenvlei are dependent on groundwater from the TMG Aquifer.' DWAF's hydrochemical database contains 14 377 EC records from boreholes located in a variety of aquifer types across the Western Cape Province. Of these, 56.3% have an EC in the range of 9 to 155 mS/m. Consequently, this EC range is not unique to TMG Aquifers and cannot be used for hydrochemical 'finger printing' purposes.
A review of the range of EC from 4 major coastal primary aquifer systems across South Africa shows that the EC range displayed by the small data set collected by Roets (2008) is within the range of EC displayed by the Sedgefield Aquifer, the Atlantis Aquifer, the Cape Flats Aquifer and the Zululand Coastal Aquifer around St Lucia (Fig. 4). Only the Sedgefield Aquifer is partially underlain by rocks of the Table Mountain Group, with the other aquifers having no connection to the Group at all. It is far more likely that groundwater quality characteristics displayed by Roets's data are typical of coastal primary aquifers rather than TMG Aquifers. As the chemical character typical of coastal primary aquifers across South Africa overlaps with that of TMG groundwater, the relation is coincidental rather than causative. The interpretation that the chemical character of groundwater adjacent to the 2 wetlands is indicative of a TMG Aquifer link is wrong.
Roets (2008, p. 139) attempts to cement his argument that Vankervelsvlei is fed by groundwater from the TMG Aquifer by attributing the iron (Fe) concentration of 382.23 mg/ℓ recorded in VKB (11 m) to 'the presence of the Nardouw Formation'. Notwithstanding the fact that the geological map of the area indicates that Vankervelsvlei is underlain by the Peninsula Formation and not by the Nardouw Subgroup and significantly lower Fe concentrations were recorded at shallower depths at the same site (0.5 m = 9.5 mg/ℓ; 1 m = 7.0 mg/ℓ), Fe concentrations such as these are unprecedented. High Fe concentrations of some 30 mg/ℓ monitored by Parsons (2008b) at Arabella Country Estate are thought to represent the upper levels of Fe in groundwater, while Smith et al. (2002) set the maximum Fe concentration of the 2 geological units at 0.2 mg/ℓ and 15.4 mg/ℓ. A concentration an order of magnitude higher than these maxima is hence improbable. If the value of 382 mg/ℓ is not a laboratory-related error, then Fe contained in the vegetative mat in Vankervelsvlei deserves closer scrutiny.
Roets (2008) compares his groundwater quality data to the chemical character of groundwater from the Nardouw Subgroup. Interpretation of the 1:250 000 scale geological map of the area (Coetzee, 1979) suggests that Groenvlei and Vankervelsvlei are underlain by the Peninsula Formation and not the Nardouw Subgroup. The EC range presented by Brown et al. (2003)) for the Peninsula Formation is much narrower (3 mS/m to 26 mS/m) than for the Nardouw Subgroup (9 mS/m to 155 mS/m), and only 25% of Roets's data fall within the Peninsula Formation range.
Discussion
Roets (2008) and Roets et al. (2008b) used multivariate cluster analysis of mean EC values to group piezometer positions displaying the same or similar EC characteristics. They over-interpreted the results by stating that the groundwater at the different locations has a 'shared groundwater source', as the statistical analyses merely point to a similar character. They make similar and repeated claims that all data presented by them points to the 2 wetlands being dependent on groundwater from the TMG Aquifer, and the 2 wetlands being hydraulically linked. Based on available information and an evaluation of the information presented by them, they have failed to provide any scientifically credible evidence that either Vankervelsvlei or Groenvlei are fed by discharges from the TMG Aquifer or that the 2 wetlands are hydraulically linked. Consequently, any conclusions and recommendations based on their hypotheses are without standing.
A major weakness of the reviewed research of Vankervelsvlei is that it did not consider the fact that the floating bog is solely sustained by direct rainfall. The absence of surface runoff, the expected depth of the regional water table and the low ECs measured by Roets (2008) support this interpretation. It is noteworthy that Parsons (2008a) estimated that direct rainfall accounted for almost 40% of the inflow into Groenvlei, while direct rainfall accounts for 38% of the freshwater input into Lake St Lucia (Van Niekerk, 2004). Both Irving and Meadows (1997) and Roets (2008) reported that Vankervelsvlei has no open water. The wetland can be sustained by a relatively small volume of water as the impermeable character of the base of the vlei prevents or restricts the downward percolation of water, and the absence of a dry season results in the vlei being continually recharged by rainfall. Water retention in the vlei is further enhanced by the dense sedge vegetation concealing the water surface (and hence reducing direct evaporation losses) while the organic nature of the soils promotes soil moisture retention. The rainwater-fed theory is both simple and plausible while the convoluted TMG Aquifer-fed theory is not supported by available geohydrological data or geohydrological principles.
An alternative conceptual model based on available geological and geohydrological information is presented in Fig. 5. It is acknowledged that the depth to bedrock is not known, but based on information presented by Coetzee (1979) it is likely to comprise rocks of the Peninsula Formation. The unconfined primary aquifer system is fed by recharge from rainfall that percolates through the vadose zone until it reaches the regional water table of the primary aquifer. The regional hydraulic gradient is typical of that of transmissive primary aquifers and is in the range of 0.001 to 0.004 reported by Parsons (2008a). Depth to the regional water table at Vankervelsvlei is predicted to be in the order of 145 m below ground level. Vankervelsvlei is fed by direct rainfall only, with a low permeability clay base preventing or retarding the downward percolation of water in the wetland to the aquifer. By contrast, Groenvlei is fed by both direct rainfall and groundwater. There is no hydraulic link between the 2 wetlands, with Vankervelsvlei being described as a disconnected system. Groenvlei is a flow-through system, as described by Born et al. (1979).
It is not claimed by Roets (2008) that Groenvlei is fed directly from the TMG Aquifer. Rather it is hypothesised that TMG groundwater discharges into Vankervelsvlei and then discharges from the wetland into Groenvlei (Fig. 2 –'secondary discharge'). However, given Groenvlei's low elevation and proximity to the coast, it is theoretically possible that deep circulation in the TMG Aquifer could discharge into the Sedgefield Aquifer, and thereby sustain Groenvlei. The study of such a theory will require the drilling of a large number of deep boreholes into the TMG Aquifer, supported by hydrochemical and isotopic examination. Until such time that there is any evidence of Groenvlei being sustained by discharges from the TMG Aquifer, such theories should be treated with circumspection.
Conclusions
It is concluded that Roets (2008; 2009) and Roets et al. (2008a; b) failed to provide any credible scientific evidence that either Vankervelsvlei or Groenvlei are fed by discharges from the TMG Aquifer or that the 2 wetlands are hydraulically linked. The conceptual model presented by them is not supported by available geohydrological data or geohydrological principles. Their thesis is based on speculation and lacks scientific rigour, having failed to consider water sources other than that from the TMG Aquifer. The interpretation that the chemical character of groundwater adjacent to the 2 wetlands is indicative of a TMG Aquifer link is wrong, as the character typical of coastal primary aquifers across South Africa overlaps with that of TMG groundwater. There is no hydraulic link between Vankervelsvlei and Groenvlei, and the former wetland is fed only by direct rainfall. Groenvlei is fed by direct rainfall and groundwater, and the possibility that it is being fed by the underlying TMG Aquifer requires further research before it can be given credence.
Acknowledgements
The provision of groundwater quality data by Mrs Rooseda Peters of the Department of Water and Environmental Affairs is gratefully acknowledged. Review of an earlier version of this paper and guidance provided by Prof. Mike Meadows and Prof. Gerrit van Tonder were extremely helpful. The constructive comments of the 2 anonymous reviewers are also acknowledged.
References
BORN SM, SMITH SA and STEPHENSON DA (1979) Hydrogeology of glacial-terrain lakes, with management and planning applications. J. Hydrol. 43 7-43. [ Links ]
BROWN C, COLVIN C, HARTNADY C, HAY R, LE MAITRE D and RIEMANN K (2003) Ecological and Environmental Impacts of Large-Scale Groundwater Development in the Table Mountain Group (TMG) Aquifer System. Draft discussion document for WRC Project No. K5/1327 (unpublished). Water Research Commission, Pretoria, South Africa. [ Links ]
COETZEE F (1979) 3322 Oudtshoorn – 1:250 000 Geological Map Series. Geological Survey, Pretoria, South Africa. [ Links ]
DU TOIT IM and WEAVER JMC (1995) Saldanha Steel Project – Groundwater Investigation. Report No. 27/95, Watertek, CSIR, Stellenbosch, South Africa. [ Links ]
DYKE G (1992) Western Cape Systems Analysis – A Review of the Groundwater Resources of the Western Cape. Report No. P G000/00/2591, Department of Water Affairs and Forestry, Pretoria, South Africa. [ Links ]
FIJEN APM (1995) Groenvlei Lake Catchment Water Management Strategy Main Report. Department of Water Affairs and Forestry, Pretoria, South Africa. [ Links ]
FLEISHER JNE (1990) Atlantis Groundwater Management Programme – the Geohydrology of the Witzand Wellfield. Report No. 2/90, Watertek, CSIR, Stellenbosch, South Africa. [ Links ]
FORTUIN M (2004) A Geographical Information System Approach to the Identification of Table Mountain Group Aquifer "Type Area" of Ecological Importance. Unpublished M.Sc. Thesis, University of the Western Cape, Cape Town, South Africa. [ Links ]
HARTNER T (2003) Basic Concepts of Groundwater Hydrology. ANR Publication 8083, University of California, California, USA. [ Links ]
ILLENBERGER WK (1996) The geomorphic evolution of the Wilderness dune cordons, South Africa. Quaternary Int. 33 11-20. [ Links ]
IRVING SJE and MEADOWS ME (1997) Radiocarbon chronology and organic matter accumulation at Vankervelsvlei, near Knysna, South Africa. SA Geogr. J. (Special Edition) 101-105. [ Links ]
MARTIN ARH (1956) The ecology and history of Groenvlei. S. Afr. J. Sci. (March 1956) 187-198. [ Links ]
MARTIN ARH (1959) The stratigraphy and history of Groenvlei, a South African coastal fen. Aust. J. Bot. 142-167. [ Links ]
MEYER PS (1999) An Explanation of the 1:500 000 General Hydrogeological Map – Oudtshoorn 3320. Department of Water Affairs and Forestry, Pretoria, South Africa. [ Links ]
MEYER R, TALMA AS, DUVENHAGE AWA, EGLINGTON BM, TALJAARD J, BOTHA F, VERWEY J and VAN DER VOORT I (2001) Geohydrological Investigation and Evaluation of the Zululand Coastal Aquifer. WRC Report No. 221/1/01, Water Research Commission, Pretoria, South Africa. [ Links ]
MIDGLEY DC, PITMAN WV and MIDDLETON BJ (1994) Surface Water Resources of South Africa 1990. WRC Report No. 298/1/94. Water Research Commission, Pretoria, South Africa. [ Links ]
PARSONS RP (1997) Establishment of a Groundwater Monitoring Network at the New Sewage Treatment Plant, Sedgefield; Report 001/SEDM-1, Parsons & Associates Specialist Groundwater Consultantscc, Somerset West, South Africa. [ Links ]
PARSONS RP (2004) Exploratory Drilling and Testing of Boreholes to Augment Water Supplies to Sedgefield. Report No. 142/NINS-D1, Parsons & Associates Specialist Groundwater Consultantscc, Somerset West, South Africa. [ Links ]
PARSONS RP (2005) Groundwater Use at the Lake Pleasant Chalets & Lodges, East of Sedgefield. Report No. 166/LPC-D1, Parsons & Associates Specialist Groundwater Consultantscc, Somerset West, South Africa. [ Links ]
PARSONS RP (2006) Review of Groundwater Monitoring at Sedgefield April 2005 – January 2006. Report No. 187/NINS-1, Parsons & Associates Specialist Groundwater Consultantscc, Somerset West, South Africa. [ Links ]
PARSONS RP (2008a) Quantify Groundwater's Role in Sustaining Groenvlei, a Shallow Lake in the Southern Cape Region of South Africa. International Association of Hydrological Sciences Publ. 320, IAHS Press, Wallingford, United Kingdom. [ Links ]
PARSONS RP (2008b) Arabella Country Estate: Groundwater Monitoring – October 2008. Report No. 228/ARAB- D1, Parsons & Associates Specialist Groundwater Consultantscc, Somerset West, South Africa. [ Links ]
PARSONS RP and VELTMAN S (2006) Outeniqua Coast Water Situation Study - Groundwater Resources. Report No. 167/UWP prepared in association with the Department of Water Affairs and Forestry for UWP Consulting (Pty.) Ltd. and BKS (Pty.) Ltd., Parsons & Associates Specialist Groundwater Consultantscc, Somerset West, South Africa. [ Links ]
ROETS W (2008) Groundwater Dependence of Aquatic Ecosystems Associated with the Table Mountain Group Aquifer. Unpublished Ph.D. Thesis, University of the Western Cape, Cape Town, South Africa. [ Links ]
ROETS W, XU Y, RAITT L and BRENDONCK L (2008a) Groundwater discharges to aquatic ecosystems associated with the Table Mountain Group (TMG) Aquifer: A conceptual model. Water SA 33 (1) 77-87. [ Links ]
ROETS W, XU Y, RAITT L, EL-KAHLOUN M, MEIRE P, CALITZ F, BATELAAN O, ANIBAS C, PARIDAENS K, VANDENBROUCKE T, VERHOEST NEC and BRENDONCK L (2008b) Determining discharges from the Table Mountain Group (TMG) aquifer to wetlands in the Southern Cape, South Africa. Hydrobiol. 607 175-186. [ Links ]
ROETS W (2009) Groundwater contributions to surface resources in the Table Mountain Group Aquifer. Proc. Conf. Implementing Environmental Water Allocations. 23-26 February 2009, Port Elizabeth, South Africa. [ Links ]
SMITH ME, CLARKE S and CAVE LC (2002) Chemical evolution of Table Mountain Group groundwater and the source of iron. Proc. Conf. Ground Water Division. Sept. 2002, Somerset West, South Africa. 47-52. [ Links ]
TIMMERMAN LRA (1985) Preliminary report on the geohydrology of the Grootwater Primary Aquifer Unit between Yzerfontein and the Modder River. Technical Report No. Gh3372, Directorate of Geohydrology, Department of Water Affairs and Forestry, Cape Town, South Africa. [ Links ]
VAN NIEKERK L (2004) Preliminary Determination of the Ecological Reserve on a Rapid Level for the Lake St Lucia Estuary. Report No. ENV-S-C 2004-, Environmentek, CSIR, Stellenbosch, South Africa. [ Links ]
WRIGHT A and CONRAD JE (1995) The Cape Flats Aquifer – Current Status. Report No. 11/95, Watertek, CSIR, Stellenbosch, South Africa. [ Links ]
Received 15 May 2009; accepted in revised form 14 September 2009.
* To whom all correspondence should be addressed.
+2721 855-2480; fax: +2721 855-2363;
e-mail: roger@pasgc.co.za
Has monitoring failed the Olifants River, Mpumalanga?
S de VilliersI, *; ST MkweloII
IAEON, University of Cape Town, Rondebosch 7701, South Africa
IIDepartment of Geology, University of Fort Hare, Alice 5700, South Africa
ABSTRACT
Water quality monitoring in the Olifants River catchment, Mpumalanga, is evaluated using river water dissolved sulphate levels, one of the best indicators of pollution related to acid mine drainage. Assessment of long-term water quality records shows that monitoring has not been carried out systematically. In that it fails one of the most fundamental criteria of good environmental monitoring practices. At some monitoring stations sampling frequency has been scaled down from approximately weekly to monthly intervals over time, despite evidence for increasing and problematic levels of pollution. At the Loskop Dam dissolved sulphate levels have increased more than 7-fold since the 1970s evidently due to increasing levels of pollution within the Little Olifants River catchment. At 4 of the 7 long-term monitoring stations river water sulphate levels exceed the 100 mg/ℓ threshold value for aquatic ecosystem health most of the time for the duration of the record, and all of the time since about 2001. At these stations river water sulphate levels also exceed the 200 mg/ℓ threshold for human consumption 27 to 45% of the time, for the duration of the long-term record. These observations necessitate more frequent and improved monitoring, not evidently reduced efforts. A major concern is the location of a recently re-opened copper mine outside Phalaborwa, just upstream from the confluence of the Ga-Selati River and the Olifants River. Levels of copper sulphate, highly toxic to aquatic species, should be urgently investigated as a probable cause of recent fish and crocodile deaths in the Kruger National Park. In river systems subject to intensive mining activity, such as the Olifants River, toxic constituents such as copper, arsenic, chrome-VI, etc., currently not routinely measured by the Department of Water Affairs (DWA) need to be included in monitoring efforts as a matter of urgency. This will require drastic improvements in current water quality monitoring efforts, including the acquisition of modern analytical instrumentation.
Keywords: Olifants River, Mpumalanga, dissolved sulphate, monitoring
Introduction
The Olifants River in Mpumalanga is presently one of the most threatened river systems in South Africa (Van Vuuren, 2009; Ballance et al., 2001). Reports of unexplained fish and crocodile deaths within the catchment, including recently in the Kruger National Park have abounded for several years and have received a fair amount of attention, including the establishment of the 'Consortium for the Restoration of the Olifants Catchment' initiative (Van Vuuren, 2009). Despite obvious signs that water quality in the Olifants River has been deteriorating as a result of industrial, mining and agriculture activities, the trigger for episodic fish and crocodile deaths in the river system remains elusive. This raises serious concerns about the adequacy of monitoring efforts in the Olifants River system.
Environmental monitoring is the repetitive and systematic measurement of environmental characteristics, with the purpose of testing hypotheses of the effects of human activity on the environment. This requires the design of scientifically robust sampling and measurement programs, based on testable hypotheses, which involve repetitive sampling over an appropriate period of time. The detection of temporal and/or spatial differences is the most basic requirement of an environmental monitoring programme. With this in mind, this study evaluates water quality monitoring in the Olifants River, based on consideration of one water quality parameter only, dissolved sulphate (SO42-) levels.
The motivation for the simplistic approach adopted in this evaluation of monitoring in the Olifants River system is severalfold: elevated dissolved sulphate levels are indicative of pollution related to acid mine drainage (Anderson et al., 2000). The dissolved sulphate derives from the oxidation of metal sulphides such as pyrite, abundant in, for example, coal-rich lithologies and precious metal-rich deposits. This makes dissolved sulphate levels ideal for testing hypotheses such as that deteriorating water quality in the Olifants River is attributable to gold- and coal-mining activities in the upper catchment. Additionally, dissolved sulphate, unlike trace metals such as iron, is conservative at the concentrations and pH conditions observed in river systems, meaning it is not removed from solution through precipitation or reactions with other components (Anderson et al., 2000). Also, dissolved sulphate is relatively easy to measure, which ensures robust long-term data records. These characteristics of river water sulphate all contribute to making it ideal for the detection of temporal and spatial differences in water quality related to acid mine drainage within a catchment such as the Olifants River.
Water quality monitoring in the Olifants River: Sampling location and frequency
The Olifants River has a catchment size of about 54 750 km2, a mean annual runoff of 2 400 x106 m3 and is subject to intensive mining activities in most of its 9 secondary catchments (Fig. 1). The catchment is monitored by the National Chemical Monitoring Programme, with the aim to 'provide data and information on the surface inorganic chemical water quality of South Africa's water resources' (DWA, 2009). The National Toxicity Monitoring Programme, still in the developmental stage, will aim to measure and assess the status of and trends in potentially toxic substances in South Africa's water resources. The Directorate Water Quality Management, which oversees the NCMP and NTMP, and Regional Offices of the national Department of Water Affairs and Forestry, now the Department of Water Affairs, are jointly responsible for water quality in South Africa, in terms of Act 108 of 1996 of the Constitution of the Republic of South Africa (Statutes of the Republic of South Africa – Constitutional Law, 1996). The main objectives of the Water Quality Management Directorate include ensuring sustainable water quality management through source- directed controls and remediation-directed measures. River water quality data are available through the Resource Quality Services (DWA, 2009).

Data for 7 long-term monitoring sites in the Olifants River catchment were obtained for the purposes of this study (Fig. 1, Table 1). These include 2 stations in the upper reaches of the Olifants River and one on the Little Olifants River tributary, all in areas subject to intensive coal mining activities (Fig. 1). The ecological status of the Olifants River in this region has been classified as 'poor to unacceptable' (Ballance et al., 2001). The Loskop Dam monitoring stations are downstream from the confluence with the Wilge River, with a 'good to fair' ecological status, despite problems with mine effluent draining into the Wilge River tributary, and increasingly frequent fish deaths in the Lopkop Dam. Further downstream is the Oxford monitoring station, situated after the confluences with the Elands, Steelpoort and Blyde River tributaries (Fig. 1). The ecological status of the Elands River is poor to unacceptable, attributable largely to commercial agricultural activities. The Steelpoort River is in a 'fair to unacceptable' state. The Blyde River, which joins the Olifants River just upstream from the Oxford monitoring station, is in a 'good to natural' ecological state and generally improves water quality in the Olifants River downstream of their confluence (Ballance et al., 2001). The lowermost long-term monitoring station is at the Kruger National Park (KNP), just downstream of the confluence with the Ga-Selati River, which is in a 'fair to poor' state.

Most of the data sets are several decades long (Table 1). However, with the exception of the Middelburg Dam sampling station, where monitoring has been conducted at weekly intervals for most of the data record (Fig. 2), sampling frequency has been erratic and does not meet the fundamental requirement of environmental monitoring, that is systematic repetitive sampling. At the Wolwekrans, Witbank Dam and Oxford monitoring stations, sampling frequency has declined from highs of weekly, to twice a month or less. Sampling has been even more erratic at the Loskop Dam and Kruger National Park monitoring stations, which are currently being sampled at frequencies of monthly or less. Ironically, the latter 2 locations are most relevant to elucidating the increasing frequency of fish and crocodile deaths in the Olifants River system. From an environmental monitoring point of view, the reduction in sampling frequency at all but one of the Olifants River stations does not make sense and if a change in sampling frequency was warranted, it must have been towards increasing or maintaining sampling frequency.

Spatial trends in river dissolved SO42- in the Olifants River catchment
An often-repeated statement made in regards to water quality in the Olifants River is that water quality parameters are within acceptable levels. According to the South African Water Quality guidelines (DWAF, 1996a), the target water quality range (TWQR) for dissolved sulphate is below 200 mg/ℓ for human consumption. This is similar to the maximum contaminant levels prescribed by the Environmental Protection Agency in the USA and the European Union (WHO, 2004). There is no prescribed TWQR value available for aquatic ecosystems in the South African water quality guidelines (DWAF, 1996b). However, aquatic ecosystems are almost without exception more sensitive than humans to environmental pollutants and as a result TWQR values, where available, are usually lower. Maximum dissolved sulphate levels of 100 mg/ℓ have been proposed for aquatic ecosystems in for example Canada (Ministry of Environment, Lands and Parks, Province of British Columbia, 2000).
Within the Olifants River system the highest river water sulphate concentrations are observed at the Wolwekrans monitoring station, the furthest upstream site (Table 1, Fig. 3). This station is located in the area of most intense coal mining activity in Mpumalanga. The maximum value observed at Wolwekrans, 1 549 mg SO42-/ℓ, is more than 7 times the TWQR value, and almost 100 times higher than the lowest value observed, 16 mg/ℓ, with the latter value indicative of previous relatively unpolluted conditions at this site (Table 1). The high values are diluted to lower values at Witbank Dam further downstream, and to an even more significant extent by the time it reaches the Loskop Dam (Fig. 3; Table 1). Between the Loskop Dam and Oxford Stations, dilution by rivers such as the relatively pristine Blyde River (Fig. 1) results in a further reduction in sulphate levels, by a factor of more than 3 (Table 1, Fig. 3).
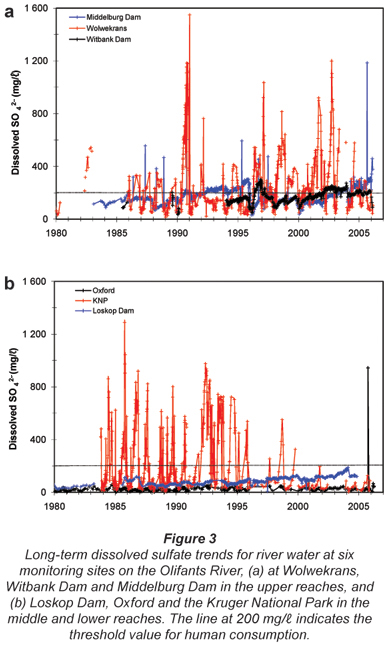
One of the most interesting features of the long-term monitoring data is comparison of sulphate level at the Oxford Station in the middle reaches of the Olifants River, with that further downstream site at the KNP (Fig. 3). The much higher sulphate values observed at the KNP site, most pronounced during the 1980s to 1990s, indicate a significant source of river water sulphate in the lower reaches of the Olifants River. The high sulphate values at the KNP station, in fact, are exceeded only by values observed at Wolwekrans (Table 1). The most likely source of the elevated sulphate levels observed at KNP is the Ga-Selati River (Fig. 1) and more specifically, copper and other mining activities at the Palabora Mining Company (Ltd.), just upstream of the KNP (Fig. 4).
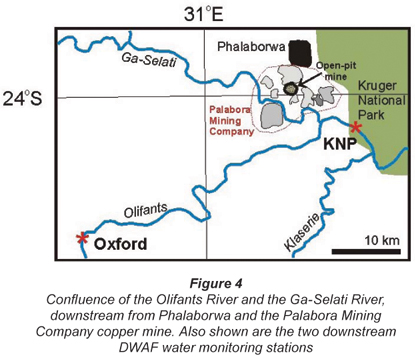
Despite encouraging evidence for dilution of high sulphate levels within the Olifants River system, unacceptably high levels are observed at almost all of the monitoring stations. The values observed, specifically at the Wolwekrans and KNP Stations, are equivalent to those measured in mine leachates (Hammarstrom et al., 2005) and rivers considered the most polluted in Europe (Majer et al., 2005; Monteith and Evans, 2005). It is difficult to envision a source for these high sulphate levels, other than acid mine drainage. Values exceeding the threshold value of 200 mg/ℓ for human consumption are observed at all of the stations, with the exception of the Loskop Dam (Table 1). This threshold is exceeded for 45% of the observations at Wolvekrans, and 27 to 38% of the time at 3 of the other stations: Witbank Dam, Middelburg Dam and the KNP site. Even more problematic is the percentage of time that dissolved sulphate exceeds the proposed 100 mg/ℓ threshold value for aquatic ecosystem health, the most problematic being the Middelburg Dam (93%), Witbank Dam (92%), Wolwekrans (75%), KNP (52%) and Loskop Dam (18 to 29%).
Temporal trends in river dissolved SO42- in the Olifants River catchment
A pronounced seasonal cycle with high sulphate levels during the August-October late winter period, i.e. towards the end of the dry season, is apparent at all of the stream-monitoring stations (Wolwekrans, Oxford and KNP; Figs. 3 and 5). This also coincides with the time when most episodes of fish and/or crocodile deaths have been reported. Although there are indications of a similar seasonal cycle at the dam stations, the amplitude is reduced, as a result of mixing within the dam systems. Superimposed on these seasonal cycles are long-term trends (Fig. 3). Unfortunately, one of the most problematic aspects of non-systematic sampling is its negative impact on rigorous statistical long-term trend analysis.


The most pronounced increase in sulphate levels is observed at the Loskop Dam (Fig. 6). Although sulphate levels in the Loskop Dam are still low relative to those observed at most of the other stations, it has increased by a factor of more than 7 since the 1970s. Importantly, levels have consistently been above the 100 mg/ℓ aquatic ecosystem threshold value since 2001. A similar consistent increase is observed at the Middelburg Dam (Fig. 3), where values have increased more than 3-fold since 2001. Additionally, values at this site have been persistently above the 200 mg/ℓ threshold for human consumption since 2004. Values at the Witbank Dam, in contrast, have been relatively stable over this time period. The implication, in the absence of long-term monitoring data for the Wilge River, is that increasing sulphate levels in the Loskop Dam have their origin in the Little Olifants River, the catchment area of the Middelburg Dam (Fig. 1).
Dissolved sulphate levels at the downstream Oxford Station have been relatively stable and below 100 mg/ℓ, with the exception of a spike (944 mg/ℓ) observed on 29 September 2005 (Fig. 3). This is the only spike of this magnitude observed at the downstream Oxford Station. Worryingly, it was observed several weeks after a similar spike at the Middelburg Dam (2 September 2005, Fig. 3), more than 300 km upstream. The time-lapse between these 2 spikes is consistent with the measured rate of river flow between these 2 sites. Unfortunately, there are no data available over this time period at the intermediate station, Loskop Dam, a result of the non-systematic sampling frequency. If the spike observed at the Oxford Station on 29 September 2005 is a remnant of the spike observed at the Middelburg Dam on 2 September 2005, it has disconcerting implications for the ability of such a pollution pulse to travel almost the entire length of the Olifants River.
Although sulphate levels at the KNP Station appear to have declined since 1995 (Fig. 3), this observation may be an artefact of the dramatic reduction in sampling frequency since then (Fig. 2). As mentioned in the previous section, these very high sulphate levels observed at the KNP Station compared to the Oxford Station imply a significant source of sulphate (and other water components) between these 2 sites. The mostly likely source of this sulphate is the activities of the Palabora Mining Company (Pty.) just upstream (less than 10 km) from the confluence of the Olifants River with the Ga-Selati River (Fig. 4). This includes the largest open-pit copper mine in the world, in addition to the most productive phosphate mine in South Africa. Open-pit copper mining ceased at this site in 2002 and has been replaced by underground mining, which commenced in 2005 (Palabora Mining Company, 2005). In addition to mining, smelting and refining of copper are carried out on site. The most relevant by-product of these activities is CuSO4 (copper sulphate). This, combined with changes in the extent of mining operations, may explain the temporal trends and high levels of river water sulphate at the KNP Station. However, this cannot be assessed, as no published long-term water quality data are available downstream from the mining activities, before the confluence of the Ga-Selati River with the Olifants River.
Copper mining activities on the Ga-Selati River, just upstream of the KNP monitoring site are important and relevant for another reason. Copper sulphate is highly toxic to fish and also invertebrates such as crabs and shrimps (Chen and Lin, 2001; Reardon and Harrell, 1990; Taylor et al., 1995; Torres et al., 1987). It is classified as a highly toxic substance, because of its harmful effects on aquatic species and also humans. As a result, its use as a pesticide to control bacterial and fungal diseases in the agricultural sector is controversial and questionable (Ahmed and Shoka, 1994). The South African TWQR for water copper levels is < 1 mg/ℓ for drinking water and < 0.3 and 1.2 to 1.4 µg/ℓ for soft and hard water aquatic ecosystems, respectively (DWAF, 1996a;b). These TWQR values (and those for other toxic water constituents such as lead, arsenic, chrome-VI etc.) are meaningless, however, if copper measurements are not carried out routinely as part of DWA's water quality monitoring programme. Dissolved copper levels far in excess of these TWQR values have, however, been reported in the scientific literature, in the proximity of mining areas in the Witwatersrand area (Naicker et al., 2003) and near the relatively unpolluted Oxford Monitoring Station (Botes and Van Staden, 2005).
The recent resumption of copper mining activities in close proximity to the KNP may very well be the smoking gun in the search for the cause of the recent fish and crocodile deaths in the Kruger National Park. However, the data required to test this hypothesis do not exist, yet. Measurement of heavy metal concentrations at very low levels (< 1 mg/ℓ or less) requires very sensitive instrumentation, such as ICP-MS (inductively coupled plasma mass spectrometry) and thorough sampling protocols. It is cause for concern and a situation in need of urgent attention that modern tools such as ICP-MS do not play a role in routine water quality monitoring in South Africa yet, particularly in areas impacted on by mining activities.
Conclusions
One of the most disconcerting aspects of the Olifants River long-term water quality data is the non-systematic nature thereof, especially in light of clear evidence for dramatically worsening conditions. Monthly sampling frequencies will capture pollution events of short duration by chance only. A 2nd major concern is that current monitoring efforts do not include routine measurement of toxic substances such as heavy metals in mining areas, or pesticides in agricultural areas. Most of the water quality parameters currently measured routinely are very interesting from a geochemical point of view (e.g. major cations and anions and alkalinity), but is of much less relevance to human health and environmental issues than trace levels of toxic substances. This, together with non-systematic sampling strategies and the absence of monitoring at several key sites, such as in close proximity of point sources such as the Palabora Copper Mine, makes it difficult to test hypotheses and to pinpoint the exact sources of increasing pollution in the Olifants River system.
It is true that there are 'uncertainties regarding the relationship between concentrations of the substances in the water and their health effects' (Kempster et al., 2007). It is also true that most South African water quality guideline values are not as stringent as those adopted by developed countries. It can be argued that water quality guidelines in developing countries such as South Africa should in fact be more stringent, to safeguard the well-being of generally poorer and less healthy human populations. Are the relevant authorities carrying out research to reduce these 'uncertainties' (Kempster et al., 2007), and on which side of these uncertainties do we choose to err? It is true that improved water quality monitoring programmes will have significant cost implications, both in 'instrumentation needed for monitoring and analysis', 'as well as trained operators' (Kempster et al., 2007). It is also true that the cost implications of environmental remediation will be even more substantial, and the cost to ecosystem and human health, immeasurable.
References
AHMED HMS and SHOKA AEA (1994) Toxic interactions between copper sulphate and some organic agrochemicals. Toxicol. Lett. 70 (1) 109-119. [ Links ]
ANDERSON RM, BEER KM, BUCKWALTER TF, CLARK McAULEY SD, SAMS JI III and WILLIAMS DR (2000) Water quality in the Alleghenyand Monongahela River Basins Pennsylvania, West Virginia, New York, and Maryland, 1996-98. US Geological Survey Circular 1202, 32 (http://pubs.water.usgs.gov/circ1202). [ Links ]
BALLANCE A, HILL L, ROUX D, SILBERBAUER M and STRYDOM W (2001) State of the Rivers Report: Crocodile, Sabie-Sand and Olifants River Systems. Resource Quality Services, DWAF, Pretoria, South Africa (www.csir.co.za/rhp). [ Links ]
BOTES PJ and VAN STADEN JF (2005) Investigation of trace element mobility in river sediments using ICP-OES. Water SA 31 (2) 183-191. [ Links ]
CHEN J-C. and LIN C-H. (2001) Toxicity of copper sulphate for survival, growth, molting and feeding of juveniles of the tiger shrimp, Penaeus monodon. Aquacult. 192 (1) 55-65. [ Links ]
DWA (2009) Department of Water Affairs - Resource Quality Services. http://www.dwaf.gov.za/iwqs.wms/index.asp (Accessed on 1 October 2009). [ Links ]
DWAF (1996a) South African Water Quality Guidelines (1st edn.) Vol. 8: Field Guide. Department of Water Affairs and Forestry, Pretoria, South Africa. [ Links ]
DWAF (1996b) South African Water Quality Guidelines. Vol. 7: Aquatic Ecosystems. Department of Water Affairs and Forestry, Pretoria, South Africa. [ Links ]
HAMMARSTROM JM, SEAL RR, MEIER AL and KORNFELD JM (2005) Secondary sulfate minerals associated with acid mine drainage in the eastern US: recycling of metals and acidity in surficial environments. Chem. Geol. 215 407-431. [ Links ]
KEMPSTER PL, SILBERBAUER M and KÜHN A (2007) Interpretation of drinking water quality guidelines - The case of arsenic. Water SA 33 (1) 95-100. [ Links ]
MAJER V, KRÁM P and SHANLEY JB (2005) Rapid regional recovery from sulfate and nitrate pollution in streams of the western Czech Republic - comparison to other recovering areas. Environ. Pollut. 135 17-28. [ Links ]
MINISTRY OF ENVIRONMENT, LANDS and PARKS, PROVINCE OF BRITISH COLUMBIA (2000) Ambient Water Quality Guidelines for Sulphate http://www.env.gov.bc.ca/wat/wq/BCguidelines/sulphate (Accessed on 1 October 2009). [ Links ]
MONTEITH DT and EVANS CD (2005) The United Kingdom Acid Waters Monitoring Network: a review of the first 15 years and introduction to the special issue. Environ. Pollut. 137 3-13. [ Links ]
NAICKER K, CUKROWSKA E and McCARTHY TS (2003) Acid mine drainage arising from gold mining activity in Johannesburg, South Africa and environs. Environ. Pollut. 122 29-40. [ Links ]
PALABORA MINING COMPANY (LTD.) (2005) Underground Mining http://www.palabora.com/Default.aspx?page=105 (Accessed on 1 October 2009) [ Links ]
REARDON IS and HARRELL RM (1990) Acute toxicity of formalin and copper sulphate to striped bass fingerlings held in varying salinities. Aquacult. 87 (3/4) 255-270. [ Links ]
STATUTES OF THE REPUBLIC OF SOUTH AFRICA – CONSTITUTIONAL LAW (1996) Constitution of the Republic of South Africa Act No. 108 of 1996. http://www.info.gov.za/documents/constitution/1996/a108-96.pdf (Accessed on 30 September 2009). [ Links ]
TAYLOR RM, WATSON GD and ALIKHAN MA (1995) Comparative sub-lethal and lethal acute toxicity of copper to the freshwater crayfish, Cambarus robustus (Cambaridae, Decapoda, Crustucea) from an acidic metal-contaminated lake and a circumneutral uncontaminated stream. Water Res. 29 (2) 401-408. [ Links ]
TORRES P, TORT L and FLOS R (1987) Acute toxicity of copper to Mediterranean dogfish. Comp. Biochem. Physiol. Part C: Comp. Pharmacol. 86 (1) 169-171. [ Links ]
VAN VUUREN L (2009) Experts unite to save abused river from extinction. The Water Wheel Jan/Feb 14-17. [ Links ]
WHO (World Health Organisation) (2004) Guidelines for Drinking-Water Quality (3rd edn.) Vol. 1 Recommendations. WHO, Geneva, Switzerland 515 pp. [ Links ]
Received 28 October 2008; accepted in revised form 14 August 2009.
* To whom all correspondence should be addressed.
+2773-228 1133; fax: +2786-623 4586;
e-mail: steph.devilliers@gmail.com
Who uses the fishery resources in South Africa's largest impoundment? Characterising subsistence and recreational fishing sectors on Lake Gariep
BR EllenderI; OLF WeylI, II, * ; H WinkerI
IDepartment of Ichthyology and Fisheries Science, Rhodes University, Grahamstown 6139, South Africa
IISouth African Institute for Aquatic Biodiversity, Private Bag 1015, Grahamstown 6139, South Africa
ABSTRACT
The African Union's prioritisation of inland fisheries as an investment area for poverty alleviation and regional economic development will require the development of management plans. These should be based on sound knowledge of the social dynamics of the resource users. In South Africa the social dynamics of resource users of inland fisheries have never been assessed. The purpose of this study was to assess the human dimensions of the anglers utilising the fishery in Lake Gariep, South Africa's largest impoundment. The study was based on 357 first-time interviews conducted on the lakeshore between October 2006 and December 2007. Anglers were categorised as recreational (39%) or subsistence (61%) based on their residency, occupation, primary motivation for angling, mode of transport and gear use. Subsistence anglers were local (99%), residing within 10 km of the place where they were interviewed, while recreational anglers included both local resident and non-resident members. The racial composition of anglers was dependent on user group and differed significantly (p < 0.05) from the demographic composition of the regional population. Recreational anglers were predominantly White (> 60% of interviews) and Coloured (> 25%), while 84% of subsistence anglers were Coloured and 16% Black African. Most recreational anglers had permanent employment or were pensioners while <30% of subsistence anglers were permanently employed. Most recreational users (82%) accessed the lake with their own vehicle while subsistence anglers mainly walked (63%) or used a bicycle (28%). Recreational interviewees either consumed (59%), sold (11%), gave away (10%) or released (20%) some of their catch. Subsistence anglers either ate their catch (53%) and/or sold (41%) their catch. Within the subsistence sector no anglers released fish after capture or gave some of the catch away. We conclude that this inland fishery contributes to the livelihood of the rural poor who use the lake on a subsistence basis and that recreational-angler based tourism may contribute to increased income and employment opportunities through related service industries.
Keywords: angling, livelihood, recreational, subsistence, policy
Introduction
South African inland fisheries are considered poorly developed and consist primarily of recreational angling because, historically, subsistence use was limited (Andrew et al., 2000). The recent identification of inland fisheries by the African Union as a priority investment area for poverty alleviation and regional economic development (NEPAD, 2005) is, however, likely to result in increased efforts to develop these fisheries. Inevitably the long term sustainable utilisation of these fisheries will require the development of management plans and interventions.
The actions of fishermen are at the centre of understanding fisheries resources and open access commons (St Martin, 2001). Race, gender and motivation to fish may affect the way fish stocks are exploited and, as a result, an understanding of the human dimensions of any fishery is necessary to improve its management (Arlinghaus and Mehner, 2004).
Worldwide, the paucity of multi-disciplinary information on fisheries is seen as a constraint to the development of effective fisheries management strategies (Neiland et al., 2000). The situation is no different in the South African context, where the focus of inland fisheries research was predominantly on biological information (Dorgeloh, 1994; Hamman, 1980; Schramm, 1993; Tómasson et al., 1984) rather than on the human dimension (Cadieux, 1980). Cadieux (1980) recognised the need to identify user trends in Transvaal fisheries in order to have a more holistic approach to management. In an assessment of the need for an inland fisheries policy in South Africa, Weyl et al. (2007) noted that in addition to recreational use, subsistence and commercial fisheries were developing on dams in the Northwest Province. The social dynamics of these user groups have, however, never been assessed for any large South African impoundment (Andrew et al., 2000).
The purpose of this study was to assess the human dimensions of the anglers utilising the fishery in Lake Gariep, South Africa's largest impoundment, in order to:
- Characterise the user groups of the fishery
- Determine whether the fisheries resource was utilised primarily for subsistence or recreational use
- Assess if all race groups utilised the fishery equally
- Attempt to assess how reliant the local community was on the resource.
Materials and methods
Study area
Lake Gariep (S30 38.703, E25 46.998) is an impoundment of the Orange River, situated between the Northern Cape, Eastern Cape and Free State Provinces in central South Africa, and has a surface area of approximately 360 km2 (Fig. 1). The lake has a total shoreline of approximately 400 km which falls under the jurisdiction of 2 local nature conservation authorities (Eastern Cape Parks and Free State Nature Conservation). Most of the shoreline is closed to angling but open-access fishing regions have been allocated near 3 residential areas situated on the shoreline: Gariep Dam (S30 36.721, E25 29.663), Venterstad (S30 46.531, E25 47.901) and Bethulie (S30 30.081, E25 58.554). The Gariep Dam area includes the small settlement of Hydropark, while Venterstad includes the small settlement Oviston which, although separate, falls under the same administration as Venterstad and utilises the same angling area on the lake. Bethulie, in the Free State Province, was excluded from this assessment because preliminary surveys showed that residents only fished in a shallow pan that was not connected to the lake except at very high lake levels. In the main lake, 2 x 35 km fishing areas have been designated for anglers from the residential areas of Gariep Dam and Venterstad, which are referred to as Gariep Dam fishing area (GDFA) and Venterstad fishing area (VSFA), respectively (Fig. 1).

The settlement of Gariep Dam (population 1180, Free State Department of Agriculture, 2009) is situated on the western edge of the lake, in the Free State Province, and activities in this settlement are largely focused on tourism and hydro-electric power generation. Guesthouses and a resort offer ±1 000 beds to tourists visiting the town. The Venterstad settlement (population 4 550; Adkinson and Marais, 2007) is a service centre for surrounding farmers. The small settlement of Oviston (population 601; Adkinson and Marais, 2007) is considered a retirement village with limited tourist facilities (±150 beds; Carey, 2008), and falls under the Venterstad administration. The 2 settlements are therefore discussed as one. A summary of the social dimensions of the municipal areas of these 2 settlements, determined during the 2001 national census (Statistics South Africa, 2003), is provided in Table 1.
Questionnaire survey
Both 35 km long fishing areas, GDFA and VSFA, were surveyed on a bi-monthly basis between October 2006 and December 2007. Each area was surveyed for 1 week during which sampling was conducted on 3 randomly-selected weekdays and on both weekend days. The VSFA sampling region was divided into 2 strata of approximately equal size for sampling, and on each sampling day a stratum was randomly selected and all anglers within that stratum interviewed using a semi-structured questionnaire survey. The questionnaire was designed to determine:
- Origin of the anglers
- Angler demographics (race/gender/age)
- Primary motivation for angling (sale/recreation/subsistence)
- Means of transport used to get to the lake (walk, bicycle, lift, own vehicle)
- Occupation (unemployed, permanent, part-time, pensioner, student/scholar)
- Gear types (hand line or fishing rod).
As some anglers were encountered more than once, each was asked whether they had been interviewed before. To avoid responses from local anglers being overemphasised, only first-time interview data were used in all analyses.
Data were compared using non-parametric techniques. Comparisons between regions and groups were undertaken using a test of independence based on χ2 contingency tables (MS Excel 2003, Microsoft®). Frequency distributions were compared using the Kolmogorov-Smirnov Test (Statistica 8.0, StatSoft®). A significance level of p < 0.05 was used for all tests.
Results
A total of 621 angler interviews were conducted between October 2006 and December 2007. Of these, 145 first-time interviews were conducted in GDFA and 212 in VSFA.
Characterisation of subsistence and recreational anglers
Exploratory analysis of our data was used to define the sectors utilising Lake Gariep according to:
- Occupation
- Primary motivation for angling
- Mode of transport used to access angling area
- Distance travelled
- Angling gear used (Fig. 2).

Based on this, participants could be separated into 2 user groups: subsistence and recreational anglers, as defined in Table 2. The utilisation patterns and characteristics of these groups are summarised in Table 3 (next page).
The proportion of recreational to subsistence anglers differed by area (χ2 test of independence: χ2 = 66, df = 2, p < 0.05). In GDFA 74% of interviews were conducted with recreational anglers while in VSFA subsistence anglers dominated (80% of interviews). In both areas subsistence anglers were local (99%), residing within 10 km of the place where they were interviewed. Recreational users comprised both local resident and non-resident members. The proportions of resident recreational anglers, (those residing within 10 km of the fishing area) differed significantly between GDFA and VSFA. At GDFA recreational users were mostly tourists with only 32% residing within 10 km of the place of interview while in VSFA recreational anglers were mostly resident with > 80% residing within 10 km of their angling area.
Fisher demographics
The demographic characteristics are summarised in Table 3. Race was dependent on user group in both regions (χ2 test of independence - GDFA: χ2 = 66, df = 2, p < 0.05; VSFA: χ2 = 259, df = 2, p < 0.05) and differed significantly from the demographic composition of the settlements (χ2 test of independence: χ2 = 231, df = 2, p < 0.05). In both regions recreational anglers were predominantly White (> 60% of interviews); Coloured anglers comprised > 25% and Black African anglers made up less than 15%. This differed from the subsistence sector where more than 84% were Coloured and 16% were Black African.
Recreational angling was also an adult male-dominated activity (76% of interviews), with women and children making up 16% and 8% of interviews, respectively. Anglers in the recreational sector were fairly evenly distributed between the ages of 20 and 70 years old, with anglers between 40 and 60 years old being the dominant group. The majority of subsistence anglers were adult men (84% of interviews); 10% were women and 6% children under the age of 10 years. The age-frequency distribution of anglers did not differ by sector or area (Kolmogorov-Smirnov Test: p > 0.05). The age-frequency distribution of subsistence anglers from both areas was bi-modal with 1 mode at ages between 20 and 40 years and a 2nd mode between 40 and 60 years (Table 3). In the recreational sector, VSFA had a higher frequency (38%) of older (> 60 years old) anglers than GDFA (7%).
Occupation and employment rate
For anglers in both areas, occupation was dependent on user group (χ2 test of independence – GDFA: χ2= 43, df = 3, p < 0.05; χ2 test of independence – VSFA: χ2 = 59, df = 2, p < 0.05). In GDFA, recreational anglers were predominantly employed (78%), with a further 12% being pensioners. In VSFA, however, recreational anglers were predominantly pensioners (46%), a further 26% had permanent employment, and a small portion consisted of either students or scholars. Subsistence anglers in both areas had high unemployment rates (63% in VSFA and 40% in GDFA), which was consistent with regional trends (Table 1). In GDFA 30% of subsistence anglers had a permanent job while in VSFA only 12% of subsistence anglers had some sort of stable employment. Casual work was engaged in by 10% of GDFA and 14% of VSFA subsistence anglers (taking part-time jobs when available). Pensioners made up 17% and 3% of GDFA and VSFA subsistence anglers respectively.
Transport
The mode of transport differed between user groups (χ2 test of independence: χ2 = 181, df = 3, p < 0.05). Most recreational users (82%) accessed the Lake with their own vehicle, 15% caught a lift and only 3% walked. Subsistence anglers predominantly walked to access the resource (63%), few owned a bicycle (28%) and some caught a lift (9%) from a vehicle owner.
Fate of fish
The fate of caught fish was dependent on user group (χ2 test of independence: χ2= 231, df = 3, p < 0.05). Fifty-nine per cent of recreational interviewees consumed the fish they caught, 11 % sold a fraction of their catch, 10% gave some away and 20% released some of their catch. Subsistence anglers either ate their catch (53%) and/or sold (41%) their catch. Within the subsistence sector no anglers released fish after capture or gave some of the catch away.
Discussion
The complexity of the Lake Gariep fishery was highlighted by the diversity of user groups, races and origins of anglers using the lake (Table 3). Despite regional differences in user group dynamics, overall utilisation of the fishery was dominated by subsistence anglers. This exemplifies the development of subsistence inland fisheries in South Africa.
Although there were some exceptions, in the context of Lake Gariep, subsistence anglers were local residents that did not have other employment, walked to the lake to fish with hand lines and ate or sold what they caught. Although in many instances worldwide subsistence fishing is part of a diverse livelihood strategy and is carried out in conjunction with other activities such as agriculture (Cerdeira et al., 2001), most subsistence interviewees responded that they lacked alternative income sources. The lack of alternative employment by subsistence anglers indicates that fishing may be seen as a last resort activity, practised by the poorest people (Smith et al., 2005). This is further supported by the high (70%) unemployment rate among subsistence fishers which was much higher than that in the general population in the area (33%, Table 1).
The primary motivation for subsistence anglers was for food and no interviewee responded that they sold their entire catch. Many, however, indicated that surplus catch was sold and therefore the fishery not only provides food security opportunities but also contributes to income generation. The consumption of caught fish and the revenue provided by selling fish are important commodities in many rural communities (Neiland et al., 2000).
Entry costs into the fishery resource are minimal, with the total cost of a hand line approximating ZAR20 (100 m of monofilament line = ZAR10; wire = ZAR 2; hooks = ZAR8; Ellender, 2009) and access being gained mainly by walking or by using bicycles. The use of low-cost transport to access the resource is ubiquitous with subsistence fisheries worldwide (Branch et al., 2002; Brown and Toth, 2001). The fishery is therefore highly accessible to the rural poor and appears to provide an important safety-net for food security.
Despite the availability of this resource, our results on ethnic participation support previous observations by Andrew et al. (2000) that fishing is not a traditional activity for all ethnic groups. While all race groups had similar access opportunities to the resource, the proportion of Black African subsistence anglers in the fishery was significantly lower (15%), and of Coloured anglers higher (84%), than would be expected from the ethnic demography of the region (73% Black African, 18% Coloured; Table 1). Accordingly, the same was true for recreational angling which was a White-dominated activity.
The characteristics of the recreational sector differ considerably from the subsistence sector in GDFA, where recreational anglers had a similar age structure to that of the subsistence anglers, but were all employed, while in VSFA recreational anglers were predominantly retirees (> 60 years old). Regional differences in utilisation trends, a common phenomena for recreational fisheries (Arlinghaus and Mehner, 2004), were observed. While most recreational anglers from both regions consumed a portion of their catch, recreational anglers from VSFA never released their catch. In the GDFA catch and release fishing was more common because many anglers in this area were tourists and therefore lacked storage facilities. In the VSFA recreational anglers were resident retirees who could store their catch at home (in freezers or fridges) for later consumption, or who had the contacts to sell it locally to subsidise fuel and fishing tackle expenses. As a result, the VSFA recreational angler differs from subsistence users only in having a source of income (pension) and wealth (indicated by the possession of a vehicle).
Increasingly, the socio-economic benefits derived from inland recreational fisheries, for both anglers and the wider communities, are being recognised (Peirson et al., 2001). The GDFA recreational angler is generally a visitor, residing > 10 km from the resource, who may use the tourism-focused service industry in the settlement. While the estimation of economic benefits from tourism was beyond the scope of this study, visits by recreational anglers undoubtedly contribute to increased income and employment opportunities through related service industries such as guesthouses, hotels and other tourism-related activities.
Conclusion
Increasingly, South African inland water bodies have been identified as vehicles for development (Andrew et al., 2000; Nicolaai and Jooste, 2002; Weyl et al., 2007). The continued existence and expansion of inland fisheries relies on better understanding the multiple needs that fisheries are able to satisfy rather than concentrating on a specific role that they may fulfil, such as economic gain (Wedekind et al., 2001). This is particularly applicable to Lake Gariep where user groups form a heterogeneous mix of recreational and subsistence anglers, races and classes. Of particular importance is the recognition that this inland fishery contributes to the livelihoods of the rural poor who use the lake on a subsistence base. This requires recognising the importance of management and fisheries development plans for the lake. For example, the development of a large-scale commercial fishery may result in competition for market share, which in turn might negatively affect subsistence anglers and their livelihood opportunities. If a commercial fishery was to be initiated, mitigation options to decrease competition with the subsistence sector, such as export-only or preferential purchase from subsistence anglers at current market price, would need to be investigated. Further, if South Africa intends addressing the need to develop an inland fisheries policy (Weyl et al., 2007), subsistence user rights will require similar recognition and entrenchment in policy as afforded to marine subsistence anglers by the Marine Living Resources Act (No. 18 of 1998) and the Draft Policy for the Allocation and Management of Medium Term Subsistence Fishing Rights (DEAT, 2008).
Acknowledgements
This material is based upon work supported by the National Research Foundation of South Africa. Any opinion, findings and conclusions or recommendations expressed in this material are those of the authors and therefore the NRF does not accept any liability in regard thereto. We thank Graham Traas for assistance in the field and James and Helen Carey from the Oviston Nature Reserve for all their assistance and hospitality. We gratefully acknowledge the assistance of the Eastern Cape Parks Board, Free State Nature Conservation andGariep State Fish Hatchery staff. The authors would also like to thank the Free State Province Department of Tourism, Environmental and Economic Affairs for issuing a permit (HK/P1/07871/001) to conduct the research. Two anonymous reviewers are thanked for their valuable inputs.
References
ADKINSON D and MARAIS L (2007) Arid Areas Programme Volume 1: District Socioeconomic Profile and Development Plans. University of the Free State, Centre for Development Support, Bloemfontein. URL: http://www.aridareas.co.za/pdf%20documents/ Volume%201%20-%20%20Economic%20profile%20with%20pictures.pdf (Accessed 5 July 2009). [ Links ]
ANDREW TG, ROUHANI QA and SETI SJ (2000) Can small-scale fisheries contribute to poverty alleviation in traditionally non-fishing communities in South Africa? Afr. J. Aquat. Sci. 25 50-55. [ Links ]
ARLINGHAUS R and MEHNER T (2004) A management-orientated comparative analysis of urban and rural anglers living in a metropolis (Berlin, Germany). Environ. Manage. 33 331-344. [ Links ]
BRANCH GM, HAUCK M, SIQWANA-NDULO N and DYE AH (2002) Defining fishers in the South African context: subsistence, artisanal and small-scale commercial sectors. Afr. J. Mar. Sci. 24 475-487. [ Links ]
BROWN RB and TOTH JF (2001) Natural resource access and interracial associations: Black and White subsistence fishing in the Mississippi Delta. South. Rural Sociol. 17 81-110. [ Links ]
CADIEUX JJ (1980) Freshwater angling in the Transvaal: its environmental and economic impact. S. Afr. J. Sci. 76 492-493. [ Links ]
CAREY H (2008) Estate Agent, Oviston. Personal communication, May 2009. [ Links ]
CERDEIRA RGP, RUFFINO ML and ISAAC VJ (2001) Fish catches among riverside communities around Lago Grande de Monte Alegre, Lower Amazon, Brazil. Fish. Manage. Ecol. 7 355-374. [ Links ]
DEAT (Department of Environmental Affairs and Tourism, South Africa) (2008) Draft policy for the allocation and management of medium term subsistence fishing rights. Government Gazette No. 31707, 12th December 2008. URL: http://www.deat.gov.za (Accessed 27 January 2009). [ Links ]
DORGELOH WG (1994) Diet and food selection of Barbus aeneus, Clarias gariepinus and Onchorhynchus mykiss in a clear man-made lake, South Africa. Water SA 20 91-99. [ Links ]
ELLENDER BR (2009) The impact of angling on smallmouth and largemouth yellowfish, Labeobarbus aeneus and Labeobarbus kimberleyensis, in Lake Gariep, South Africa. M.Sc. Thesis, Rhodes University. 111 pp. [ Links ]
FREE STATE DEPARTMENT OF AGRICULTURE (2009) Xhariep District: District Profile. URL: http://fsagric.fs.gov.za/xhariep.php (Accessed 5 July 2009). [ Links ]
HAMMAN KCD (1980) Post-impoundment trends in the fish populations of the Hendrik Verwoerd Dam, South Africa. J. Limnol. Soc. S. Afr. 6 101-108. [ Links ]
NEILAND AE, JAFFRY S, LADU BMB, SARCH MT and MADAKAN SP (2000) Inland fisheries of North East Nigeria including the Upper River Benue, Lake Chad and the Nguru-Gashua wetlands I. Characterisation and analysis of planning suppositions. Fish. Res. 48 229-243. [ Links ]
NEPAD (2005) The NEPAD Action Plan for the Development of African Fisheries and Aquaculture. – Proc. NEPAD Fish For All Summit. 23 August 2005, Abuja, Nigeria. Elias Modern Press. 27 pp. [ Links ]
NICOLAAI NN and JOOSTE A (2002) A preliminary quantitative assessment of gillnet fishing in subtropical Lake Tzaneen, Northern Province, South Africa. Afr. J. Aquat. Sci. 27 151-157. [ Links ]
PEIRSON G, TINGLEY D, SPURGEON J and RADFORD A (2001) Economic evaluation of inland fisheries in England and Wales. Fish. Manage. Ecol. 8 415-424. [ Links ]
SCHRAMM M (1993) A comparison of Cyprinid fish populations in three large Transkei reservoirs with respect to abundance and reproduction. S. Afr. J. Aquat. Sci. 19 74-88. [ Links ]
SMITH LED, NGUYENKHOA S and LORENZEN K (2005) Livelihood functions of inland fisheries: Policy implications in developing countries. Water Policy 7 359-383. [ Links ]
ST MARTIN K (2001) Making space for community resource management in fisheries. Ann. Assoc. Am. Geogr. 91 122-142. [ Links ]
STATISTICS SOUTH AFRICA (2003) PC-AXIS Files for Subject Area Municipality Level - Persons Stats Online: Statistics South Africa. URL: www.statssa.gov.za/timeseriesdata/pxweb2006/Database/ South%20Africa/Population%20Census/Census%202001%20-%20NEW%20Demarcation%20boundaries%20as%20 at%209%20December%202005/Municipality%20level%20-%20Persons/Municipality%20level%20-%20Persons.asp (Accessed1 July 2007). [ Links ]
TÓMASSON T, CAMBRAY JA and JACKSON PBN (1984) Reproductive biology of four large riverine fishes (Cyprinidae) in a man- made lake, Orange River, South Africa. Hydrobiol. 112 179-195. [ Links ]
WEDEKIND H, HILGE V and STEFFENS W (2001) Present status, and social and economic significance of inland fisheries in Germany. Fish. Manage. Ecol. 8 405-414. [ Links ]
WEYL OLF, POTTS WM, ROUHANI QA and BRITZ P (2007) The need for an inland fisheries policy in South Africa: A case study of the North West Province. Water SA 33 (4) 497-504. [ Links ]
Received 9 February 2009; accepted in revised form 15 July 2009.
* To whom all correspondence should be addressed
+2746 6035834; fax: +2746 6222403
e-mail: o.weyl@saiab.ac.za
Is there a role for traditional governance systems in South Africa's new water management regime?
Farai Kapfudzaruwa; Merle Sowman*
Department of Environmental and Geographical Science, University of Cape Town, Private Bag X3, Rondebosch 7701, South Africa
ABSTRACT
The transition to democracy in South Africa in 1994 catalysed new forms of governance in all sectors of society including water resource management. This paper examines the extent to which traditional governance systems have been acknowledged and incorporated into these new water management institutions and approaches. The research focused on understanding the cultural, religious and customary practices and rules relevant to water resource management as well as the roles of traditional leaders in 2 water user associations in the Eastern Cape Province. Findings from the research reveal that both state governance systems and traditional governance systems are relevant to water resource management in the study areas. However, management is predominantly guided by state-;driven strategies which are based on statutory legal systems. Yet, traditional governance systems, including customary laws and cultural and religious practices, have an important role to play in achieving the purposes of the water user associations. Failure to acknowledge and incorporate aspects of these traditional governance systems may undermine the ability of government to achieve the objectives of the National Water Act.
Keywords: traditional governance systems, cultural, religious, customary practices, water user associations
Introduction
The transition from Apartheid to democracy in South Africa in 1994 resulted in a massive law-;reform process in all sectors of society including water resource management. Water policy and legislation during the Apartheid era were designed to benefit the needs of the dominant communities in society at the expense of the majority of the indigenous population (Tewari, 2001). Under the Water Act of 1956, water was controlled through a riparian system where access to water was tied to the ownership of land. The new legal framework in South Africa focuses on redressing the inequalities of the past by involving users in water resource management and reforming procedures for allocating water (Schreiner et al., 2004). It provides an enabling framework for contributing to poverty alleviation and can be regarded as a tool to enhance social and environmental justice (Schreiner et al., 2004; Van Koppen et al., 2002).
The post-;Apartheid approach to water resource management (WRM) has been guided by global trends that include a shift from supply to demand management, decentralisation of water management decisions and a more integrated and participatory approach to WRM (Franks et al., 2004; Cleaver et al., 2005; Sokile et al., 2003). Fundamental to this new approach is the active involvement of an informed public in the management and allocation of South Africa's scarce water resources. Both the Water Services Act (WSA), No. 108 of 1997 (RSA, 1997), and the National Water Act (NWA), No. 36 of 1998, (RSA, 1998) are based on principles of participation and social justice and contain provisions that require the involvement of citizens in the management of water resources. To achieve this, the post-;Apartheid legal framework on water resource management provides for the establishment of new water management institutions such as catchment management agencies (CMAs) and water user associations (WUAs). These new institutions are required to ensure representation of all water user interest groups in their structures and the management of water resources at a more localised level.
Whilst South Africa's new approach to WRM is considered progressive in terms of international trends and practices (Sokile et al., 2003; Muller, 2000), incorporation of traditional systems of governance including the customary practices and laws relevant to WRM, have been largely overlooked. In a critique of the evolution of water management institutions in Tanzania, Sokile et al. (2003) highlight the problems of ignoring traditional and informal institutions -; especially traditional by-;laws, norms and restrictions. Their research found that village-;based informal institutions are often not formally involved in new water management institutions such as WUAs and they question whether these newly-;created local level management institutions are meeting the expectations of the poorest of the poor. They go on to criticise the failure of efforts to learn from local informal institutions and report that local communities generally prefer traditional conflict resolution approaches (Sokile et al., 2003). They call for a sound mix of formal-;informal institutional arrangements and recommend that the elements of existing local institutions, in particular informal traditional arrangements, should be incorporated into new management systems (Sokile et al., 2003).
From an African perspective, water is not only of social and economic importance, but also of cultural and spiritual significance (Zenani and Mistri, 2005). Indigenous knowledge systems (IKS) used to manage natural resources, mostly transferred through oral tradition from generation to generation, are 'intimately connected to the broader framework of people's cosmology and world view, which is embedded within their physical, spiritual and social landscape' (Hirsch and O'Hanlon, 1995 p. 268). Despite the disenchantment of the physical, spiritual and social landscape of indigenous African people by colonisation, there is still a strong body of religious functionaries, traditional healers (izangomas) and traditional leaders who embrace these cultural and spiritual values. These individuals' services play a crucial role in their communities and in the management of natural resources. Even though the NWA promotes and accommodates the efficient social use of water resources, there seems to be very little understanding on the use of water for cultural and religious activities, the values attached to these uses, and the manner in which these affect management decisions (Zenani and Mistri, 2005). In many rural settings in Africa, water is considered a common pool resource whose access, use and management is usually informed by customary rules that form part of a complex system of traditional governance. These rules may be guided by cultural and religious beliefs and practices and are integral to traditional governance systems.
Historically, in South Africa, traditional leaders were mainly responsible for the management of water resources in their rural communities. However, during the Apartheid era, the roles and powers of traditional leaders were curtailed, and most aspects of decision making concerning water resources were vested in the Apartheid government. The 'homelands' policy was an instrument of the Apartheid government whereby 'black' Africans were forced to move and become citizens of designated rural 'homeland' areas. The Bantu Authorities Act (1951) and the Bantu Self-;Government Act (1959) provided for the establishment and development of 'homelands' in South Africa between 1950 and 1954. In the homelands, where most Africans resided, the homeland government was responsible for managing water resources whilst delegating other responsibilities such as operation and maintenance of water supply systems to government-;controlled water boards (Van Koppen et al., 2002). Although South Africa's new democratic government has recognised the institution of traditional leaders by establishing the national and provincial Houses of Traditional Leaders (HOTL), this paper argues that the state has not provided adequate mechanisms for the consideration of traditional governance systems in the new dispensation for water management in South Africa. The extent to which these cultural practices and customary rules related to traditional water governance systems have been acknowledged and incorporated into new water management institutions and approaches in South Africa, is the subject of this paper. A key focus is on the role of traditional governance systems in WRM in a former homeland area of South Africa where new water management institutions are being introduced.
The paper draws largely on research conducted in the Mzimvubu to Keiskamma Water Management Area (WMA) 12 in the Eastern Cape Province in South Africa during 2007 (Fig. 1). The eDikeni WUA near Alice and Masikhanye WUA which is located 100 km north-;west of King Williams Town, were selected as case study areas within the WMA 12 (Fig. 1). These areas, both former homelands, are in a rural setting, where traditional leaders and cultural practices have played a significant role in the governance and functioning of the community -; especially in natural resource allocation and use since the pre-;colonial era (Turner and Meer, 2001; Meer and Campbell, 2007). The Masikhanye WUA and the eDikeni WUA comprise 8 and 19 villages, respectively. At present the eDikeni WUA has been established whilst the Masikhanye WUA is in the process of being established. Both these WUAs tend to be single-;sector WUAs focusing on water issues related to agriculture.
Research methodology
The paper utilised methodological and investigator triangulation (Denzin, 1970; Jick, 1979; Kimchi et al., 1991) and employed various methods including workshops, transect walks, interviews, review of relevant documents and archival materials as well as field observations. The use of multiple data sources to examine the same dimension of a research problem enhanced the validation process by ensuring that weaknesses inherent in 1 approach were counterbalanced via strengths in another (Denzin, 1970; Jick, 1979). Multiple observers in the research process also enhanced the reliability of the data by comparing data from different individuals for consistency.
At the outset of the research, participatory workshops were held with members of the 2 WUAs, namely Masikhanye and eDikeni, in order to gain information and insights on cultural and religious practices associated with water use as well as the role of traditional governance systems in WRM in the area. A secondary purpose of the workshops was to identify and discuss issues and challenges regarding the process of establishing the WUAs.
In both study areas, transect walks were undertaken with members of the WUAs, in order to identify areas and sites, in or adjacent to water courses, that were considered important in terms of religious and cultural practices. These transect walks were also important in validating the data from the workshops. Following these walks, important sites where cultural practices and religious ceremonies were practised, were demarcated on a map. This information was then discussed and verified with a broader group of WUA participants, including interim WUA committee members, at workshops held in both WUAs.
Semi-;structured interviews were also conducted with key stakeholders involved in water provision and management in the study area. The interviews focused largely on investigating the role played by traditional leaders and other functionaries, customary rules and cultural practices in historic and existing water management institutions in the case study areas. The 1st author also participated in a meeting of the Eastern Cape HOTL and was given an opportunity to ask questions regarding their understanding of, and role in, new water management governance arrangements in South Africa.
The new governance framework for IWRM in South Africa
The advent of democracy in South Africa in 1994 resulted in the formulation of a new Constitution and a massive law-;reform process, including radical changes to the legislation governing water management. The Constitution (Act 108 of 1996) laid the foundation upon which all policies and legislation, including the NWA and WSA were formed. The preamble of the Constitution emphasises the imperative to redress imbalances of the past regarding water resource allocation and management whilst still respecting all citizens' constitutional rights (Glazewski, 2005).
The NWA provides for the reform of water law and places the government as the public trustee of South Africa's water resources to ensure '... that water is protected, used, developed, conserved, managed and controlled in a sustainable and equitable manner for the benefit of all persons and in accordance with its constitutional mandate' (NWA, 1998 s3(1)). The NWA encourages decision makers to be proactive so as to promote the participation of relevant stakeholders. Stakeholder involvement is ensured in the Act by devolving power from national to local level through the establishment of new water management institutions (WMI) such as CMAs which are meant to manage water resources within WMAs. The CMAs will devolve certain responsibilities of management of water resources at the local level to WUAs (NWA, 1998 Chapters 7 & 8).
According to the NWA, CMAs are supposed to manage water resources within the WMAs. Since these WMAs are based on hydrological boundaries, they can cut across the administrative boundaries of provinces and districts. The purpose of establishing the CMAs is to 'delegate water management to the regional or catchment level and to involve local communities within the framework of the national water resource strategy' (RSA, 1998). Each CMA is responsible for the creation of a catchment management strategy (CMS) for their area of jurisdiction, and, ultimately, also to carry out functions such as water resource planning in the catchment, registration, water charge collection, water use authorisation, and licensing.
The CMA will devolve water management activities to WUAs. The WUAs include a group of water users who wish to work together because of a common interest. The purpose of a WUA is to enable water users to cooperate and pool their resources (financial, human resources and expertise) to effectively carry out water-;related activities (RSA, 1998). The functions of the WUAs depend on their constitution and include the following main functions: to conserve water resources; to prevent unlawful use of water; to supervise the use of the water resources in their area of jurisdiction; to investigate water quality and water use; and to construct, operate and maintain waterworks for draining land and supplying water. The National Water Resource Strategy (NWRS) of 2004 outlines the key strategies, objectives, plans, guidelines and procedures for implementing the provisions under the NWA (RSA, 2004a).
The law reform process in South Africa also led to the promulgation of the Water Services Act (No. 108 of 1997) which provides the rights of access to basic water and sanitation as well as the right to institutional structures responsible for providing water. The main goals of this Act are to establish the norms and standards for tariffs with regards to water provision, provide financial assistance to water service institutions and promote effective water resource management and conservation (Glazewski, 2005). In addition to the CMAs and the WUAs, the NWA provides for different water management institutions at different levels (Fig. 2). The rationale behind setting up these institutional structures is to create a more equitable and participatory system of water use and management.
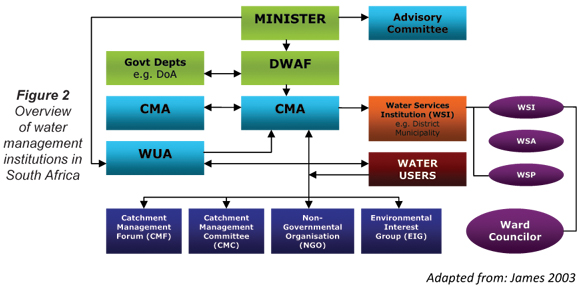
The Minister of Water and Environmental Affairs (formerly the Minister of Water Affairs and Forestry) has the overall responsibility for effective water management in South Africa. The Department of Water Affairs (DWA) (formerly the Department of Water Affairs and Forestry (DWAF)) is responsible for carrying out all aspects of the NWA delegated to it by the Minister. DWAF's overall focus is on managing the national water management policy and ensuring that all water management institutions are performing their roles and responsibilities effectively. As outlined in Fig. 2, a wide array of institutions is involved in implementing the IWRM approach. This new institutional framework places great emphasis on the establishment of new institutions and laws, and does not make reference to the incorporation of customary laws or existing formal and informal institutions that play a role in water management.
Role of traditional authorities in water resource management (WRM) – past and present
Prior to colonisation and Apartheid in South Africa, traditional systems of governance characterised most forms of administration and governance in rural communities (RSA, 2003; Turner and Meer, 2003). Traditional leaders were responsible for managing natural resources such as water and administering other functions such as mediating conflicts and allocating land. These functions were mainly informed by cultural practices and customary rules.
During Apartheid, the homeland government held decision-;making powers for most aspects of water management but delegated certain responsibilities to traditional chiefs (Van Koppen et al., 2002). Within the rural communities, chiefs/chieftainesses and their headmen were the main contact persons for the homeland government and any other outsiders intervening in issues concerning water supply facilities. Specific tasks, such as the operation and maintenance of water supply systems were usually delegated to members of the tribal council, who then formed relevant committees in the villages (Van Koppen et al., 2002). However, during the Apartheid era, many of the traditional leaders were co-;opted by the state or corrupted into furthering the aims of the Apartheid government (Turner and Meer, 2001). The ongoing dislocation of people and social engineering that occurred during the Apartheid era disrupted traditional forms of governance and customary law (Hauck and Sowman, 2003). In many instances the traditional authorities were viewed as agents of the state (Shackleton et al., 1998; Turner and Meer, 2001) facilitating the execution of Apartheid policies and laws. However, despite the erosion and corruption of these traditional institutions, customary values and practices have persisted and in some areas traditional institutions and management systems are still functional and respected.
In terms of the new legal framework governing IWRM in the democratic South Africa, the role of traditional leaders is unclear. As is the case with all the provinces in South Africa, the Eastern Cape has established a provincial HOTL which is responsible for 'dealing with matters concerned with traditional leadership, the role of traditional leaders, customary law and the customs of the community' (RSA, 1996). The kings/queens and chiefs/chieftainesses are the senior traditional leaders and their positions can only be occupied through inheritance. The headmen and sub-;headmen are elected and are mainly responsible for monitoring activities in the community and giving feedback to the chief/chieftainess.
There are, however, no mechanisms set up to explicitly recognise traditional governance systems in the new democratic system. Despite the fact that traditional leaders are recognised by the South African Constitution (Sections 211-;212), their authority and powers in terms of water management are not augmented by legislation. The NWA does not explicitly recognise customary water management structures, practices and laws (Malzbender et al., 2005). Furthermore, according to Section 211(2) of the Constitution, the legislature is entitled to repeal existing customary law used by traditional leadership and amend it or replace it by statutory legislation. This establishes the superiority of statutory law.
Findings
Diminished role of traditional leaders in WRM
Findings from this research suggest that the authority of traditional leaders in terms of water management since the pre-;colonial era has been eroded. More than 75% of the representatives of the Eastern Cape HOTL acknowledged that they were not aware of and informed about the current developments in water resource management in South Africa. Water service authorities (WSAs), water service providers (WSPs) and other state agencies such as DWA (formerly DWAF) and the Department of Agriculture (DoA), have now assumed authority in terms of water provision and management in the Eastern Cape Province. This was confirmed by interviews with representatives from government and water management agencies during the study. Since July 2003, DWAF (now DWA) has allocated responsibility for water service provision and different aspects of water management to municipalities such as the Amathole District Municipality in the Eastern Cape. In the study area, Amatola Water, a private parastatal established in 1997 by the Minister of Water Affairs, is mandated by DWA to provide potable water to the municipalities. There is no legal obligation in the legislation that requires traditional leaders to be involved in management activities and decisions regarding water management. The Traditional Leadership and Governance Framework Act of 2003 only seeks to 'promote' partnerships between municipalities and traditional leaders. These partnerships are based on principles of mutual respect and are not legally binding (RSA, 2003). However, there is little evidence to suggest that such partnerships exist or are being formed.
Most provincial government departments in the Eastern Cape, as well as DWAF, DoA and officials involved in WSAs and WSPs, were of the opinion that traditional leaders do not have an influential role to play in water management even though they are important stakeholders. However, senior officers at the DWAF regional office acknowledged that traditional leaders had a role to play but that regional DWAF offices were waiting for the national government to develop strategies and provide guidelines to incorporate traditional leaders in water management institutions.
Based on work undertaken in Ghana, Ray (1996) argues that traditional leaders derive their legitimacy and authority from pre-;colonial roots while the contemporary African state is a creation of, and successor to, the imposed colonial state. Because the state and traditional leaders derive their authority and legitimacy from different sources, their sovereignty and legitimacy in the post-;colonial state is divided (Ray, 1996). Therefore, the structure and values of the 2 governance systems are in conflict which makes it difficult to bring them together (Ray, 1996; Meer and Campbell, 2003).
The HOTL in the Eastern Cape expressed the view that traditional leaders were not aware of the new water management policies and strategies developed in the late 1990s, or the requirement to establish new water management institutions such as CMAs and WUAs. It is worth noting that to date, only 1 fully functional CMA has been established, the Inkomati CMA (established in 2004). Therefore, the reason why most traditional leaders in the Eastern Cape are not aware of this process could be that the process of establishing these CMAs and WUAs is still in its infancy in many areas in the Eastern Cape.
The role of traditional leaders in WUAs
DWAF, with the assistance of the DoA, has largely been responsible for driving the process of establishing the WUAs in the Eastern Cape. Information gleaned from interviews and workshops found that traditional leaders participated in the public participation processes to inform the community about the requirement to set up a WUA for both eDikeni and Masikhanye, but they did not play any major part in the WUA establishment process thereafter. The management and institutional functioning of the WUAs is regulated by the constitution of the WUA and Section 92 of the Water Act which do not explicitly recognise a role for traditional leaders. Each WUA has a different constitution which may identify varying responsibilities for the traditional leaders depending on their influence within the local community. Discussions with members of the Masikhanye WUA indicated that the traditional leaders did not have any influential part to play in the establishment or operation of the WUA. However, in eDikeni, traditional leaders were consulted during the setting up of the WUA – especially with regard to access to land for the farmers. As part of the WUA constitutional requirement, the traditional leaders had representatives serving on the WUAs. However, the representatives of the traditional leaders do not have voting powers in the WUA committees which means that they have no influence in the decision-;making process.
Discussions held with resource users and other stakeholders in the case study sites, revealed that the communication between the traditional leaders and the communities generally appears to be strong. The Burnshill headman in the Masikhanye WUA reported that they still conduct imbizos (community meetings) in association with the South African National Civic Organisation (SANCO). The imbizos are an important forum for information dissemination about general issues affecting the community. Thus, the traditional leaders are aware of the community needs in terms of water resources and they have the ability to convey the concerns and needs of the people to relevant structures. Several resource users stated that the roles and responsibilities of the traditional leaders need to be reinforced in the WUA committees so that their role as community advocates is strengthened so as to ensure that water management strategies meet community needs. However, in order for traditional leaders to fulfil this role they will need to be involved early in the process, including in the design of water management strategies and institutions so as to avoid contradictions between the structure and values of the state governance system and the traditional governance system. A further issue raised in this regard was the need for traditional leaders to be informed about the general principles and approaches underpinning the new water management regime, so that their input can be from an informed position.
Members of the HOTL in the Eastern Cape confirmed that traditional leaders still play an influential role in mediating conflicts through customary law. This claim was substantiated by inputs and stories from community members during the workshops and transect exercises. In most cases the main source of conflict relates to access to land and water resources. As was raised in the eDikeni workshop, the expectations for WUA farmers to develop farming-;related business plans could culminate in conflicts related to land ownership and access as the farmers were trying to maximise the potential of their land. Conflicts related to land access and ownership mainly occurred in the villages due to lack of clarity regarding land-;tenure systems in the communal lands.
At present, traditional leaders are still actively involved in land allocation in many villages surrounding the study area in collaboration with government agencies including the DoA, the Department of Public Works and local municipalities. The DoA is assisting farmers to monitor and manage land in the Zanyokwe Irrigation Scheme under the Masikhanye WUA. Since land tenure in rural communities is rooted in value systems, religious, social, political and cultural antecedents which are implemented by traditional leaders, it is important to have cohesion between traditional governance structures and government structures concerned with land distribution (Bernard, 2003).
A traditional leader at the HOTL reported that traditional leaders felt that their powers in terms of land distribution will be further diminished by the recently promulgated Communal Lands Rights Act, Act 11 of 2004 (RSA, 2004b) which requires that, in the Land Administration Structure Committee, members of a traditional council represent 60%, whilst other stakeholders such as municipalities hold 40%. Despite acknowledging that this system is a formal way of distributing land, other traditional leaders feel that they will not be able to uphold customary practices of land tenure. Since the land tenure system is now state driven, many traditional leaders in the HOTL, as well as elderly people participating in workshops, argued that the influence of traditional governance systems in land distribution would be diminished. In some villages around the Masikhanye WUA, there are reports that some ward councillors are involved in land allocation. This suggests that there are overlapping responsibilities between ward councillors and traditional authorities. The roles and responsibilities of traditional leaders and that of newly-;elected political leaders are not clearly defined, resulting in conflicts.
However, it should be acknowledged that there are certain inherent responsibilities and characteristics of traditional leaders which cannot be recognised within the state system. In many cases traditional leaders are respected within the community and are an important medium of communication, a role which cannot be assumed by the state because of the level of trust that exists between the community and traditional authorities. More so, the traditional knowledge possessed by state representatives is often incomparable with that of traditional leaders because traditional leaders are inherently intertwined with the socio-;cultural system of a particular community. At a WUA meeting in the study area, it was observed that the ward councillor answered most concerns regarding community development issues whilst the chieftainess was a passive delegate. Some community members interviewed were of the opinion that since the ward councillors belonged to a political party they had more political influence than the traditional leaders. However, in other areas, for example in Burnshill village in the Masikhanye WUA, the chieftainess and the ward councillors worked together when allocating land and access to water sources.
In terms of the new WRM dispensation, water users are required to acquire licences. Many participants taking part in the transect exercise reported that in most cases where land is privately owned, access to water sources for cattle and the general public has been limited because access points are usually fenced. Thus, access to water by users in the communal areas is determined by the land-;ownership system. This confirms the fact that land and water issues are intimately connected. Therefore, water management requires a holistic and integrated approach that incorporates other natural resources and is cognisant of traditional governance systems.
Cultural and religious practices relevant to water management
Many traditional communities have lost knowledge about their cultural and traditional practices and many, especially the youth, have repudiated them in favour of modern ways of living (EEU, 2007). These transformations, as well as the influence of western education systems, have led to behavioural changes, which have resulted in the abandonment of traditional ecological knowledge that is no longer relevant to many rural communities (Bernard, 2003). However, there were cultural and religious practices identified during the fieldwork and workshops which are still relevant to water management.
Cultural and religious practices such as baptism and initiation ceremonies are still practised in the villages covered by the 2 WUAs. It was reported by participants at the Masikhanye WUA workshop that there was an initiation school for girls at Burnshill village (Fig. 3). Baptisms and initiations were usually practised in the water along rivers such as the Keiskamma River. Participants reported that the Zionist priests baptised the devotees in the river whilst an elderly woman in the village was responsible for the initiation ceremonies. However, there were no specific sites which were designated for baptism and initiation ceremonies. A Zionist priest who baptised devotees reported that they chose the deepest part along a river for baptism. There was no evidence of restricted access to these sites.
Research participants also revealed that water plays a crucial role in the expulsion of evil spirits, curing illnesses and removing bad luck. Thus water plays an important role in the belief systems of certain individuals in the community. Water represents nourishment of both the body and the spirit (Zenani and Mistri, 2005). Even though the Water Act does not intend to disrupt religious and cultural practices, since WUAs will be accessing and using raw water along rivers which are also used for religious and cultural practices, it is crucial that these practices are acknowledged by local management structures so as to avoid disturbance of the socio-;cultural fabric of these communities. Representatives from the HOTL indicated that many Zionist priests in the Eastern Cape now use the oceans for baptisms, probably because the water along rivers is polluted.
In research carried out by Fox (2005) in the Kat River Valley in WMA 15 which is adjacent to WMA 12, 92% of the 44 respondents interviewed revealed that they are still practising traditional rituals which are linked to water. Over 80% of the respondents had performed traditional rituals in the past 2 years. The traditional communities believe that water is owned by God; therefore, everyone has a right to access it. The most commonly cited reason for the practice of these rituals was that it was an act of obedience and respect to their ancestors. However, in villages in the Mashikanye and eDikeni WUAs there was evidence that cultural practices and values were eroding. Modern forces have contributed to the 'disenchantment of the landscape' whereby respect for the spirits has rapidly disappeared (Bernard, 2003). The proximity to urban areas such as King Williams Town and Alice could be resulting in modern practices and behaviours infiltrating traditional ways of life.
Fox (2005) also reported that in the Kat River area the sacred pools are considered dangerous as they can result in drowning, especially if the river gods are angered. The participants at the Mashikanye WUA workshop reported that people do not grieve when this happens because they know the ancestors have been angered. Therefore, they have to perform certain rituals to appease them and retrieve the drowned body. Fox (2005) received inter alia the following responses when she asked respondents what would happen if the sacred pools were destroyed: 'It meant that the ancestors would be homeless'; 'We could be mentally ill. People could be mad'; and 'It means that our culture is dead' (Fox, 2005 p. 56).
Participants in the Masikhanye workshop reported that traditional healers continue to play a significant and influential role in the community. For example, the traditional healers conduct ceremonies at certain sites along the Keiskamma River, where they believe that the water spirits are present (Fig. 3). There are occasions when the traditional healers and their followers will spend days at these sites, communicating with the water spirits. The participants noted that there is a belief that if anyone disappears at certain sites where the water spirits are believed to exist, the villagers and family members are not allowed to grieve. They believe that the water spirits are imparting knowledge and skills to the individuals in healing. Near these water sites, there are certain plants which can be identified and used for healing purposes by traditional healers. Hence, it is important to consider these indigenous beliefs and practices in river management as they contribute to the community spiritual life and should be incorporated in management decisions relevant to the conservation and protection of the water resources.
Customary rules and water management
It is important that new water management institutions seek to understand how water is accessed, used and managed by traditional communities so that they can align the new institutions with informal institutions and practices that reflect community needs and way of life. A chief from HOTL explained that the river is divided into sections which have different water uses. The upstream section of a river may be used for drinking purposes, whilst the middle section of a river could be used for laundry and bathing, and the downstream section for cattle. Therefore, when farmers in the WUA abstract water for irrigation they should consider such traditional cultural practices so as to avoid polluting water sources which are used by others for drinking purposes. Even though most villages access drinking water from communal taps, there are some villages which still access drinking water from the river using buckets and fountains.
The research also revealed that cultural norms and values within a certain village did not necessarily coincide with those of an adjacent village. Most villages do not seem to coordinate their activities when devising rules in terms of access to and use of water along a river. One traditional leader from the HOTL acknowledged that their source of drinking water could be polluted by another village located upstream. A princess from Eastern Pondoland reported that when a member of the royal family dies, the family members will go at night and wash his/her clothes in a river far away from the village to turn away bad spirits. The lack of coherence between villages with regard to informal rules and cultural values could impact on water quality and be a potential source of conflict. Moreover, such inconsistencies could present challenges and difficulties in integrating traditional systems with modern state governance systems.
Dolsak and Ostrom (2003) argue that common pool regimes are sustainable when rules are created by a resource management group and regulated by them. Most villages in the study area access their water for domestic use from taps and boreholes. In relation to taps, the villages have informal rules, which are meant to curb the problem of pollution of groundwater and excessive use of water. In most villages which have taps, it is forbidden to wash clothes and dishes at the tap. People are required to fetch water using a container, and do the washing away from the water source. In many villages, stands are erected to avoid spillages. Containers with wide openings are also discouraged as opposed to containers with narrow openings because water could spill. Responses from women using the taps indicate that there are informal rules operating with respect to water management. For example, women acknowledge that doing laundry at the tap will leave the surrounding area soaked with water which will be polluted with detergents. Furthermore, when the area is soaked with water, cattle tramp on the surrounding area to drink water resulting in an unhealthy environment. In certain villages, the Amathole District Municipality is coordinating village water committees (VWC) which enforces some of these informal rules to promote effective management of potable water. This is evidence that informal or customary rules continue to play a role in conservation and management of water resources.
Despite the fact that modern technology (e.g. water quality testing) is frequently used to monitor and manage water sources, in certain villages traditional practices are still used to monitor and manage water sources. One traditional leader from the HOTL stated that in his village he would delegate tasks to households to monitor and preserve a fountain. The families usually practise a process called u kapa (clearing the pond) which involves the removal of mud, resulting in the enlargement of the size of the resource, which in turn increases its water-;holding capacity. Part of the responsibility involves protecting the fountain from cattle, usually by fencing it off with tree branches. The responsibility to manage the fountains will rotate among families in a village. Other cultural practices are aimed at maintaining water quality at drinking water fountains. For instance, a drinking water fountain must be approached barefoot because it is believed that footwear will pollute the water. Similarly, only properly cleaned vessels are to be lowered into the well. One elderly man noted that in the Xhosa tradition, it is believed that if you use a dirty vessel to collect water from a well you will scoop up a snake. Multipurpose sources, such as washing and bathing are supposed to be performed at a distance so that wastewater does not spill over or drain into the water source. Such practices are inculcated in children through the process of socialisation early in life. These customary rules are thus still prevalent and contribute to promoting improved water quality and should be formally integrated into new local water management systems.
Discussion and conclusions
The findings from this research reveal that both state and traditional governance systems are relevant to water management in the study area although the former is clearly the dominant system. Water management in South Africa is essentially guided by state-;driven policies and strategies which are based on statutory legal systems. However, many rural areas in South Africa have plural legal systems and customary rules still apply. Land and water resources are thus regulated by different legal provisions and institutions, including statutory and customary law.
In terms of current policy frameworks and legislation governing water resource management in South Africa, the new institutional dispensation of devolving aspects of water management to the local level through CMAs and WUAs is concerned with improving service provision and demand management. On the other hand, the traditional governance systems have a common pool resource management function which involves decision-;making based on community-;established rules and social and cultural practices to control access to, use and ownership of water resources. While these new WMIs actively seek to involve local resource users and key stakeholders in water management decisions through consultation and representation on boards and associations, the overriding purpose of these institutions is to implement state water policy and law. Although these forums do provide an opportunity for traditional leaders to participate, there is no explicit requirement that relevant indigenous local knowledge and customary practices and rules be considered in the formulation of new local level management systems. Thus the extent to which these traditional knowledge and governance systems are incorporated into new management structures and systems is largely dependent on the individuals driving the process and their recognition of the potential value of incorporating this knowledge, customary practices and rules.
Water is a common pool resource that requires joint management and decision making as neither the state, private sector nor the local communities can effectively manage water alone (Meinzen-;Dick et al., 2006; Baland and Platteau, 1996). Integrating the dominant state-;driven and the community-;based common pool system will definitely present challenges to policy makers as the systems could potentially clash. Traditional leaders derive their legitimacy and authority from pre-;colonial roots while the contemporary African state is a creation of, and successor to, the imposed colonial state (Ray, 1996). The tension is reinforced by other dualities at the local level, for example the role of the state through its governance structures such as government departments, municipalities and political structures.
Our research suggests that there seems to be limited space in these new WMIs at the local level for the application of customary rules because most of the individuals who are responsible for the implementation of the WUAs are answerable to state institutions such as DWA and district municipalities. Hence, if new water management institutions do not engage with traditional governance systems, these new institutions are likely to marginalise and replace these customary systems which contribute to water resource management objectives. The repercussions of this could be negative for marginalised villagers who are more acquainted with indigenous knowledge systems and customary laws found within traditional governance systems. Multiple users of common pool resources such as water often have a shared understanding of who should use resources, how and when such resources should be used, and how much of the resource can be used. These arrangements are often lost in tenure reforms, such as privatisation of water resources through licences, because such conditionalities are seen to increase transaction costs and thus hinder the redistribution of property rights (Meinzen-;Dick and Nkonya, 2005).
This research indicates that remnants of traditional governance systems concerning water management obviously still play a potentially important part in the way people think and act in regard to the use of water resources. Moreover, traditional leaders are still playing an important role in their communities mainly with respect to conflict resolution and land allocation. Given that decisions regarding access to and use of land are integrally linked to water allocation systems, an understanding of these traditional systems should contribute to a more integrated and relevant management system. Traditional management systems may also be effectively used for water management because they are localised (e.g. chiefs and headmen) as compared to conventional systems which require many more resources to penetrate to the local level.
It will be beneficial for local water users if WUAs build upon the indigenous institutions that have been managing access to and use of the water resources in the rural communities. Furthermore, most rural communities tend to be familiar with and understand the customary laws better than the new water management strategies because the customary laws relate to their belief systems and their day-;to-;day interaction with water. In customary law and practice, water is treated as a god-;given common pool resource that all are entitled to use and cannot be owned individually (Bernard, 2003). However, under state governance water is treated as an economic good where individuals have to pay for the resource. This is an indication that rights to water resources under customary law are fundamentally different from the requirements of statutory law. As evidenced in the study area, customary laws play a role in determining access to and use of natural resources and resolving management conflicts. Hence, it is possible that neglect of customary laws may cause IWRM implementation efforts to fail, or may have a negative consequence for individuals and groups who were better served by customary-;based systems (NRI, 2004). Moreover, if customary laws are acknowledged and incorporated into the current legal framework for WRM, there is likely to be greater community support for enforcement of these laws. Thus there is a need for understanding and coherence between the customary beliefs and laws and the state-;driven systems.
Traditional governance systems, including customary laws and cultural and religious practices thus have an important role to play in achieving the dual purposes of the WUAs. The WUAs provide a mechanism for water demand management but also nurture a common pool regime for resource management at a local level. These are potentially conflicting aims and policy makers need to be aware of the confusion that may result at local level amongst stakeholders as a result of this. This is mainly because the structures and values of common pool resource regimes such as traditional governance systems and state-;driven systems are different. Therefore, the challenge is to decide on how, and the extent to which, traditional leaders and existing customary rules and practices and indigenous knowledge systems can be incorporated into the new water resource management systems in South Africa. Failure to acknowledge and incorporate aspects of these traditional governance systems may undermine the very purpose of the Act, namely to facilitate access to water for productive purposes for the poor, through establishment of new water management institutions and equitable allocation of water resources.
Acknowledgements
We would like to gratefully acknowledge the financial assistance of the Water Research Commission (WRC) in South Africa which provided funds to conduct the research. We are also grateful to the Department of Water Affairs (DWA) and to staff members of the Department of Agriculture (DoA) in the Eastern Cape Province who assisted in co-;ordinating the field work in the case study areas. We also extend thanks to the following groups and individuals for their useful information and insights: Members of the House of Traditional Leaders (HOTL) in the Eastern Cape, traditional leaders in the study area, members of the eDikeni and Masikhanye Water User Associations and local communities in the study areas.
References
BALAND J and PLATTEAU J (1996) Coordination problems in local level resource management. J. Dev. Econ. 53 197-;210. [ Links ]
BERNARD P (2003) Ecological implications of water spirit beliefs in Southern Africa: The need to protect knowledge, nature and resource rights. USDA Forest Service Proc. RMS 27 148-;153. [ Links ]
CLEAVER F, FRANKS T, BOESTEN J and KIIRE A (2005) Water Governance and Poverty: What Works for the Poor? University of Bradford, Bradford. URL: http://www.bradford.ac.uk/acad/bcid/research.wgp (Accessed on?) [ Links ]
DENZIN NK (1970) The Research Act: A Theoretical Introduction to Sociological Methods. Aldine, Chicago. [ Links ]
DOLSAK N and OSTROM E (2003) The Commons in the New Millennium: Challenges and Adaptation. MIT Press, London. [ Links ]
ENVIRONMENTAL EVALUATION UNIT (EEU) (2007) Institutional Dimensions of Water Resource Management in South Africa: Socio-;Cultural Perspectives. Draft unpublished report. Environmental Evaluation Unit, University of Cape Town, Cape Town. [ Links ]
FOX HE (2005) The Role of Anthropogenic Disturbance in the Creation of a Socio-;Ecological Landscape. Unpublished Masters Thesis, Rhodes University, South Africa. [ Links ]
FRANKS T, TONER A, GOLDMAN I, HOWLETT D, MUHUMUZA F, KAMUZORA F and TAMASANE T (2004) The Institutional Impacts of Adopting a Livelihoods Approach to Managing Development Interventions. Bradford Centre for International Development, Bradford. URL: http://www.bradford.ac.uk/acad/bcid/research/poverty/projects/goodbye/papers/ [ Links ]
GLAZEWSKI J (2005) Environmental Law in South Africa (2nd edn.). LexisNexis Butterworths, Durban, South Africa. [ Links ]
HAUCK M and SOWMAN M (2003) (eds.) Waves of change: Coastal and Fisheries Co-;Management in Southern Africa. University of Cape Town Press, Cape Town, South Africa. [ Links ]
HIRSCH E and O'HANLON M (1995) The Anthropology of Landscape: Perspectives on Place and Space. Clarendon Press, Oxford, UK. [ Links ]
JICK TD (1979) Mixing quantitative and qualitative methods: Triangulation in action. Adm. Sci. Q. 24 (4) 601-;611. [ Links ]
KIMCHI J, POLIVKA B and STEVENSON JS (1991) Triangulation: Operational definitions. Nurs. Res. 40 (6) 364-;366. [ Links ]
MALZBENDER D, GOLDIN J, TURTON A and EARLE A (2005) Traditional water governance and South Africa's National Water Act – tensions or cooperation. Proc. Plural Legislation Frameworks for Rural Water Management in Africa. 26-;28 January 2005, Johannesburg, South Africa. International Water Management Institute (IWMI). [ Links ]
MEER T and CAMPBELL G (2004) Traditional leadership in democratic South Africa. Democracy Development Programme, Durban. [ Links ]
MEINZEN-;DICK R, MWANGI E and DOHRN S (2006) Securing the Commons. Policy Brief Number 4. International Food Policy Research Institute (IFPRI), Washington, USA. [ Links ]
MEINZEN-;DICK R and NKONYA L (2005) Understanding legal pluralism in water rights: Lessons from Africa and Asia. Proc. Plural Legislation Frameworks for Rural Water Management in Africa. 26-;28 January 2005, Johannesburg. South Africa. International Water Management Institute (IWMI). [ Links ]
MULLER A M (2000) How national water policy is helping to achieve South Africa's development vision. In: Abernethy CL (ed.) Intersectoral Management of River Basins. International Water Management Institute (IWMI), Sri-;Lanka. [ Links ]
NATURAL RESOURCES INSTITUTE (NRI) (2004) Guidelines for Catchment Managers: Building upon Customary Practices in Implementing IWRM in Africa: Good Practice Guidelines for Water Managers. Natural Resources Institute (NRI), University of Greenwich at Medway, UK. [ Links ]
RAY ID (1996) Divided sovereignty: Traditional authority and the state in Ghana. J. Leg. Pluralism & Unofficial Law 37/38 181-;202. [ Links ]
REPUBLIC OF SOUTH AFRICA (RSA) (1996) Constitution of the Republic of South Africa (18 of 1996). RSA, Pretoria, South Africa. [ Links ]
REPUBLIC OF SOUTH AFRICA (RSA) (1997) Water Services Act (108 of 1997). RSA, Pretoria, South Africa. [ Links ]
REPUBLIC OF SOUTH AFRICA (RSA) (1998) National Water Act (36 of 1998). RSA, Pretoria, South Africa. [ Links ]
REPUBLIC OF SOUTH AFRICA (RSA) (1999) Draft: Water Conservation and Demand Management National Strategy Framework. Department of Water Affairs and Forestry, Pretoria, South Africa. [ Links ]
REPUBLIC OF SOUTH AFRICA (RSA) (2003) White Paper on Traditional Leadership and Governance. Department of Provincial and Local Government, Pretoria, South Africa. [ Links ]
REPUBLIC OF SOUTH AFRICA (RSA) (2004a) The National Water Resource Strategy. Department of Water Affairs and Forestry, Pretoria, South Africa. [ Links ]
REPUBLIC OF SOUTH AFRICA (RSA) (2004b) Communal Land Rights Act (11 of 2004). RSA, Pretoria, South Africa. [ Links ]
SHACKLETON SE, VON MALTITZ G and EVANS J (1998) Factors, conditions and criteria for the successful management of natural resources held under a common property regime: A South African perspective. Occasional Paper No. 8, Programme for Land and Agrarian Studies (PLAAS), University of the Western Cape, Cape Town. [ Links ]
SCHREINER B, MOHAPI N, VAN KOPPEN B (2004) Washing away poverty: Water democracy and gendered poverty eradication in South Africa. Nat. Resour. Forum 28 (3) 171-;178. [ Links ]
SOKILE CS, KASHAIGILI JJ, KADIGI RMJ (2003) Towards an integrated water resource management in Tanzania: The role of appropriate institutional framework in Rufiji Basin. Phys. Chem. of the Earth 28 1015-;1023. [ Links ]
TEWARI DD (2001) An analysis of evolution of water rights in South African society: An account of three hundred years. Proc. The Role of Water in History and Development. 10-;12 August, 2001. Bergen, Norway. International Water History Association. [ Links ]
TURNER S and MEER S (2001) Conservation by People in South Africa: Findings from TRANSFORM Monitoring and Evaluation, 1999. Research Report No. 7. Programme for Land and Agrarian Studies (PLAAS), University of Western Cape, Cape Town. [ Links ]
VAN KOPPEN B, JHA N and MERREY DJ (2002) Redressing racial inequities through water law in South Africa: Interaction and contest among legal frameworks. In: Pradhan R (ed.) Legal Pluralism and Unofficial Law in Social, Economic and Political Development. Proc. XIIIth International Congress of the Commission on Folk Law and Legal Pluralism. 7-;10 April 2002, Chiang Mai, Thailand. Volume 2: International Centre for the Study of Nature, Environment and Culture, Kathmandu, Nepal. pp. 201-;219. [ Links ]
ZENANI V and MISTRI A (2005) A Desktop Study on the Cultural and Religious Uses of Water using Regional Case Studies from South Africa. Department of Water Affairs and Forestry , Pretoria, South Africa. [ Links ]
Received 15 September 2008; accepted in revised form 14 August 2009.
* To whom all correspondence should be addressed.
+2721 6502866; fax: +2721 6503791;
e-;mail: Merle.Sowman@uct.ac.za
A detailed analysis of evolution of water rights in South Africa: An account of three and a half centuries from 1652 AD to present#
DD Tewari*
School of Economics and Finance, University of KwaZulu-Natal, Westville Campus, Durban 4001, South Africa
ABSTRACT
This study reviews the changing scene of water rights in South Africa over the last three and a half centuries and concludes that they have come full circle, with some modifications, since the invoking of Dutch rule in the Cape in 1652 AD. The study stipulates that adoption of a modern rights structure is a welcome change and a progressive step taken by the democratic government; however, its success depends to a great extent on the institutional efficiency of the state which performs the role of trustee or custodian of the water resource. The responsibilities of trusteeship with respect to managing water rights or permits are met through a decentralised decision-making system. The management of water rights/permits thus depends on the administrative and judicial efficiency of organisations and government departments. Therein lurks the danger of corruption, bureaucratic inefficiency, and insecurity of permits, and hence enough potential to stifle the long-term incentives to invest in the water sector.
Keywords: water rights, riparian, dominus fluminis, appropriation, modern water rights, sustainability, South Africa
Introduction and objectives
The availability of water in the South African context has more or less remain unchanged as it depends on climatic factors which have not changed, at least within the last 10 000 years (DWAF, 1986). The current research on climate change confirms that it has the potential to impact very significantly on both the availability of and requirements for water in South Africa (DWAF, 2004, p.50). The average annual rainfall in South Africa is about 450 mm/yr, well below the world average of about 860 mm/yr, and this rain falls mostly on the east coast with very little in the interior parts (DWAF, 2004 p.50). Water consumption in the country is growing rapidly as industrialisation and urbanisation surges ahead. Since demand is exceeding the supply, South Africa is now being classified as one of Africa's water-stressed countries (DWAF, 2004 p.15). The evolution of water laws and consequent development/change in the nature and structure of water rights in South Africa is intricately related to the increasing demand for water and political scenes that have unfolded in the country over the last three and a half centuries. The worldwide movements for environmental and human rights have also precipitated various reforms in the last decade of the 20th century, affecting water laws and rights in various countries. Historically speaking, the development of water laws in South Africa is woven with fabric of both economic and political colours and should be understood within the context of conquest and colonisation. As the country changed hands from the Dutch to the British and then to the Afrikaners, and very recently to a democratic government representing all ethnic groups in the country, so did the water laws and emanating water rights (Tewari, 2005).
Knowledge of the changing nature of water laws and associated rights can enhance the understanding of policy- and law-makers in South Africa and elsewhere, especially in other countries of sub-Saharan Africa as these countries have arid climates and their water problems are of similar nature. An understanding of the issues of water rights under arid or semi-arid conditions as distilled from this analysis can also be useful to lawmakers in other arid parts of the world. The study conduces a comprehensive understanding of evolution or transformation of water rights during 350 years in South Africa and enlightens how the changing legal philosophy of the ruling class has produced a different sets of water rights over the years. The evolution of water rights is thus discussed within 4 broad periods:
- The pre-colonial period under African customary rule
- Dutch East India Company (Vereenigde Oost Indiese Companje, VOC) rule spanning from 1652 to the 1st decade of the 19th century (1810)
- The colonial period under British control followed by apartheid rule by Afrikaner nationalists from about 1810 to 1990
- Democratic (modern) rule from 1991 to the present.
The major purpose of the study is to highlight the water management issues and social and economic forces that drove the development of different water rights in the country as it moved forward from medieval to modern times. More specifically, the study focuses on the modern water rights regime that has been developed under the democratic government. The intent is to examine how the modern rights will fare and what sort of constraints can stifle the materialisation of their full impacts.
The material of this study is thus organised into 8 sections. The 2nd section delineates a brief overview of doctrines of water rights in general. The next sections deal with the evolution of water rights under, respectively, African customary law, Dutch, British, and Afrikaner nationalist laws. Finally, modern water rights under the current democratic rule are discussed. Conclusions and major lessons garnered from this study are discussed in the last section.
A brief overview of prevailing water rights doctrines
The need to regulate and control the supply of, and demand for, water by policy measures is necessitated by the need to supply the resource on sustainable basis to all users. One of the important factors in allocating or creating water rights is the climate. Even cultural advancement is considerably influenced by climatic conditions. Hall argued that:
'Climatic and geographical conditions are therefore of the greatest importance when questions of water rights come to be considered. If there is a scarcity of water the efforts of the community will be directed towards conserving the water and those of the individual to obtaining as much of it as he can for himself. If there is a superfluity of it the inhabitants will be occupied with efforts to get rid of it by drainage and canalisation, and they will make strenuous efforts to add to their land by reclaiming new areas from inundation (Hall, 1939 p.7)'.
The objective of granting water rights is thus ultimately related to improving the water management on the land and also to using the scarce water resource on a sustainable basis. Supplying water on a sustainable basis refers to the ability to provide for all water needs, whether they are social, economic, environmental, physical, biological, or religious, of the current generations without jeopardising the needs of future generations. The sustainable supply of water to all users is an immense task complicated by hydrological, logistical, economical, sociological, organisational, technical and environmental as well as political issues (DWAF, 1986 p. 1.1).
Apart from climate, the variation in water uses and hydrological conditions across the country also influences the allocation of water rights in a country. For example, the distribution of South African river systems is concentrated in a few provinces such as Mpumalanga, Kwazulu-Natal, and the Cape, while the rest of the country is dry. The uneven distribution of water thus engenders water scarcity which in turn induces more stringent rules for water use.
It can be said, therefore, that climatic conditions, hydrology and water uses are among the important factors in the evolution of water rights in a country. Among other factors, socio-cultural contexts are important determinants of water rights. For example, the environmental and human right to water use has become very important in the last half of the 20th century across the world. There are 4 important legal doctrines that define the terms and conditions of water use, derived from a combination of cultural and environmental factors: dominus fluminis, riparian, appropriation, and correlative (Black and Fisher, 2001 pp. 39-91).
The dominus fluminis or absolute ownership principle requires complete control of the resource by the governing party. This doctrine prevailed under Dutch rule in South Africa. In the United States it was used by some eastern states in the abstraction of groundwater. Under the riparian doctrine, the right to the use of water resides in the ownership of riparian lands – property that borders the water body. The doctrine has been modified to make it amenable to local conditions by various countries. Riparian rights cannot be transferred for the use of non-riparian land nor can they be lost by non-use. The riparian doctrine was derived from the English common law, which was borrowed in part from Roman civil law. In the eastern United States, the riparian doctrine was commonly used. British rulers in South Africa also adopted this doctrine.
As per the appropriation or Colorado doctrine, the rights to use water are given to those who claim it first; popularly known as the 'first in time is first in right' principle. The prior appropriation system is not affected by the ownership of the land and the appropriative rights can be lost through abandonment, unlike riparian rights. This doctrine was used in the western United States but was not opted for by South African rulers.
The correlative rights doctrine (also called California doctrine) combines certain elements of both riparian and appropriation doctrines and is commonly applied to groundwater. This requires that owners of the overlying land own the common aquifer or groundwater basin as joint tenants and each is allowed a reasonable amount for his own use. In the last quarter of the 20th century, the gradual convergence of riparianism and prior appropriation doctrines has taken place in the United States of America – thus accepting the importance of water regulation (Thompson, 2006 p. 142). For example, originally riparian law was based on the natural flow doctrine which effectively prohibited diversion of water from streams. This worked well in the pre-industrial society. As industrialisation proceeded, demand for water as a source of power for mills increased, and led to the development of the reasonable use doctrine which allowed for some diversions (Thompson, 2006 p. 144). Under all doctrines, water rights are, however, usufructuary which means that a person obtains the right to use but not own the water body (Black and Fisher, 2001 pp. 39-91).
In the South African context, the first 2 doctrines – dominus fluminis and riparian – were used. For example, the Dutch rulers since 1652 adopted the principle of res omnium communes to impose control over the streams of Table Bay Valley, and control was exercised through a series of placcaets. The Company treated water as a public commodity. This was later replaced by a system where the state was dominus fluminis (Uys, 1996 p.190). Under the British rule, water was considered a private commodity and the riparian principle was adopted. Thus, water rights decisions in the court favoured individuals. However, later the apartheid regime under Afrikaner rule swung the balance in favour of the Roman-Dutch law.
The current democratic regime sought to find a balance between riparian and dominus fluminis principles and introduced the modern rights regime. Water is hence treated as a semi-public and semi-private commodity and the state adopted the dual economy model to engender economic development (Tewari, 2008; Temple, 2005). These themes are followed in this study and examples and court cases are supplied to demonstrate the political and vested interests that existed in the development of a certain kind of water rights. It is also for these reasons that the periodisation in water rights evolution tends to closely follow that of the political history of the country, as the 2 are inalienably linked.
Water rights under African customary rule (pre-colonial era)
Prior to colonisation of South Africa, African customary law governed water rights in the pre-colonial society. The water rights were then just common knowledge, were not contested among individuals in the community, and only came up when a community or a tribe felt that another tribe or community was unfairly encroaching onto its resources to its disadvantage. The Bantu people of Southern Africa had a subsistence economy based on hunting of animals and gathering of food. The San in particular were hunter-gatherers while the Khoikhoi were stock farmers (Davis, 1989 p.10). In these communities water like land was free, but land tenure was controlled by the chief and private ownership was not permitted. For quite some time the settler colonising community did not interfere with African communities and they were allowed to run as separate entities and follow their trade/business. This resulted in the dual system of land ownership and as a result a dual system of water rights (Burman, 1973 p. 412). With the passage of time, the colonial community established and aligned itself increasingly in commercial terms with the natives, and the native community, which was subsistence-inclined, continued to enjoy the ownership of resources based on the chief's control without individual tenure (Bennet, 1995 p.133). The encroachment of native resources by settlers finally resulted in the subjugation of African communities. As a result, many Khoikhoi farmers were forced to work on Dutch East India Company farms, as they lost access to land and water (Guelke and Shell, 1992 p. 811). The colonial government also did not take particular interest in creating a uniform policy for native communities. That is why the water rights for the greater part of the history of South Africa generally refer to access to water and water use by the colonists, Dutch, British, and Afrikaners. The history of water rights in South Africa is ence largely the history of the ruling class. For example, the colonial governments formed rules/laws in their own business interests and as a result the majority African population was sidelined. Only after installation of a democratic government in the 1990s, were water rights universalised and imparted to all citizens without any prejudice of race and ethnicity. However, some attempts were made to develop minor irrigation in homelands before 1950 but they did not go very far in bringing a change in the lives of African people (Tlou et al, 2006 p. 28).
Water rights under Dutch rule
The arrival of the Dutch and their decision to settle at the Cape of Good Hope in 1652, led by Jan van Riebeeck, invoked the application of Roman-Dutch law in the new society. The Roman water law was a primitive system and was used to regulate the legal relationships within the farming community along the Tiber River in the Roman Empire about 2 000 years ago. The Roman law recognises 3 classes of water rights: private, common, and public. The private water is owned by individuals and the individual has the right to use it. The common water refers to the water which everyone has the right to use without limit and permission. The public water is owned by the state and is subject to state control.
In the Roman law, things like the air, the deep sea and running water were termed res omnium communes (Wiel, 1909 p. 191). The running water in a natural stream was not owned by anyone, but once taken from the stream became private property during the period of possession (Wiel, 1909 p.213). The common law of England applied the Roman concept that water was 'res communis' and could not be the object of ownership, not even by the state or crown, but was owned by all or was res communis omnium (Caponera, 1998). The law of res omnium communes thus became a guiding principle in The Netherlands and later in South Africa. The Roman law gradually got accepted into the laws of The Netherlands between the 14th and 16th centuries, and produced a kind of hybrid law, known as Roman-Dutch law. This law made the distinction between public and private use of water. Public water was the one which had potential for communal use, while private water was for the individual personal use. The state was given the overall right to control the use of public water. The evolution of water rights in South Africa was highly influenced by legal developments in The Netherlands as, in the latter half of the 17th century and the whole of the 18th century, the Cape of Good Hope was a Dutch colony subject to ultimate control from The Netherlands. The Dutch rulers chose to apply the laws of The Netherlands: the doctrine of state ownership of all public rivers was accepted in the 17th century.
The key writers of 17th century water rights, which became the main source of authority in South Africa, include Grotius, Groenewegen, Vinnius, Van Leeuwen and Johannes Voet. These writers wrote extensively on Dutch laws in The Netherlands and their writings became major milestones in carving out Dutch legal history. Later when the Dutch East India Company (VOC) colonised the Cape, the Dutch legal principles were applied in South Africa (Uys, 1996 pp. 175-178). Grotius advocated that the rivers, lakes, and beds and banks of steams belong to the whole community. Vinnius and Groenewegen argued that all rivers were royal possessions and ownership of these was vested in people. Voet also incorporated into his commentaries the rules laid down in the Digest for control of the use of public streams in the Roman State (Hall. 1939 pp. 8-9).
The establishment of Dutch control of water resources in the Table Bay Valley and its outskirts was not swift, but rather came in 2 phases or periods. The 1st period dated from 1655 to 1740, when a series of placcaets was issued to control the use of streams of Table Bay Valley. The 2nd period or phase was from 1760 to 1827, when the colonial government resorted to the granting of entitlements from streams and this became the major tool for resolving water conflicts between water users. In the 1st phase the colonist took control of the streams of the Table Bay Valley and in the 2nd phase they declared their dominus fluminis status as their 'expansion of sphere of influence' broadened (Thompson, 2006 p. 35).
At the end of the first 3 years of settlement (i.e. by 1655), Van Riebeeck came under pressure to control water use and activities in the Valley for hygienic reasons. A contingent of the Dutch East India Company's merchantmen became ill as a result of impurities in the drinking water obtained from the streams of Table Bay Valley. The burghers (settlers) upstream were using the river water for bathing and washing their personal belongings, which affected the health of downstream users who depended on the same stream for drinking water. Van Riebeeck issued a placcaet on 10 April 1655 that prohibited the washing of persons and personal belongings in the stream (Thompson, 2006 p. 34). The General Proclamation or placcaet prohibiting upstream water pollution was repeated in 1657. Between 1652 and 1740 a series of placcaets was issued to control the quantitative and qualitative use of the streams of the Table Bay Valley (Thompson, 2006 p.35). When this pollution did not stop immediately, penalties were imposed on would-be offenders. The Company thus took the position that it had the right to control the use of running streams in the colony.
In the decade subsequent to 1652, about 120 burghers had settled in the Cape and gardens mushroomed, starting at Table Bay. Some settlers moved into the interior (later to be referred to as Trek-Boers) and became pastoralists. It soon became clear to these settlers and the Company that South Africa, unlike The Netherlands, was a water-scarce country, with limited river water available, relatively low rainfall and prone to droughts. In 1661, the Company began to control water use for irrigation by burghers on piecemeal basis. A placcaet was issued on 16 December 1661, forbidding the use of water for irrigation in order to allow the Company's corn-mill to function (Thompson, 2006 p.34; Hall, 1947 p.1). The limited availability of water for the Boer pastoralists also led to the introduction of the merino breed of sheep from Spain (Davis, 1989 p.21). As a result of rising water demand from the mushrooming gardens and also the Company mills, there was constant friction among the garden owners, between themselves and also against the Company miller. These conflicts were managed through a system of granting entitlements by the Company. The entitlements were regulated by granting turns of water use, referred to as 'besondere gunsti' (Thomspson, 2006 p.35). The Company then agreed with upstream farmers on a system of turns of irrigation so that the functioning of mills would not be harmed. In this way, the Company exercised its rights as dominus fluminis (Hall, 1939 p.16).
Under the Dutch rule, the riparian landowners did not have special rights to the river streams that either ran across or contiguous to their property. However, owing to their physical closeness to the river, riparian owners had a greater advantage in terms of access to river water even when the Company had the power of veto over who accessed what water and in what quantities. Where landowners possessed land adjoining the courses of streams, the Company retained absolute controls over any use whatsoever of any river. The cases of Ackerman v Company in 1763 and Stellenbosch v Lower Owners in 1805 illustrate the fact that riparian owners did receive privileges from the Company because of their close proximity to the river, but not as a right to water (Boxes 1 and 2). As per Hall: 'It is perfectly clear that the free burghers, alongside or through whose land the water of the stream ran, had no water rights. The company gave them permission to use the water for a short period each day when it could spare it, and then it was a special favour and not a right upon which that permission was based. This certainly would seem to prove that the Company remained dominus fluminis (Hall, 1939 pp. 13-14)'.
In 1761, the Council of Policy passed a resolution that authorised the use of water for irrigating the gardens for 4 hours a day. In 1774, the Company's gardens situated downstream were allowed to have water, confirming the domimus fluminis status of the state. This principle was reinforced in the 1774 Resolution, which clearly stipulated that:
'... the owners and occupiers of gardens are to get defined turns of water leading in such a way that the Company's undertakings are not inconvenienced and, over and above that the Burgerraden (farmers or gardeners) are given power to shut down the sluices supplying water further down – at times over and above their accorded water-leading time – should the need arise for the general good of all those involved (Hall, 1939, p. 16)'.
In 1787, the Council appointed a committee to look into the grievances of all owners of gardens in the Table Bay Valley. The committee recommended an extension of hours of water, leading to 8 hours and a system of distribution by turns. However, the Council followed the principle that the government was dominus fluminis in regard to flowing water and that it had the absolute right to grant that water to whomsoever it chose (Hall and Burger, 1974 p.2). Anyone who violated the Company's rule was punished. For example, in 1787, J.H. Redelinghuys was punished with a prohibition on water diversion as he violated an agreement on water turns (Uys, 1996 p. 193). This meant that whenever the Company gave individuals the right to water, it impressed upon them that those rights were granted as a privilege (entitlement only) which could be withdrawn at any time if it appeared to the Council that the conditions were not observed and where the water needs of the Company came under threat or were perceived to be threatened (Hall and Burger, 1974 p.3; Hall, 1947 p.2).
The term dominus fluminis was coined by the South African jurists and was not derived from Roman or Roman-Dutch law (Uys, 1996, p.189). The literal meaning of the term is 'the owner of the river' but it has been used to indicate that the state holds the power to control the use of water and is not necessarily the owner of the resource. To be able to fully control and legislate the use of the water, the law gave the state dominus fluminis over all rivers and water bodies of the country. This doctrine was applied in South Africa and persisted without challenge throughout the 18th century, although the situation in South Africa was very different from that of The Netherlands. The Cape had a few perennial streams but these were not comparable to the navigable waters of The Netherlands. In the Cape, water use was mainly for consumptive purposes, and freshwater was used for domestic and agricultural purposes rather than for fishing and navigation as in The Netherlands. Despite the above facts, the writers of South African water rights laws often incorporated and cited precedence from the Dutch law or made reference to The Netherlands.
The state was dominus fluminis with respect to all running water. It was also accepted that only those streams which flowed perennially were public on the authority of Voet (Hall, 1939 p.10). The doctrine of perennial streams being public and intermittent streams being private was later adopted by the courts of South Africa; the doctrine remained effective until the Cape Irrigation Act of 1906 when the intermittent streams were also added to the category of public streams (Hall, 1939 p. 10). The doctrine of state ownership of rivers and all that pertained to them (dominus fluminis) became universally recognised and persisted throughout the 18th century in South Africa (Hall, 1939 p.10). From the foregoing discussion, the rights of ownership in land which was in contact with a running stream did not ipso jure carry with them rights to make use of the water of that stream. However, the right to make use of the water could be obtained from the state, which granted it as a privilege as opposed to legal right. Thompson (2006, p.36) sums it up nicely: 'It seems that all water was common to all during this period, belonging to no-one in ownership while the government had the right to control the use of water. Entitlements to water were determined administratively. The control was, however, tightened or relaxed according to the demand therefore, influenced by the extent of competition.'
Water rights under British rule
The British period can be subdivided into 2 sub-periods for better understanding of the periodisation of events. The 1st period dated from 1806 to around 1910 and the 2nd period began from 1911 onwards, when South Africa had become a Union and part of the British Commonwealth. The 1st period can be referred to as the British colonial period and the 2nd the British Commonwealth period.
The British consolidated their occupation of the Cape in 1806. With the British take-over of the Cape, the Roman-Dutch law was set to be toppled by the English law over the next 150 years. The British introduced administrative and organisational reforms and introduced English law. The government thus gradually lost power of granting entitlements to water from rivers and only the owners adjoining the river obtained these entitlements (Thompson, 2006 p.36). The landdroste and heemraden were replaced by magistrates in 1827 (Thompson, 2006 p.36). Later some of the functions of landdroste and heemraden were vested in magistrates by Ordinance 5 of 1848 (Thompson, 2006 p.36). In 1828 the Supreme Court was established and it was considered to be the sole authority to decide on water cases (Myburgh v Cloete) (Thompson, 2006 p.36). This was the British invention of a new legal system based on fusion of both Roman-Dutch and English laws. The British rulers in the Cape were very eager to anglicise (transform everything to reflect British control) and effected many legislative changes. The British reinforced their mission to establish David Livingstone's view of 'Christianity, commerce and civilisation' in Africa and engineered the change in all areas including water rights regulation (Nkomazana, 1998). A lot of the Trek-Boers were forced further into the interior, or disenfranchised and made into British subjects.
During the Dutch rule, water was a very scarce resource relative to land; Dutch colonists hence made laws to regulate water use in the interests of the Company. By the time the British came into power, land had become relatively scarcer than water as a result of increasing immigration from Europe and the increasing populations of Trek-Boers and native Africans. All developments in water rights during the British regime thus reflected the predominance of land or agriculture (land-intensive industry) in the economy. Consequently, irrigation development played a major role in the moulding of early water policy, infrastructure, economic and social development in South Africa. Also, the institutions created by the then governments intervened in the development of water resources in favour of the White agricultural community (Muller, 2001).
In 1813, a dramatic change was introduced in land tenure by Sir John Craddock through a proclamation which had profound impacts on water rights in the colony. Craddock's proclamation provided landowners with security of tenure and devolved land ownership from state to individuals. Every lessee who met the terms and conditions was given ownership of the land. The 1813 proclamation thus introduced a change in the general attitude of public opinion towards the ownership of land. Thus the old rule of Dutch colonists of state as dominus fluminus began to struggle for survival under the more liberal British system.
As early as 1820, the British law makers in the colony instituted preferential appointment of lawyers and officials trained in the British Isles to the Supreme Court bench in order to give a new direction to law in the country. The new judges challenged the idea of the state having the power of controlling watercourses as incomprehensible, and gradually put it to disuse. Individual rights to water were granted and courts dealt with water disputes in exactly the same manner as they handled disputes regarding land rights.
The proclamation, along with administrative and legal reforms introduced in the first 2 decades of the 19th century, finally killed the power of the state to control water entitlements, eventually resulting into the introduction of the riparian principle in the Courts and the land. The year 1856 was a critical year since it marked the development of a new water management system using the land-based riparian principle.
A court case (Retief v Louw) in 1856 (but reported for the 1st time in 1874) marked a clear movement away from the state control of watercourses. Here the downstream owner sued the upstream owner, who had diverted the whole of the stream's summer flow and thus deprived the downstream owner of water for drinking purposes and irrigation (Hall, 1939 p. 32). The Court was called to decide the rights of riparian owners and the case was heard by Judge Bell who handled it differently from what had been expected in the past. The Court ignored the dominus fluminis principle and held that for perennial streams running over several adjoining land parcels, landowners 'have each a common right in the use of water which use, at every stage of its exercise by any one of the proprietors, is limited by a consideration of rights of other proprietors' (Hall, 1939 p. 35). The concluding passage of the Judgment by Judge Bell set out below formed the basis of the Common Law of South Africa in later years:
'I have come to the conclusion that the proprietors of lands throughout the course of a perennial running stream of water have each a common right in the use of that water, which use, at every stage of its exercise by any one of the proprietors, is limited by a consideration of the rights of the other proprietors; and it seems to me that the uses to which the proprietor of land lying on the upper part of a stream may make of the water of the stream are, from the very nature of things, to be classed in the following order: 1st, the support of animal life; 2nd , the increase of vegetable life; and 3rd, the promotion of mechanical appliances; and the enjoyment of any one of these uses would seem, also from the very nature of things, to depend consecutively upon how far it deprived the owners of the lower land of their enjoyment of water for the same purposes. If the upper proprietor requires all the water for the support of life, for human beings and cattle upon his land, the lower proprietors must submit; if the water be more than sufficient for such animal demands, sufficient must be allowed to pass for the supply of animal demands of all proprietors lower down the stream before the upper proprietor can be allowed to use the water for the support of vegetable life, or to improve his lands by irrigation. Again the demands for the supply of animal life being answered, the proprietor of the upper ground is entitled to use water for the purpose of vegetable life...by irrigation or otherwise; so are the proprietors of the lower grounds in succession entitled to use water for agricultural purposes. Agricultural uses being supplied throughout the course of the stream, the natural use of water being thus exhausted, the proprietors are then entitled to apply water to mechanical purposes. But I apprehend that no proprietor on any part of the stream is entitled to use the water for all these three purposes, even consecutively in the order in which I have mentioned them, or any one of them, recklessly and without any regard to the wants of those below and above him (Hall, 1939 p. 35).'
This formulation was in essence the Anglo-American doctrine of riparian rights (Kidd, 2009; Milton, 1995 p.4). Judge Bell distinguished between the water rising on an owner's land and water running over his land. The water running on the land was considered public while the water rising on the owner's land was private (Thompson, 2006 p. 38). The principle of riparian ownership was imported into the South African law. The Court (Judge Bell) cited from American textbook, Treatise on the Law of Watercourses, by Joseph K Angell (1840). Some 10 paragraphs (para. 84, 93, 94, 95, 117, 120, 121, 122, 124, 128) of the book provided Judge Bell with all the material that he needed for making up his mind on the case (Hall, 1939 p.36). From this text South Africa's water laws also adopted the system of the proportionate sharing of the use of perennial streams by riparian owners which was evolved in the United States of America (Hall and Burger, 1974 p.4; Thompson, 2006 p.43). Further, water use was divided into 3 categories: for the support of animal and human life, increase of vegetable life, and for the promotion of mechanical appliances. Water could not be used for a specific category if all the owners along the river did not have enough water for higher category (preferential order of use). This preferential order of use further limited the riparian owners to not use water recklessly (Thompson, 2006 p. 43).
The doctrine of dominus fluminis received the other deathblow in 1869 when Privy Council suggested that when water had flowed beyond the boundaries of the land on which it rose in a known and defined channel, the lower owners became entitled to use it (Silberbauer v Van Breda) (Hall and Fagan, 1933 p. 3). The Privy Council heard appeal from judgment in Silberbauer v Van Breda. The judgment was reversed and it was concluded that the Roman-Dutch principle that the owner has the absolute right to water rising on his land as per Voet was not acceptable in the colony (Hall, 1939 p.43). Furthermore, in 1875, in the case of Vermaak v Palmer, Judge Smith held that the upper owner was not entitled to the unlimited enjoyment of the water rising on the land (Hall, 1947 p.26).
From 1827 to 1855 the judges appointed to the Supreme Court Bench were men such as Musgrave, Wylde, Menzies, Bell, Hodges, Burton, and Kekewich, who were all trained in the English or Scottish Law and had little acquaintance with Roman-Dutch Law. They all therefore tended to base their decisions on English authority (Hall, 1939 p.38). When Cloete and Watermeyer were appointed to the Supreme Court Bench in 1855, they tried to reverse the process over the next 12 years by basing their decisions upon Roman-Dutch law (Hall, 1939 p. 38). But this changed again when Sir Henry de Villiers was appointed as the Chief Justice of the Cape Colony in 1873.
Chief Justice (CJ) de Villiers treated irrigation water use as res nova and laid down the principle of common use by all riparian owners. This was followed by a series of decisions by the Supreme Court which were based on English and Scottish laws that allowed riparian owners to be entitled to common use of water of a stream to which their properties were contiguous (Hough v Van der Merwe, 1874; Van Heerden v Wiese 1880) (Hall and Fagan, 1933 p. 3).
In his judgment of Hough v Van der Merwe, Chief Justice De Villiers dismissed Voet's principles and concluded a judgment in 1874 similar to that given by Judge Bell, although the Chief Justice did not give any reference to Bell in his judgment, as follows, that according to:
'Our law the owner of the land, by or through which a public stream flows, is entitled to divert a portion of the water for the purposes of irrigation, provided – firstly, that he does not deprive the lower proprietors of sufficient water for their cattle and for domestic purposes; secondly, that he uses no more than a just and reasonable proportion of the water consistently with similar rights of irrigation in the lower proprietors ; and thirdly, that he returns it to the public stream with no other loss than that which irrigation has caused (Hall, 1939 p. 44).
The principles set out in Hough v Van der Merwe were refined by the Chief Justice shortly thereafter in Van Heerden v Wiese (1880), in which the court distinguished between public and private streams (Kidd, 2009). In fact, these judgments later formed the basis of water law when the task of codification was first undertaken in 1906. The most important feature of the decisions was that a sharp distinction was drawn between public and private streams bearing in mind the drier climate of South Africa (Hall and Fagan, 1933 p.4).
In 1874, the courts laid down the criteria for public and private water use and agreed that running water was res omnium communes in principle. The court defined the perennial streams as public streams which were to be used by riparian owners, while the owner of land on which a private stream rose was accorded full ownership of the water (Hall, 1947 p. 4). This however did not mean, as per Thompson (2006 p. 39), that weak water sources were excluded from being classified as res omnium communes. The flowing and running waters were public but weak and negligible streams which had no competitive uses were considered private (Thompson, 2006 p. 39). Furthermore, the use of water from a public stream was divided into ordinary and extra-ordinary uses and clear rules were laid down to guide these. Ordinary use consisted of water for the support of animal life and household use in the case of riparian owners; the extraordinary use included other uses of water for any other purposes. An upstream owner was permitted ordinary use; but was not allowed extraordinary use if downstream owners were deprived of ordinary use. Both upstream and downstream owners were allowed a reasonable share of irrigation water. The practical application of preferential ordering or reasonable use of irrigation water came before the Court in 1897 (Van Schalkwyk v Hauman); here the upstream owner had to sacrifice a part of his water for the downstream owner (Thompson, 2006 p.44).
In 1881, the question of riparian ownership was dealt with by Chief Justice De Villiers who suggested a system of apportioning water between heavy competitive uses. The court accepted the principle of reasonable common use by way of a system of preferential water rights (Uys, 1996 pp. 211-238). The Chief Justice further laid down some rules for reasonable sharing of irrigation water and suggested regulation between riparian proprietors according to season. For example, the upper proprietor cannot claim the same amount of water in the dry season as in the wet season, so as not to deprive the lower owner of his reasonable share (Hall, 1939 p.54).
There were several cases heard between 1750 AD and the 1stfirst half of the 19th century where burghers raised complaints about the inadequacy of water. Most of these cases were between upper and lower stream users. These cases were handled by the court bearing in mind the riparian principle. These principles, with some change, were also applied in other neighbouring colonies of that time. For example, in the Transvaal, the legislative steps were taken to provide directions to use public water though Law 11 of 1894 of Transvaal. Later, in the Cape, Act 40 of 1899 of the Cape Colony created water courts with jurisdiction to decide all disputes and claims related to water use. The Act helped to codify the law in 1906. Thus the riparian principle, which took root in the 15th and 16th centuries in England (Getzler, 2004 p. 117) and was a sort of common law principle of entitlement, became entrenched in the South African water law.
Towards the end of the 19th century the conflicts between different competitive uses of water increased due to rapid development of irrigation practices in the Cape. Although at this point in time the distinction between public and private water was very clear as laid down by various courts, the rules for the use of water were not clear which resulted in a lack of effective government control over the common use of water (Thompson, 2006 p. 50). In 1887, a well-known irrigation specialist from America, Mr Hamilton Hall, known as Ham Hall, was invited to recommend a revision of the water allocation mechanism developed by the courts (Thompson, 2006 p. 51; Hamilton Hall, 1898)). This revision, however, did not happen due to paucity of support in the parliament, and thus the riparian principle remained entrenched.
Finally, in 1906, the riparian principle was incorporated in the Act 32 of 1906 of the Cape Colony, based on previous laws and decisions of the Court during the 18th and 19th centuries (Thompson, 2006 p.52). The major achievement of this codification was that it codified the distinction between public and private streams (Thompson, 2006 p. 52). The 1906 Act classified both perennial and intermittent rivers as public. As a result, flood water could not be used for irrigation without storage; most Karoo rivers flowed down to the sea unchecked (Hall, 1939 p.72). In 1909 the Cape Parliament tried to remedy this by giving riparian owners the right to impound and store a reasonable share of water that might be in excess of normal flow (Hall, 1939 p. 72). This was followed by the Irrigation Act (Transvaal) of 1908. When the Union of South Africa was formed in 1910, the Irrigation and Conservation of Waters Act of 1912 (the 1912 Act) was promulgated to codify all the laws of the Union.
The 1912 Act was a compromise between the northern (Transvaal and Orange Free State) and southern (Cape and Natal) provinces. It was based on the Irrigation Act (Cape) of 1906 but was modified to tackle the situations (dry and low rainfall conditions) in the northern provinces (Thompson et al., 2001 p. 12). In this Act, the characteristics of a public stream were changed by substituting 'general common use' with 'common use for irrigation' and also the concepts of normal and surplus flows of water were innovated and used ingeniously (Hall and Burger, 1974 p. 6). As per this Act, a public stream was defined as a natural stream of water which, when it flowed, flowed in a known and defined channel, and of which the water was capable of being used for common irrigation (Uys, 1996 p. 252). The normal flow was broadly defined as the perennial part of the flow of the river, while the surplus water referred to irregular high flows after heavy rains (Thompson et al., 2001 p. 12). Riparian users were given rights to use public water which was redefined as the normal and surplus flows of a river. The normal flow between riparian owners was subject to apportionment, but they were allowed to use surplus water to the greatest extent that they could beneficially use it; private water was provided if it rose on the owner's land (Thompson et al., 2001 p. 12). In sum, the 1912 Act divided water into public (res communis) and private (res privatae). The public water was further divided into surplus and normal flows. The normal flow was subject to common rights of use and surplus water to serviceable exclusive rights of use, while private streams were subject to unlimited exclusive rights of use (Uys, 1996 p. 259). Thus the concept of perenniality was finally abandoned in the Act of 1912 and was categorically replaced by 'surplus flow' and 'normal flow'.
It is noteworthy that although the Act of 1912 recognised riparian rights as dominant, there was provision for grants to non-riparian owners to use water not utilised by riparian owners (Nunes, 1975; De Wet, 1979). About 40 Acts were promulgated to circumvent water court orders in order to carry out water projects. Later, these Acts were repealed by the National Water Act of 1998 (Thompson et al. 2001; Kidd, 2009).
It is to be noted that through the British title deed system, the colonial government granted land titles to members of the White minority over 91% of the territory; thus, by adopting riparian rights throughout South Africa, instead of the Roman-Dutch permit system, the 1912 Act vested most of the rights to water resources in Whites only (Van Koppen, 2005). Thus it discriminated against the Black majority.
The Union's policy at that time was to encourage large-scale irrigation projects and instituted restrictions on riparian rights. As a result, the court had to adjudicate between the government and riparian owners whenever major water works were constructed. It finally resulted in a chaotic situation as the state did not invest actively in water infrastructure and apportionment of water became the exclusive function of the judiciary (Thompson et al., 2001 p. 12; Thompson, 2006 pp. 57-58).
The disparity between the principles of Dutch water rights and those of the British can be understood from the viewpoint of input scarcity. For example, when the Dutch arrived in the Cape, land was abundant but water was scarce. By the time the British occupied the Cape, land had also become a scarce resource due to rising immigration from Europe and increasing populations of the Trek-Boers and native Africans. As a result, water rights became largely tied to land tenure and riparian water rights became the mainstay and legacy of British water rights policy in South Africa.
The key to understanding water rights under the British regime lies in the way that they viewed different water resources in the colony and then modified the riparian principle to suit different situations. For example, after gold was discovered in the Johannesburg area in 1866, they established the Rand Water Board in 1903 in the greater Witwatersrand area and gave water rights to mines on a priority basis with the sanction of law (Lewis, 1934); this promoted movement of settlers to the Johannesburg town (Turton et al., 2006). The two important aspects of the British water rights that need special mention are: categorisation of water rights by forms of water, and the riparian principle superseding state control.
Categorisation of water rights
The British recognised that South Africa had very limited water resources in rivers, dams and under the ground. Water regulation was therefore designed to accommodate differences that arose due to forms of water (surface versus ground). For the first time in South African history, the distinction was made between forms of water by the judicature in 1856 and clear distinction between surface water and groundwater was drawn in 1876 (Thompson, 2006 pp. 37-40). The first important category of water was surface water which included rivers, streams and springs. The rivers, not streams, were considered public. In 1874, courts agreed that all running water was res omnium commune (Thompson, 2006 p. 38).
The water-related legislation enacted in these early years was hence aimed at protecting the water rights of farmers along rivers. Thus irrigation development was one of the major objectives of the British water rights regime. The development of irrigation in South Africa occurred in 3 phases. In Phase 1, up until 1875, weir diversions or pump schemes were based solely on private individual initiative and the economy at this stage was characterised by subsistence agriculture. Phase 2 began with the introduction of cooperative flood diversion schemes in the Cape with loans provided by the government. It was an agriculture-with-mining development phase in the country. Phase 3 included the storing of water through dams during the 1920s, and government promoted the settlement of people on the land. (SANCID, 2009) ). This was an agricultural-mining-industrial development stage. The river water was primarily used for irrigation which made river water the most important resource in the evolution of water use in South Africa (as irrigation was generally done by direct diversion of water from rivers) (DWAF, 1986). The state concentrated on the construction of dams on rivers to provide irrigation water to agriculture, especially after the 1920s. This did delay the development of comprehensive legislation to control and regulate the use of water and brought agricultural and industrial water users into conflict as the legislation could not suit both. The industrial users' lobby became very strong. The Water Act (54 of 1956) was designed to meet the needs of all urban, industrial and agricultural users, and legal mechanisms were created for industrial and urban users to obtain water rights (Thompson, 2006 pp. 61-62).
The ownership of water rights emanating from a river source was closely linked with land rights. The ownership of land contiguous to a river source advantaged the landowner and disadvantaged those who were not owners of such land. The mere fact that the owner of riparian land had sold his right to use water on that land did not deprive the land of its riparian characteristics (Hall and Burger, 1974 p. 23). For example, in the case of De Wet v. Estate F. J. Rossouw, the water of a public stream was divided between the 2 riparian owners who had a dispute between them. A riparian owner who had received a share in water acquired another piece of land (2nd piece) which was not entitled to water. However, he proposed to use his water entitled from the 1st piece of land on the 2nd piece of land, to which the other riparian owner objected. The court held the case in favour of the latter stating that subsequent apportionment of water to the 2nd piece of land was not rightful (Box 3).
The 2nd important category of water use was groundwater which was seen as a resource supplementing surface water use. Groundwater was defined as all water naturally existing under the ground, whether in a defined channel or not (Vos, 1978 p. 20). Groundwater rights have also gone through several changes. For example, an indirect reference to groundwater by the judicature was made by Judge Bell in the case of Retief v Louw (Uys, 1996 p. 397). In the case of Mouton v Van der Merwe in 1876 the court raised doubt as to the validity of Voet's view that water which burst out on one's land was one's property just like the groundwater beneath one's land (Uys, 1996 p. 397). As early as 1914, concerns arising from groundwater were heard in different water courts of the country. One such case was that of Smith v. Smith in 1914 where it was considered a 'fundamental principle that the owner of land owns a centro ad coelum and accordingly groundwater is the absolute property of the land owner with the exception that if the underground water is public' (Vos, 1978 p. 24). Where groundwater was flowing in a common public stream, which was a perennial stream capable of being put to the common use of the riparian proprietors, such groundwater was considered as public (Vos, 1978 p. 24).
The 3rd category of water use was dam water. Having acknowledged the limitation of river water resources and the complications associated with using groundwater resources, the British colonists turned to dams as a very important water resource in South Africa. Water courts allowed water rights for storage of water upon the land of an adjoining owner.
Riparian principle superseding the dominus fluminis
By the time the English took control of the Cape, the land and water were both under the control of the Company (VOC) and water rights were not tied with the land. This meant that the ownership of land did not automatically include the right to divert and use the water of a permanent stream flowing through the land (Hall, 1939 p.27). At this juncture in history, 2 land tenure systems existed: the loan-farm or leningplaat and quit-rent. The loan-farm system was introduced by the Company in 1714 and under this system the land was leased to the holder who paid annual rent plus stamp duty (Duly, 1968; Hodson, 1997); the lease was renewed from year to year. The ownership of land and water however rested with the Company. The quit-rent system was started in 1732 and land under this system was leased for 15 years and the name of the holder was registered with the government (Duly, 1968). However, as usual under the Dutch regime, the ownership was with the Company. This was a slightly better system as the landholder could plan and do things with the land under the 15-year lease period. With the coming of the British in 1795, the tenure system was modified. British tied water rights with the land as 1 package and Sir John Craddock's proclamation of 1813 gave landowners security of tenure. Craddock adopted the quit-rent model and land holders were asked to convert to quit-rent tenure. Although the process took some time, it finally succeeded. This speeded the process of adoption of a riparian system of water rights in the Cape.
The ownership of riparian land gave automatic access to water that flowed from the adjoining land. A riparian owner was given the right to use all the water of a public stream provided that it was used in a 'reasonable' manner. This, however, favoured the upper as opposed to lower owner along the public stream. Thus the British system put a lot of trust in the hands of individuals and incentivised them to make a transition to the riparian system of water rights.
The appointment of Sir Henry de Villiers as the Chief Justice of the Cape Colony brought the riparian principle into full practice in 1873 and it remained effective until 1956. After 1956 there was a clear move away from riparianism; the Minister had the power to declare government water control areas and could then allocate water to non-riparian land.
The British rule thus established and practiced the riparian principles and literally eliminated the dominus fluminis status of the state in the land. It is interesting to note that when Americans fought against the riparian principle in Colorado and other western States of the USA, South Africa continued to cling to the riparian principle despite it not being suited to a dry country. In America, the riparian principle was finally rejected in 1928 by the California Court.
Revival of the dominus fluminis under Apartheid
The National Party (NP) came to power in 1948 and introduced the system of apartheid. The NP government introduced large water projects to encourage economic development in rural areas where a large part of the NP's support base was located (Turton et al., 2004). Under the apartheid regime, the 1st milestone in the water rights history of South Africa was the Water Act of 1956 (Act 54 of 1956). The Water Act of 1956 has been hailed as representing a very important piece of legislation in the history of water regulation in South Africa. This Act managed to harmonise water regulation in the interests of the economic heavyweights, agriculture, mining and industry. According to the Department of Water and Affairs and Forestry (DWAF, 1986), the Act came closest to:
'... ensuring equitable distribution of water for industrial and other competing users, as well as to make possible strict control over abstraction, use, supply, distribution and pollution of water, artificial atmospheric precipitation and the treatment and discharge of effluent (DWAF, 1986, p. 1.9).'
The Republic at this stage was sufficiently industrialised and the urban population had grown. The political context had also changed and the country was ruled by the Afrikaner nationalists. The increasing demand for water from urban and industrial sectors during the 1st half of the 20th century placed an additional burden on the limited water resources. The increased demand could not be accommodated by the traditional riparian principle. Thus the 1912 Act could not meet the expectations of a growing industrial economy. Increased competition for water use necessitated a change in the law. In 1950, a Commission of Inquiry into Water Matters under the chairmanship of C. G. Hall, known as the Hall Commission, was appointed and on their recommendation, the Water Act of 1956 was promulgated. In brief, the new Act moved away from the riparian rights principle, which worked well as long as water was used primarily for agricultural purposes (De Wet 1959 p. 35). The Irrigation Department was then renamed asthe Department of Water Affairs to reflect its broadened scope. This required provisions for the domestic as well as industrial uses of water. The Act vested in the Minister of Water Affairs a large measure of the control of public water through the principle of government control areas.
The key principles of the 1956 Act were:
- Riparian ownership is a workable system; however, final control of water resources is with the state
- Strict state control on industrial and groundwater uses was advocated.
The Act permitted the government to declare 'control areas' where the control of water was deemed by the Minister to be desirable in the 'public' or 'national' interest. These control areas included subterranean government control areas (s28), government water control areas (s59) which in turn could be declared irrigation districts (s71 and s73), government drainage control areas (s59 (5)) catchment control areas (s59 (2)), dam basin control areas (s59 (4) (a)) and water sport control areas (Kidd, 2009). By the Act of 1956 the state was thus re-invested with dominus fluminis status for all practical purposes, bearing in mind the increasing demand for water and the fixed water supply. The state defended this status on the basis that increasing scarcity of water in the country required state interference for the purpose of rationing and development of water resources of the country. The use of public water for industrial purposes was subject to the permission of a water court orthe Minister (s11 (1)), but the industries which were supplied with water by the local authorities were not required to have water court permission (Kidd, 2009). Control over urban and industrial users was also exercised by the introduction of the Water Boards. They made provision for bulk water for urban and industrial use and for regional sewage schemes in the area of their jurisdiction. Measures were also introduced to control water pollution activities.
The Water Act 54 of 1956 replaced the Irrigation Act of 1912. The Act partially entrenched the riparian rights and brought back dominus fluminis status of the state through government control areas. The distinction between the public and private water from the previous Act was retained and refined further. The idea of public water and its classification into normal flow (which would be divided between the riparian owners) and surplus flow (where, in flood times, riparian owners could take as much surplus as they were able to use beneficially), which was introduced in 1912, was further improved. The right to use public water was divided into agricultural, urban, and industrial purposes. A riparian owner was permitted to use water for the purposes of agricultural and urban use only. This riparian owner could use a share of normal flow and all the surplus water for beneficial agricultural and urban purposes. The groundwater could also be classified as public and private. Groundwater not defined either public or private was subjected to common-law principles.
The colonial water rights policy excluded the Africans who could not compete in the land markets freely and also did not have the resources to do so where such access was possible. Around 1900, various legislations were aimed at dispossessing Black Africans. For example, legislation such as the Native Land Act (27 of 1913) (dividing the land between Black and White people), the Development Trust and Land Act (18 of 1936) (preventing Africans from owning land in their own right), and the Group Areas Act (41 of 1950) clearly controlled the majority Black people's access to land and hence to water (Stein, 2005). At the same time, the Land Bank of South Africa was mobilised to help White farmers as part of a policy to reduce White unemployment.
In addition to the original provinces comprising the Union of South Africa (Transvaal, Orange Free State, Natal, and Cape), there were 4 independent and autonomous states and 6 self-governing territories – formation of these states was a policy of apartheid to create separate jurisdiction for the original inhabitants. These territories and states had legislative power to repeal, amend or replace the 1956 Act. However, none of them, except Bophuthatswana, made any changes to the Act. Bophuthatswana adopted the dominus fluminis principle into law in 1988. In a nutshell, the right to the use of water continued to be based on the principle of dominus fluminus as the majority of land was state owned in these national states and self-governing territories; the land ownership in these states was governed by African customary law (Thompson et al, 2001).
Water rights under democratic rule (1990s onwards)
The most important challenge for post-apartheid democratic South Africa with its neo-liberal inclination was to find the balance between the traditional view that water is a public good and the modern view that water also has a commercial value. The current legislative framework made a marked shift from previous water laws; it sought to address the social inequities and environmental concerns on the one hand and efficiency-related issues on the other. The Constitution of South Africa, which was finally adopted in 1996, contains a Bill of Rights (Chapter 2) that ensures rights of individuals to environment and water. The concerns relating to social inequities and environment are of paramount importance in the South African Constitution. Section 24 provides that 'Everyone has the right (a) to an environment that is not harmful to their health or wellbeing; and (b) to have the environment protected, for the benefit of present and future generations, through reasonable legislative and other measures that (i) prevent pollution and ecological degradation; (ii) promote conservation; (iii) secure ecologically sustainable development and use of natural resources while promoting justifiable economic and social development.' Section 27 provides for the right to water as follows: '(1) Everyone has the right to have access to (a) healthcare services... (b) sufficient food and water; ...(2) The state must take reasonable legislative and other measures , within its available resources, to achieve the progressive realisation of each of these rights (RSA, 1996 pp. 11-13).' These 2 fundamental rights form the backbone of South African water law. Also, water is classified as a resource of exclusive national competence as it does not appear in Schedule 4 and 5 of the Constitution, thus confirming its significance to the country (RSA, 1996).
Although the Act of 1956 had been seen as a reversion towards a state as dominus fluminis, as it made provisions for increasing government control over water, the government powers were not widely used to dilute the riparian rights in essence (Kidd, 2009). The 1956 Act was heavily based on riparian rights, privileging White riparian farmers and excluding the majority of South Africans from access to water rights (WLRP, 1996). The Recommendations of the Water Law Review Panel formed the basis of the White Paper on a National Water Policy for South Africa (DWAF, 1997). The White Paper indicated that in 1997 about 12-14 m. South Africans (out of 40 m.) were without access to safe water and over 20 m. without access to adequate sanitation (Kidd, 2009). The new development vision of the country – the Reconstruction and Development Programme – formed the basis for overhauling the legal system and building new laws, including water laws, for its people.
The new water law was built on some 28 basic principles as discussed in the White Paper (DWAF, 1997). The first 4 key principles laid the legal foundation of the law and these stated that: the water law is to be subjected to and also be consistent with the Constitution (Principle 1); all water, irrespective of its occurrence in the water cycle, is a common resource and its use is subject to national control (Principle 2); there is no ownership of water but only a right (environment and basic human needs) or an authorisation for its use; and any authorisation is not granted in perpetuity (Principle 3).; the riparian principle is abolished (Principle 4). The 2nd set of principles related to recognition of water cycle as resource (Principles 5 and 6). The 3rd set of principles which guided the water resource management priorities clearly laid the ground rules for water managers of the country, suggesting that: the objective of managing water (quantity, quality, and reliability) is to achieve optimum, long term, environmentally sustainable social and economic benefit for the society from their use (Principle 7); the access to water for all and water required for meeting ecological functions are reserved (Principles 8 and 9). The use of water for meeting basic human needs and the needs of the environment are reserved and prioritised. The international obligations through treaties and rights of neighbouring countries are to be recognised (Principle 11). The 4th set of principles (Principles 12-21) related to water management approaches. These principles allude that the National Government is the custodian of the water resources of the nation (Principle 12); the National Government would meet this mandate by ensuring that the development, apportionment and management of water resources is carried out using the criteria of public interest, sustainability, equity, and efficiency while recognising the basic domestic needs, plus the requirements for meeting environmental and international obligations (Principle 13), and so on. Principles 22 to 24 are to guide the development and functioning of water institutions, while Principles 25 to 28 relate to provisioning of water services to people.
As mentioned earlier, the development of water rights in South Africa is largely hinged upon Roman-Dutch law in which rivers were seen as resources which belonged to the nation as a whole and were available for common use by all citizens, but which were controlled by the state in the public interest – this is sometimes known as the 'public trust doctrine'. The concept of public trust goes back to Roman times. The Roman Emperor Justinian codified the law in 528 AD, which has been known as the Institutes of Justinian (Lee, 1956 pp. 33-45). The Institutes of Justinian stated that by the law of nature some things are accepted as common to mankind such as air, seashore, etc. These are defined as 'commons' in today's parlance. This public trust doctrine was later adopted by England's legal system and was a part of the Magna Carta in 1215 AD. The Magna Carta sought to limit the powers of the king and prevented him from giving exclusive rights to noblemen to hunt or fish in certain areas. The King owned the land but he was obliged to protect it for the use of the general public. The English Common Law developed though decisions made by judges and they twisted the Roman notion of common property and defined that common properties were held by the king for the benefit of subjects. The king held them 'in trust' for the benefit of all citizens. The idea of trusteeship was finally incorporated into the South African law after the democratic transition in the country. These principles were closely in line with African customary law which saw water as a common good used in the interests of the community. The public trust principles are entrenched in the Fundamental Principles and Objectives for a New Water Law in South Africa (Principles 12 and 13) (WLRP, 1996).
National government is designated the public trustee of the nation's resources to 'ensure that water is protected, used, developed, conserved, managed and controlled in a sustainable and equitable manner, for the benefit of all persons and in accordance with its constitutional mandate' (NWA, 1998 s3 (1)). The Minister of Water Affairs and Forestry was given the executive responsibility to ensure that water is allocated equitably and used beneficially in the public interest, and that its environmental values are protected (NWA 1998, s3 (2)). Equitable access was considered very important due to the discriminatory policies of the past. The idea of public trust in the South African law gives the overall responsibility and authority to the national government of the country; it has never meant that government owns the water resources (Thompson, 2006, p.279).
Having met the constitutional mandates towards basic human needs, environmental requirements, and international obligations, the White Paper suggested that the framework of the market be used to effect efficient use of water (DWAF, 1997 s6.5.3). Setting the appropriate price for water is sought as an effective mechanism to achieve its efficient and productive use (DWAF, 1997 s6.5). That is, in a free enterprise economy, pricing the water was considered as the best way of rendering a balance between supply and demand and preventing wastage of water. Cabinet decided in February 1996 that the price of water for major users should progressively be raised to meet the full financial costs of making the water available and to reflect its value to society (DWAF, 1997 s6.5.1). In drafting new water tarrifs, 2 important principles were thus utilised:
- The riparian principle of water allocation was replaced by the principle of water permits (administrative water rights, licenses, concessions, authorisations)
- The principle of separation of public and private water rights.
Keeping these social values in mind, the South African Parliament passed 2 laws:
- The National Water Act (NWA) of 1998
- The Water Services Act (WSA) of 1997.
National Water Act 1998
The National Water Act of 1998 repealed over 100 Water Acts and related amendments and extinguished all previous public and private rights to water (NWA 1998, Schedule 7). The government was given the responsibility to sustainably manage the nation's water resources for the benefit of all persons in accordance with its constitutional mandate (NWA, 1998 s3). The purpose of the Act is to ensure that the water resources of the nation are protected, used, developed, conserved, managed and controlled in ways which take into account the following (NWA, 1998 s2):
- Meeting the basic needs of present and future generations
- Promoting equitable access to water
- Redressing the results of past racial and gender discrimination
- Promoting the efficient, sustainable and beneficial use of water in the public interest
- Facilitating social and economic development
- Providing for growing demand for water use
- Protecting aquatic and associated ecosystems and their biological diversity
- Reducing and preventing pollution and degradation of water resources
- Meeting international obligations
- Promoting dam safety,
- Managing floods and droughts
The purpose of the NWA is to reform the water law in the country and to this end the Preamble of the Act:
- Recognises that water is a scarce and unevenly distributed natural resource which occurs in many different forms which are all part of a unitary inter-dependent cycle
- Recognises that while water is a natural resource that belongs to all people, the discriminatory laws and practices of the past have prevented equal access to water and use of water resources
- Acknowledges the National Government's overall responsibility for and authority over the nation's water resources and their use, including the equitable allocation of water for beneficial use, the redistribution of water, and international water matters
- Recognises that the ultimate aim of water resource management is to achieve the sustainable use of water for the benefit of all users
- Recognises that the protection of the quality of water resources is necessary to ensure sustainability of the nation's water resources in the interest of all water users
- Recognises the need for the integrated management of all aspects of water resources and, where appropriate, the delegation of management functions to a regional or catchment level so as to enable all to participate (Thompson, 2006 p. 199)
The National Government, acting through the Minister, is appointed as a public trustee of the nation's water resources and must ensure that above objectives are met. The NWA (1998) makes provision for the following:
- The establishment of a water resource planning regime though the National Water Resource Strategy (NWRS) and the development of catchment management strategies (Chapter 2)
- Protection of water resources through the classification of water resources and their quality and the determination of a Reserve (Chapter 3)
- The establishment of permissible use of water and entitlements to use water, and administration of the entitlements (Chapter 4)
- The pricing of water use and provision for financial assistance (Chapter 5)
- Creation of catchment management agencies (CMAs), water user associations (WUAs), and advisory committees (ACs) ( Chapters 7-9)
- Establishment of bodies to implement international agreements (Chapter 10)
- Construction and control of water works and storage, and dam safety (Chapters 11-12)
- Access to and rights over land (Chapter 13)
- The establishment of a national monitoring and information system (Chapter 14)
- Appeals and dispute resolution, offences and remedies (Chapters 15 and 16)
The National Water Act recognises that water is a scarce and unevenly distributed resource, belonging to all people, and that no discriminatory law should be established to prevent access by others and that sustainability should be the aim in distribution through which all users could derive benefits. Until very recently, river water resources were regarded as public while groundwater was considered private. The new Act has called for the uniform protection of all significant water resources, emphasised resource sustainability and the principle of integrated water resource management; the Act attempts to redress the problem of past groundwater mismanagement by presenting a number of policy principles for guiding of groundwater protection strategies (Van der Merwe, 2000 pp. 16-18).
The Act defines water use in Section 21 (Chapter 4 of NWA, 1998) very broadly, covering 7 types of water uses which include ((DWAF, 2004 p.63):
- Abstracting water from a water resource (s21 (a))
- Storing water (s21 (b))
- All aspects of waste disposal which impact water resources (s21 (f) and (g) and (h))
- Removing, discharging or disposing of water found underground (s21 (i))
- Making changes to the physical structure of watercourses (s21(c) and (j))
- Some activities such as stream flow reduction activities (s36, s37 (1), s38 (1))
- Water for recreational use (s21 (k))
The Act regulates water use and makes provision for authorisations of water use in 3 ways:
- Schedule 1 authorisations
- General authorisations
- Water use licences
Schedule 1 permits the use of relatively small quantities of water, primarily for domestic purposes, which is exempted from the requirement for licensing. A general authorisation conditionally allows limited water use without a licence. Any water use that exceeds a Schedule 1 use, or that exceeds the limits imposed under general authorisations, must be authorised by a licence (DWAF, 2004 pp. 64-65). A water use licence is valid for specified time period (not exceeding 40 years) with conditions attached to it and must be reviewed by the responsible authority at least every 5 years (DWAF, 2004 p. 66).
The National Water Act also provides for a pricing strategy for all water uses defined under Section 21. Three types of water charges are provided for by the Act. These include: water resource management charge, water resource development charge, and an economic charge for the value of water to particular users (DWAF, 2004 p. 83). The first 2 charges – management and development – are financial charges which are directly related to the costs of managing water resources. The 3rd, economic, charge is to usher efficiency in water use across various types of water uses.
As per the authorisation mechanisms, the law permits/enables those affected by decisions regarding licensing to voice their opinions, and gives them the right to be provided with reasons for a licensing decision. It also gives them the right to appeal against a decision that might be unfavourable towards their interests. The legal mechanism necessitates the use of economic instruments such as pricing mechanisms and financial assistance or subsidy programmes (Stein, 2002 p. 119). This instrument ensures that hedonistic users of water pay for the resource. Although pricing of water is a problematic issue in South Africa as many cannot pay for it, especially in rural areas and in the case of slum dwellers in cities, all significant private and public entities are expected to pay for their water use.
For successful management of water resources, an integrated or coordinated development and management of water (IWRM), land and related resources is recommended in order to maximise the resultant economic and social welfare in an equitable manner without compromising the sustainability of ecosystems (Thompson, 2006 p. 162). The hierarchy of water management institutions in the country is thus comprised of3 levels:
- Minister of Water Affairs and Forestry at the national level
- Catchment management agencies
- Water user associations
After country-wide consultation, some 19 water management areas (WMAs) were established in the country. Catchment management agencies (CMAs) are statutory bodies with jurisdiction in a defined WMA. Integrated water resource management is to be done in South Africa on a catchment basis. The efficiency aspect is further strengthened by decentralisation of decision making to the catchment level, through the catchment management agencies (CMAs).
The Department of Water Affairs (DWA, formerly the Department of Water Affairs and Forestry (DWAF)) is now fully responsible for administering all aspects of the Act on the Minister's behalf. This role will diminish as regional and local water management institutions are established. The eventual role of the DWA will be to provide national policy and a regulatory framework and to maintain general oversight of the institutions' activities and performance. In the long run, the responsibility for operating and maintaining infrastructure will be transferred to the CMAs and WUAs. Each CMA is to develop a catchment management strategy for managing water. The local execution of the catchment management strategy is done by the local organisations such as WUAs and others. At a later date, the CMAs may be given the financial and administrative responsibilities for setting and collecting water user charges (Tewari and Kushwaha, 2007). Functions and responsibilities of CMAs include:
- Development of strategy in the catchment to meet the objectives of the Act
- Management of water resources and coordination of the water-related activities of water users and other water management institutions within the WMAs
- Additional functions may be delegated to the CMA by the Minister.
The licensing system is thus more flexible and more rational in allocating water across various uses than the riparian principle. However, at the same time, the pricing mechanism ensures that hedonistic users of water pay for their use. The licensing principle has thus replaced the riparian principle of the past.
Water Services Act 1997
The 'White Paper on Water Supply and Sanitation' was published in November 1994. This was followed by the Water Services Act (108 of 1997) (WSA). The Act delineates the provisions for regulating the activities of water service providers, focusing on the roles and functions of the various water service institutions responsible for providing water and sanitation services. The key objective is to ensure the effective partnerships between various water institutions so as to ensure the sustainable water use in the country. The WSA of 1997 declares that every person has a right of access to a basic water supply and basic sanitation and it is the part of service providers to take reasonable measures to realise these rights (WSA, 1997). The main objectives of this Act are to provide for (WSA 1997; Thompson, 2006 p. 205-206):
- The right of access to basic water supply and the right to basic sanitation necessary to secure sufficient water and an environment not harmful to human health or well-being
- The setting of national standards and norms and standards for tariffs in respect of water services (Chapter 2)
- The preparation and adoption of water services development plans by water services authorities (Chapter 3)
- A regulatory framework for water services institutions and water services intermediaries (Chapters 4 and 5)
- The establishment and disestablishment of water boards and water services committees and their duties and powers (Chapters 6 and 7)
- The monitoring of water services and intervention by the Minister and the different members of the Executive Councils responsible for local government in all the provinces (Chapter 8)
- Financial assistance to water service institutions (Chapter 9)
- The gathering of information in a national information system and the distribution of that information (Chapter 10)
- The accountability of water service providers
- The promotion of effective water resource management and conservation.
Citizens who are poor and cannot pay for water are entitled to free basic water use as per the Water Services Act; that is, about 25 ℓ per person per day. The issue has gone to court, which ruled in favour of people's rights to free basic water, thus requiring the state to make arrangements for this (Tewari, 2008). By June 2008, some 41.7 m. people out of a population of 49.4 m. were served with free basic water (Tewari, 2008). This is an impressive achievement for a new democracy like South Africa. It is estimated that implementing the free basic water policy could cost about ZAR8/kℓ for treatment of water and thus a free allocation of 6 kℓ/month would cost roughly ZAR50/household each month (Muller, 2008). Durban Municipality provides 6000 ℓ/household to all without any charge. Similar trends are followed elsewhere in the country.
The new water laws thus recognise that water is a very scarce resource which needs to be used efficiently and equitably. Treating water as a public good gave the legislators the power to regulate who gets water in what quantities. However, the laws also recognise that efficient allocation can only be achieved though market forces and true scarcities of water can only be reflected by price. Part of this policy is that it regards water as a scarce resource and therefore hedonistic users should be made to pay. As a result of this view, stepped tariffs and penalties for excessive water use are advocated alongside life supplies for the poor. Water rights management in this period can best be seen as a mix of demand-side management, increasing block tariffs, cross-subsidies and a minimum amount of free water per month. It is therefore possible to provide the water at a certain price for various users and uses. The concept of 'water marketing' is thus advocated as means of reallocating scarce water supplies in South Africa and the Act may not impede the development of water markets in South Africa (Schwulst, 1995 pp. 38-39).
Drawbacks of the new system of water rights
Although the new system of water rights is far superior to the old one and is in line with international trends in water legislation, or the modern water rights structure, it is not free from drawbacks (Hodgson, 2006; Kidd, 2009). One major drawback of the new system is that of the state as the public trustee of the country's water resources – water allocation is done through a licensing system which increases the administrative burden of DWA. Hence some have described it as 'unnecessarily interventionist legislation' as the efficient allocation of water is finally guided by market forces (Bronstein, 2002 p. 469; Kidd, 2009). Kidd, however, considers this not to be a serious problem and suggests that the temptation to use powers provided by the National Water Act where this is not necessary should be resisted, for all reasons and at all times (Kidd, 2009).
It is to be noted that licences or permits are temporary in nature and are issued at the discretion of the Minister. The permits or licences are not transferable. That means the present owner cannot pass the rights on to his/her successor-in-title. This is especially important with respect to irrigation where an owner may lose interest in developing his/her land. This may decrease long term investment in water infrastructure, in particular in that which is in private hands.
The large bureaucracy required to administer the new law may impede the real purpose of water management if it succumbs to pressure of corruption and non-transparent dealing. This would very largely depend upon the general health of institutional integrity and political systems and the morals of society in general. If the corruption factor goes uncontrolled, it could result in complete failure to meet the ultimate objectives for which the policy and legislative change was initially sought by the democratic government.
Conclusions and policy lessons
The main factors determining the course of development of water rights over the last three and a half centuries in South Africa has been the relatively low water availability (as a factor of climatic conditions and hydrology) compared to rising water demand by various users (ranging from domestic and primary users to secondary users in agriculture, industry, construction and mining). In addition, the demand has been exacerbated due to environmental needs and other international requirements. Various phases can be identified in the evolution of water rights in the history of modern South Africa. Prior to the arrival of the settlers (both Dutch and British), water rights under African customary law were unwritten and only considered as essential when a community came under threat from another encroaching tribe. Otherwise, during this period, water rights like land were not privatised and water was a community resource. The immigration of settlers from Europe introduced a new beginning in terms of re-defining water rights in the country. The 1st phase in the evolution of water rights in South Africa began with the Dutch East India Company rule which opted for the Roman Dutch law. Under this dispensation the status of the Company or state as dominus fluminis to water rights was upheld. During this period, only individuals held temporary and revocable rights to water where such rights did not undermine the Company's access to water. This phase can be said to have been the longest, spanning from 1652 up until British rule in the 1st decade of the 19th century (about 1810). The company treated water as a public commodity and assumed full control of the resource.
The 2nd phase included the period of British control, from the early 19th century up until the beginning of Afrikaner rule (1810 to 1952). The British were more liberal than their predecessors and allowed individual rights over water as with land tenure. This led to the codification of water rights and the granting of riparian rights to individuals. Water sources were defined and categorised in order to systematise the water rights regulations. Differences between private and public river streams were clarified and so were the different rights emanating from them. The British approach to water rights was exactly opposite to that of the Dutch East India Company. The British permitted private rights to water to be held by individuals, unlike the Dutch rulers who treated water as a public commodity. The key legislation of this period was the Irrigation Act of 1912. However, as time passed, the Irrigation Act, despite amendments, became inadequate to cope with the social and industrial progress of the nation.
The 3rd phase in making water laws began with Afrikaner rule or the apartheid period. The 1912 Act that was passed under British rule was repealed and a comprehensive codification of water laws in the form of the Water Act (No. 54 of 1956) was passed. The country at this stage was sufficiently industrialised and urbanised. This required that provision for water should be made available for all sectors. The new law under apartheid rule promoted the segregation of development on different paths for the different races. The 1956 Act did represent a fundamental change in terms of policy direction by regulating the access to and availability of water for the mining and manufacturing industry. Afrikaner nationalists revived the dominus fluminis rule through the principle of government control areas where the control of water was deemed by the Minister to be desirable in the public or national interest.
The 4th phase refers to the current democratic South Africa where the main thrust on water rights is to facilitate access to water for communities which were previously disadvantaged by the deliberate segregation policies. At the same time, the policy aims at providing water to users in such a way that development is promoted without compromising the sustainability of the resource. It implies that water rights in the current phase are more inclusive and focus on development and sustainability within the context of equitable distribution, justice and human dignity. However, water is still res omnium communes with the government through the Minister as trustee. The Minister and the central government are hence given the role of custodian of scarce water resources so as to use it in the best interests of nation and people. Both efficiency and equity are key objectives of this law.
A review of water rights regimes over the last 350 years thus indicates that they have come full circle and have been adapted to be democratic apparatus of economic growth and economic justice. It began with the Dutch rule treating water as a public commodity under complete government control. The British rule brought a complete change in the water rights regime by treating water as a private commodity and introducing riparianism. The Afrikaner nationalists again enforced government control on water use and treated water as a public commodity thus swinging the balance in favour of the dominus fluminis principle. The democratic government basically used a mix of both dominus fluminis and market-based principles to suit the democratic situation and to provide a balance between the societal need to provide water to all and the need to use this scarce resource efficiently. The principles of water demand management are used, so as not to sacrifice economic growth – a sine qua non for increasing social welfare in the long run. A few important policy lessons can be learned from this analysis and are discussed below.
Key policy lessons
First, the analysis of the long history of water rights/laws in South Africa shows clearly that the political apparatus is most important in shaping the water rights structure. A democratic political structure promotes a fairer structure of water rights which are beneficial to all subjects. Colonial rules favoured a certain set of people and thus ignored the overall development of the country. Promotion of democratic regimes in the African continent will improve the overall water rights structure.
Second, since water is an economic good, its efficient use cannot be ignored if people want a sustainable supply of water under any type of political structure in the country. Equity or human rights issues related to water are important in Africa, yet this cannot be simply relegated to an issue of consumption alone. Water is an economically scarce resource and market principles cannot be underemphasised for sustainable development in African countries. The National Water Act in South Africa confirms this assertion by ensuring a framework that will work out a balance between property rights and human rights to water use. Since there are 3 legal forms of right to water: human right, contractual right, and property right (ODI, 2004), the contractual and property rights outweigh the human right in practice. The major problem arises in terms of willingness of the state to enforce the human rights dimension of water use. South African law has taken cognisance of this form and instituted mechanisms to effect this change, although they are not as successful as it was hoped they would be (Tewari, 2008).
Third, water use efficiency is to be enforced by devolving water management in the country at the catchment level. Catchment management agencies are statutory bodies which are responsible for:
- Development of a strategy in the catchment to meet the objectives of the Act
- Management of water resources and coordination of the water-related activities of water users and other water management institutions within the area.
This decentralisation is an important step in managing natural resources such as water and will certainly bring benefits in terms of increased efficiency and equitable distribution of water in the country (Ribot, 2002). The rest of the African continent can emulate some of these principles if it suitstheir needs.
Fourth, in terms of water rights theory, licensing water use is a new way of dispensing water in societies where the human rights form of water use is very critical due to constitutional and historical reasons. Many African countries show such symptoms. Licensing can be a noble innovation in the legal history. However, the efficacy of this method depends upon the institutional efficiency of the state.
Acknowledgements
The author is grateful to anonymous referees for making various suggestions. This version provides a detailed review of events in the South African history of water rights. The work heavily draws from Hall (1939, 1947, 1963), Hall and Fagan (1933), Hall and Burger (1974), DWAF's White Paper on a National Water Policy for South Africa, (DWAF, 1997) and National Water Resource Strategy (DWAF, 2004), Thompson et al. (2005), Thompson (2006) and Kidd (2009).
References
BENNET TW (1995) Human Rights and African Customary Law. Juta and Co, Cape Town. [ Links ]
BLACK P and FISHER BL (2001) Conservation of Water and Related Land Resources (3rd edn.). Lewis Publishers, Bo Raton. [ Links ]
BRONSTEIN V (2002) Drowning in the hole of the doughnut: regulatory overbreadth, discretionary licensing and the rule of law. S. Afr. Law J. 119 (3) 469. [ Links ]
BURMAN SB (1973) Cape Policies Towards African Law in Cape Tribal Territories: 1872-1883. Ph.D. Thesis, University of Oxford. [ Links ]
CAPONERA DA (1998) The importance of water law and institutions for sustainable development. Working paper presented at the INBO workshop on Users' Participation in the Management and Funding of Business Organizations, International Conference on Water and Sustainable Development, 19-23 March, 1998, UNESCO, Paris. [ Links ]
DAVIS NN (1989) A History of Southern Africa. Longman, London. [ Links ]
DE WET (1959) One hundred years of water law. Acta Juridica 1959 31-35. [ Links ]
DE WET JC (1979) Opuscula Miscellanea. Butterworth Press, Durban. [ Links ]
DULY LC (1968) British Land Policy at the Cape, 1795-1844: A Study of Administration Procedures in the Empire. Duke University Press, Durham, N. C. [ Links ]
DWAF (DEPARTMENT OF WATER AFFAIRS AND FORESTRY, SOUTH AFRICA) (1986) Management of the Water Resources of the Republic of South Africa. Department of Water Affairs and Forestry, Pretoria. [ Links ]
DWAF (DEPARTMENT OF WATER AFFAIRS AND FORESTRY, SOUTH AFRICA) (1997) White Paper on a National Water Policy for South Africa.. Department of Water Affairs and Forestry, Pretoria.URL: www.dwaf.gov.za/documents/policies/nwpwp.pdf (Accessed 20 November 2007). [ Links ]
DWAF (DEPARTMENT OF WATER AFFAIRS AND FORESTRY, SOUTH AFRICA) (2004) National Water Resource Strategy. Department of Water Affairs and Forestry, Pretoria.URL: http://www.dwaf.gov.za/documents/policies/NWRS/deafault.htm (Accessed 20 November 2007). [ Links ]
GETZLER J (2004) A History of Water Rights at Common Law. Oxford University Press, London. [ Links ]
GUELKE L and SHELL R (1992) Landscape of conquest: frontier water alienation and Khoikhoi strategies of survival, 1652-1780. J. South. Afr. Stud. 18 (4) 803-824. [ Links ]
HALL CG and FAGAN H (1933) Water Rights in South Africa. Juta, Cape Town. [ Links ]
HALL CG (1939) The Origin and Development of Water Rights in South Africa. Oxford University Press, Oxford. [ Links ]
HALL CG (1947) Water Rights in South Africa (2nd edn.). Oxford University Press, Oxford. [ Links ]
HALL CG (1963) (ed.) Decisions of the Water Courts of the Union of South Africa: From August, 1921 to December, 1928 Inclusive. Juta, Johannesburg. [ Links ]
HALL CG and BURGER AP (1974) Hall on Water Rights in South Africa (4th edn.). Juta, Cape Town. [ Links ]
HAMILTON HALL WM (1898) Report on Irrigation Legislation and Enterprise in American States. Australian Colonies and Several Countries of Europe as Applicable to the Cape Colony. G 45 to 98. WA Richards & Sons, Government Printers, Cape Town. [ Links ]
HODGSON S (2006) Modern Water Rights: Theory and Practice. FAO, Rome, FAO Legislative Study 92. 116 pp. [ Links ]
HODSON TA (1997) South African Land Tenure, Past and Present: A Country Report, University of Maine. URL: http://www.spatial.maine.edu/ -onsurd?landtenure/countryReport/southAfrica.html (Accessed 9 January 2008). [ Links ]
KIDD M (2009) The development of water law. In: Dellapenna JW and Gupta J (eds.) The Evolution of the Law and Politics of Water. Springer Netherlands, Dordrecht. 87-104. [ Links ]
LEE RW (1956) The Elements of Roman Law. Sweet and Maxwell, London. [ Links ]
LEWIS AD (1934) Water Law: Its Development in the Union of South Africa. Juta, Cape Town. [ Links ]
MILTON JRL (1995)() The history of water law, 1652-1912. In: Land and Agriculture Policy Centre, Submission to the Department of Water Affairs and Forestry (unpublished August, 1995). [ Links ]
MULLER M (2001) Transforming Water Law to Achieve South Africa's Development Vision: A Case Study in National Law. Speech delivered on 16 March 2001 by Mike Muller, Director-General, Department of Water Affairs and Forestry, South Africa. URL: www.dwaf.gov.za/communications (Accessed 19 February 2008). [ Links ]
MULLER M (2008) Personal communication. Visiting Adjunct Professor at the Graduate School of Public and Development Management, University of the Witwatersrand. 28 September, 2008. [ Links ]
NKOMAZANA F (1998) Livingstone's ideas of Christianity, commerce and civilization. Botswana J. Afr. Stud 12 (1, 2) 44-57. [ Links ]
NWA (1998) National Water Act (Act No. 36 of 1998). Government Gazette 398 (19182). 26 August 1998, Cape Town, South Africa. [ Links ]
NUNES KD (1975) Sources of public streams in modern South African law. Acta Juridica 1975 298-331. [ Links ]
ODI (OVERSEAS DEVELOPMENT INSTITUTE) (2004) Right to Water: Legal Forms, Political Channels. ODI Briefing Paper, July 2004. Overseas Development Institute, London, [ Links ]
RIBOT JC (2002) Democratic Decentralization of Natural Resources: Institutionalizing Popular Participation. World Resources Institute, Washington, DC. [ Links ]
RSA (REPUBLIC OF SOUTH AFRICA) (1996) The Constitution of the Republic of South Africa. [ Links ]
SANCID (SOUTH AFRICAN NATIONAL COMMITTEE ON IRRIGATION AND DRAINAGE ) (2009) Country Profile- South Africa. URL: http://www.icid.org/cp_Safrica.html (Accessed 20 May, 2009). [ Links ]
SCHWULST L (1995) Water meters: legal requirements for trade use water meters in South Africa. IMIESA 20 (9) 38-39. [ Links ]
STEIN R (2002) Water sector reform in Southern Africa: some case studies. In: Turton AR and R Henwood R (eds.) Hydropolitics in the Developing World: A Southern African Perspective. African Water Issues Research Unit, Pretoria. 113-123. [ Links ]
STEIN R (2005) Water law in a democratic South Africa: a country case study examining the introduction of a public rights system. Texas Law Rev. 83 (7) 2167-2183. [ Links ]
TEMPLE J (2005) Dual economy models: a primer for growth economists. The Manchester School 73 (4) 435-478. [ Links ]
TEWARI DD (2005) A brief historical analysis of water rights in South Africa. Water Int. 30 (4) 438-445. [ Links ]
TEWARI DD (2008) Engendering economic development through enforcement of justiciable human rights to water in South Africa. Paper presented at the 2nd World Aqua Congress, 26-28 November, Delhi, India. [ Links ]
TEWARI DD and KUSHWAHA RL (2007) Socio-economics of groundwater management in Limpopo, South Africa: poverty reduction potential and resource management challenges. Water Int. 33 (1) 69-85. [ Links ]
THOMPSON H (2006) Water Law: A Practical Approach to Resource Management and the Provision of Services. Juta, Cape Town. [ Links ]
THOMPSON H, STIMIE CM, RICHTERS E and PERRET S (2001) Policies, Legislation and Organizations Related to Water in South Africa with Special Reference to the Olifants River Basin. Working Paper No. 18 (South Africa Working Paper No. 7), International Water Management Institute, Colombo. [ Links ]
TLOU T, MOSAKA D, PERRET S, MULLINS D and WILLIAMS CJ (2006) Investigation of Different Farm Tenure Systems and Support Structures for Establishing Small-Scale Irrigation in Long Term Viable Conditions. WRC Report No. 1353/1/06, Water Research Commission, Pretoria, South Africa. 174 pp. [ Links ]
TURTON AR, MEISSNER R, MAMPANE PM and SEREMO O (2004) A Hydropolitical History of South Africa's International River Basins. WRC Report No. 1220/1/04. Water Research Commission, Pretoria, South Africa. [ Links ]
TURTON AR, SCHULTZ C, BUCKLE H, KGOMONGOE M, MALUGANI T and DRACKNER M (2006) Gold, scorched earth and water: the hydropolitics of Johannesburg. Water Resour. Dev. 22 (2) 313-335. [ Links ]
UYS M (1996) A Structural Analysis of the Water Allocation Mechanism of the Water Act 54 of 1956 in the Light of the Requirements of Competing Water User Sectors with Special Reference to the Allocation of Water Rights for Ecobiotic Requirements and the Historical Development of the South African Water Law, Volume II. WRC Report No. 406/2/96. Water Research Commission, Pretoria, South Africa. [ Links ]
VAN DER MERWE F (2000) Registration and licensing of water-use: water feature. SA Irrig. 22 16-18. [ Links ]
VAN KOPPEN BCM (2005) The relevance of the histories of water laws in Europe and its former colonies for the rural poor today. Paper presented at the Workshop on African Water Laws, 26-28 January, 2005, Johannesburg, South Africa, [ Links ].
VOS WJ (1978) Elements of South African Water Law (2nd edn.) Juta, Cape Town. [ Links ]
WATER ACT (1956) Water Act (Act No. 54 of 1956). Republic of South Africa. [ Links ]
WIEL SC (1909) Running water. Harv. Law Rev. 22 (3) 190-215. [ Links ]
WLRP (WATER LAW REVIEW PANEL) (1996) Fundamental Principles and Objectives for a New Water Law in South Africa. Report to the Minister of Water Affairs and Forestry of the Water Law Review Panel. January 1996, Pretoria. [ Links ]
WSA (1997). Water Services Act (Act No. 108 of 1997). Government Gazette 390 (18522). 19 December 1997. Republic of South Africa, Cape Town. [ Links ]
Received 18 December 2008; accepted in revised form 9 September 2009.
# Revised version. Paper originally presented at the International Water History Association (IWHA) 2nd Conference, 10-12 August 2001, University of Bergen, Norway, and published as a chapter by Tewari DD (2005) An evolutionary history of water rights in South Africa, Water World, IWHA. 157-182.
* To whom all correspondence should be addressed.
+2731 2608046; fax: +2731 2608339;
e-mail: devitewari@yahoo.com or Tewari@ukzn.ac.za
Distribution and habitats of Melanoides tuberculata (Müller, 1774) and M. victoriae (Dohrn, 1865)(Mollusca: Prosobranchia: Thiaridae) in South Africa
KN de KockI, *; CT WolmaransII
IUnit for Environmental Sciences and Management, Potchefstroom Campus of the North-West University, Private Bag X6001, Potchefstroom 2520, South Africa
IISchool of Environmental Sciences and Development, Zoology, Potchefstroom Campus of the North-West University, Private Bag X6001, Potchefstroom 2520, South Africa
ABSTRACT
An account is given of the geographical distribution and habitats of Melanoides tuberculata (Müller, 1774) and M. victoriae (Dohrn, 1865) as reflected by the samples on record in the database of the National Freshwater Snail Collection (NFSC) of South Africa. About 30 species of Melanoides occur in Africa of which only M. tuberculata is widespread. Melanoides tuberculata is also indigenous to India and the south-east Asian mainland to northern Australia and was widespread in the present-day Sahara during the late Pleistocene-Holocene, but M. victoriae seems to be restricted to Southern Africa. Details of the habitats on record for each species, as well as mean altitude and mean annual air temperature and rainfall for each locality, were processed to determine chi-square and effect-size values. An integrated decision-tree analysis indicated that temperature, altitude and type of substratum were the most important factors of those investigated that played a significant role in establishing the geographical distribution of these species in South Africa. In view of the fact that M. tuberculata can serve as intermediate host for a number of trematode species elsewhere in the world, it is recommended that the ability of the 2 local Melanoides species to act as intermediate hosts should be investigated. Due to the fact that the majority of sites from which these species were recovered were not since revisited, it is recommended that efforts should be made to update their geographical distribution and the results compared with the data in the database. The conservation status of these 2 species and the possible influence of global warming and climatic changes on their geographical distribution are briefly discussed.
Keywords: Melanoides tuberculata, Melanoides victoriae, geographical distribution, habitat preferences, biological control, Trematoda, freshwater Mollusca, South Africa
Introduction
The genus Melanoides is evidently restricted to the Old World tropics (Pilsbry and Bequaert, 1927) and about 30 species occur in Africa of which only M. tuberculata (Müller, 1774) is widespread (Brown, 1994). Melanoides tuberculata was described from the Coromandel coast of India in 1774 and its present-day distribution is the Indo-Pacific region, Southern Asia, Arabia, northern Australia, Near East and much of Africa (Appleton, 2002) and was also introduced into the Caribbean area (Brown, 1994). With regard to South Africa, only 2 species, namely M. tuberculata and M. victoriae (Dohrn, 1865) have been reported of which the former is the most widespread according to the records of the National Freshwater Snail Collection (NFSC). While M. tuberculata was also widespread in the present-day Sahara (Van Damme, 1984) M. victoriae seems to be restricted to Southern Africa (Brown, 1994; Appleton, 2002).
Melanoides tuberculata has proved to be a compatible intermediate host for several trematode species elsewhere in the world and shedding of cercariae of a number of trematode families has also been recorded for this snail species elsewhere in Africa (Frandsen and Christensen, 1984). It has become invasive after its introduction into new territories such as Martinique Island (Pointier, 2001) and Brazil (Rocha-Miranda and Martins-Silva, 2006) but also proved to be an efficient and sustainable bio-control agent of Biomphalaria glabrata (Say, 1818) the intermediate host snail of the intestinal schistosome parasite in these areas.
This paper focuses on the geographical distribution and habitat preferences of M. tuberculata and M. victoriae as reflected by the data in the database of the NFSC. In view of the fact that the records in the NFSC span a period of several decades the possible influence of global warming and climatic changes on the geographical distribution of these species in South Africa and their conservation status is briefly discussed.
Methods
Data from 1956 to the present (2009) on the geographical distribution and habitats of M. tuberculata and M. victoriae as recorded at the time of the survey were extracted from the NFSC database. Only those samples that could be located on a 1:250 000 topo-cadastral map series of South Africa were included in the analyses. The majority of these samples were collected during surveys conducted by government and local health authority staff, as well as staff of the former Snail Research Unit at the Potchefstroom University (now the North-West University). The number of loci ( degree squares) in which the collection sites were located, was distributed in intervals of mean annual air temperature and rainfall, as well as intervals of mean altitude to illustrate the frequency of occurrence of these species in water-bodies falling within specific intervals. Rainfall, temperature and altitude data were obtained in 2001 from the Computing Centre for Water Research (CCWR), University of KwaZulu-Natal (disbanded since). All mollusc species in the database were ranked in order of their association with low to high climatic temperatures according to a temperature index calculated from their frequencies of occurrence within selected temperature intervals. The method of calculation is dealt with in detail in our earlier publications (De Kock and Wolmarans, 2005a; b). To determine the significance in differences between frequency of occurrence in, on, or at the range of options for each factor investigated, chi-square values (Statistica, Release 7, Nonparametrics, 2X2 Tables, McNemar, Fischer exact) were calculated. An effect size was also calculated (Cohen, 1977) for each parameter investigated to evaluate the importance of its contribution towards establishing the geographical distribution of this species as reflected by the samples in the NFSC database. The method of calculation is explained with reference to the 14 different water-body types represented in the database. The first step is to determine the total number of times each water-body type, for instance rivers (7 507), was reported for all the different mollusc species in the database and then to sum the total number of records of all the water-bodies reported for all the species in the database (28 956). To determine the p value for each of the different water-body types, for instance for rivers as such, the frequency of occurrence of all species in rivers (7 507) is divided by the total number of times (28 956) all the water-bodies were recorded in the database. The total number of times a specific mollusc species was reported from all 14 water-bodies together is then summed (this figure for M. tuberculata, for instance, was 228). The number of times a specific species was reported from a specific water-body type is then designated as 'A'. To determine a value designated as 'B' the number of times a specific species was reported from a specific water-body, for instance rivers (79), is multiplied by the p value calculated for rivers (0.259). This is done for all the different water-body types from which this specific species was reported. Chi-square values (x2 ) for each type of water-body are then calculated as follows:

The chi-square values calculated for all the different water-body types are then summed and the effect size (w) for water-bodies as such is then calculated as follows: square root of Σx2 divided by ΣA. Values for this index in the order of 0.1 and 0.3 indicate small and moderate effects respectively, while values of 0.5 and higher point to practically significant and large effects (Cohen, 1977). More details of the significance and interpretation of specific values calculated for this statistic in a given situation, are discussed in our earlier publications (De Kock and Wolmarans, 2005a; b).
A decision tree which is a multivariate analysis (Breiman et al., 1984) was also constructed from the data which enables the selection and ranking of those parameters that played the most important role in establishing the documented geographical distribution of these species, based on the data in the database. The frequencies of occurrence within the different options for a specific parameter which do not differ significantly from one another, are grouped together in the decision-tree analysis. If, for instance, the frequency of occurrence in rivers does not differ significantly from that in streams, these 2 options for water-bodies are grouped together in the decision tree analysis. In addition, the total number of times any other mollusc species in the database was recorded under a specific condition is also displayed in the results of the decision tree analysis. This analysis was done with the SAS Enterprise Miner for Windows NT Release 4.0, April 19, 2000 programme and Decision Tree Modelling Course Notes (Potts, 1999).
Results
The collection sites of the 305 samples of M. tuberculata fell within 85 and the 53 sites of M. victoriae within 21 different loci (Fig. 1). The former species was recovered from 12 of the 14 water-body types represented in the database while the latter species were found in only 6 (Table 1). Although the majority of samples of both species were recovered from rivers the highest percentage occurrence (5.9%) in the total number of collections in a specific water-body for M. tuberculata (0.9%) was realised in channels and that for M. victoriae in concrete dams (Table 1). An effect-size value of larger than 0.5 was calculated for both species for water-bodies as such (Table 1). The majority of samples of both species were recovered from water-bodies described as perennial, with clear, freshwater (Table 2). While the largest number of samples of M. tuberculata came from habitats with standing water, M. victoriae was more frequently collected in slow running water and a relatively large effect size was calculated for this parameter (Table 2).

The majority of samples of M. tuberculata was recovered from water-bodies of which the substratum was described as either muddy or sandy while equal numbers of samples of M. victoriae were collected on stony and sandy substrata (Table 3). A large effect size (w = 0.5) was calculated for substratum types for both species (Table 3).
With regard to the frequency of occurrence within the different temperature intervals, the highest percentage of samples of M. victoriae was recorded from the 16ºC to 20ºC interval, while habitats falling within the 21ºC to 25ºC interval yielded the highest number of samples of M. tuberculata (Table 4). There was, however, no significant difference (p < 0.05) between the frequency of occurrence of M. victoriae in habitats falling within the 16ºC to 20ºC and 21ºC to 25ºC intervals. The temperature indexes calculated for all the species in the database and statistical analysis of the data are presented in Table 5. More than 80% of the samples of both species were collected in sites which fell within the 2 rainfall intervals ranging from 301 to 900 mm (Table 4). While the largest number of samples of M. tuberculata was collected in sites which fell within the 0 to 500 m altitude interval, the majority of samples of M. victoriae came from sites which fell within the 501 to 1 000 m interval (Table 4). There was, however, no significant difference (p < 0.05) between the frequency of occurrence of M. victoriae in habitats falling within the 0 to 500 and the 501 to 1 000 m intervals.
The results of the decision tree analyses for M. tuberculata and M. victoriae are depicted in Figs. 2 and 3 respectively.

Discussion
The 85 loci from which the 305 samples of M. tuberculata were recovered, display a continuous distribution all along the eastern border of South Africa from Limpopo Province down to the southern border of KwaZulu-Natal Province (Fig. 1). It is discontinuously spread through the north-western part of Limpopo and a focus of 6 loci occurs on the border of North West and Gauteng. The occurrence of this species in 2 isolated loci in the Northern Province far outside its endemic range of distribution seems rather unusual. However, samples of M. tuberculata, closely associated with Biomphalaria pfeifferi (snail intermediate host of Schistosoma mansoni) were recovered on more than one occasion from the Kuruman River and its eye (source) situated in these loci in the Kuruman district. The presence of freshwater snails in dolomitic springs in South Africa far outside their endemic range of distribution is discussed in detail in De Kock and Wolmarans (2004a). These springs usually have a stabilising effect on both water temperature and water supply, factors which play an important role in making water-bodies suitable for colonisation by freshwater snails outside their endemic range of distribution.
Owing to the fact that the geographical distribution of both M. tuberculata and M. victoriae displays a westerly arm extending from the eastern part of South Africa, they are classified as broadly tropical by Brown (1978) compared to narrowly tropical species having no westerly arm. However, from the effect sizes calculated for the temperature indexes (Table 5) it is evident that M. tuberculata did not differ significantly in respect of its association with warm climatic temperatures (d < 0.5) from 10 of the 12 species classified as narrowly tropical by Brown (1978).
According to Brown (1994) the southern limit of the distribution of M. tuberculata in the eastern part of South Africa lies near Port Elizabeth. However, despite the fact that we have many records of other freshwater mollusc species in the database of which the southern limits of distribution extend even further than Port Elizabeth (De Kock et al., 1989; De Kock et al., 2001; De Kock et al., 2002a; De Kock and Wolmarans, 2004b; De Kock and Wolmarans, 2005c; De Kock and Wolmarans, 2007), we have none for this species extending further southwards than the southern border of KwaZulu-Natal. Twelve of the 21 loci on record for M. victoriae are shared with M. tuberculata; however, it is not as widespread as the latter species (Fig. 1). Appleton (2002) mentions that M. victoriae is not known from KwaZulu-Natal; however, we have 4 samples on record from this Province collected during 1965 and 1966 which is now reported for the first time.
The fact that M. tuberculata was recovered from 12 of the 14 water-body types represented in the database (Table 1) confirms the report by Brown (1994) that it can utilise various permanent water-bodies including rivers, shallow seepages and man-made habitats. In contrast to this, M. victoriae was reported from only 6 different water-body types and obviously seemed to prefer perennial rivers (Tables 1 and 2) which is the only water-body type mentioned for this particular species for the Mpumalanga Lowveld by Brown (1994). The 5 samples on record for M. tuberculata from habitats with brackish water also support the report by Brown (1994) that this species is tolerant of moderate brackishness in coastal localities. According to this author M. tuberculata is not found in temporary waters; however, we have 14 samples on record in the database reported from seasonal habitats for this species and also 1 sample of M. victoriae from a temporary habitat (Table 2). Although more samples of M. tuberculata were reported from water-bodies with standing water than with slow running water (Table 2) no significant differences could be indicated between these alternatives. In contrast more samples of M. victoriae were recovered from water-bodies with slow running water than with standing water (Table 2) and in this instance a significant difference (p< 0.05) could be indicated. From the effect values calculated for water velocity it is evident, however, that this factor played a much more important role in determining the presence, or not, of M. victoriae in a specific water-body. The majority of samples of both species were reported from water-bodies with water described as clear (Table 2) but no significant differences were found between their occurrence in habitats with clear or muddy water and the effect sizes calculated for this parameter also indicated that turbidity did not play an important role in determining the suitability of a given water-body.
Nearly 78% of the samples of M. tuberculata were recovered from loci which fell within the temperature interval ranging from 21ºC to 25ºC while the interval ranging from 16ºC to 20ºC yielded the largest number of samples of M. victoriae (Table 4). These results are supported by the temperature indexes calculated for these 2 species which indicated that the former species not only seemed more closely associated with warmer climatic temperatures but the effect sizes calculated for these indexes also showed that it differed significantly (d > 0.5) from M. victoriae in this respect (Table 5). Although only 4 samples of M. tuberculata were recovered from sites which fell within the temperature interval ranging between 26ºC and 30ºC it represented 10.8% of the total number of collections of all molluscs in the database from sites falling within this specific temperature interval (Table 4 and Fig. 2). This also points to a relatively close association with higher climatic temperatures.
From the effect-size values calculated for the various parameters investigated (Tables 1 to 4) it can be deduced that temperature, altitude, substratum and water-bodies, played an important role in establishing the geographical distribution of both species as reflected by the data in the database of the NFSC. This deduction is supported by the results of the decision tree analyses (Figs. 2 and 3) which selected temperature, altitude and substratum as the most important factors which had significantly influenced the geographical distribution of both species. From the decision tree analyses it can further be seen that a substratum consisting of mainly decomposing material played a significant role in the habitats from which samples of M. tuberculata were recovered (Fig. 2).
With regard to their habitat preferences it can be concluded that both species seemed to prefer perennial rivers in areas which fell within the temperature intervals ranging from 16ºC to 25ºC and altitude intervals ranging from 500 to 1 500m a.m.s.l. However, the results in Table 1 suggest that M. victoriae is considerably more stenoecious than M. tuberculata. Current velocity in a water-body and mean yearly rainfall also seemed to play a significant role in the presence or not of the former species in a specific area (Tables 2 and 4).
As mentioned earlier M. tuberculata has become invasive after introduction into new areas such as Martinique Island (Pointier, 2001) and Brazil (Rocha-Miranda and Martins-Silva, 2006) but fortunately in both these cases it proved to be an efficient and sustainable control agent of intermediate host snails responsible for the transmission of schistosomiasis to humans. Apparently this is not the case in South Africa because we have a number of samples on record in the database of the NFSC, amongst others from the Kruger National Park, where persistent populations of both the local schistosome intermediate host snail species and populations of M. tubercuata have co-existed in the same water-body through several decades.
Although numerous cases of M. tuberculata becoming a nuisance species in tropical fish aquaria have been reported in literature, we are not aware of any case recorded in literature of this species causing problems in natural water-bodies in South Africa. According to Appleton (2002), however, it has become plentiful in rice paddies in KwaZulu-Natal and we were recently approached for advice on a case where M. tuberculata had proliferated to such an extent after invading the heat exchanger of an electric power-plant that it caused complete clogging of the filters, resulting in malfunctioning of the entire system.
Countrywide surveys for freshwater molluscs was terminated during the early 1980s and on account of the fact that many of the positive sites were not revisited, comments on the conservation status of our mollusc fauna should be made with circumspection. However, Melanoides localities reported from the Kruger National Park by Oberholzer and Van Eeden (1967) have since been revisited in surveys conducted by ourselves in 1995 (De Kock and Wolmarans, 1998), 2001 (De Kock et al., 2002b) and 2006 (Wolmarans and De Kock, 2006) and a marked decline in positive localities, as well as in population size, were evident for both species. Whereas Oberholzer and Van Eeden (1967) reported 34 and 20 positive sites for M. tuberculata and M. victoriae respectively, only 4 sites and 1 site for these species, respectively, were found positive during our extensive survey in 2006. The only prosobranch snail that was encountered in large numbers in some of the sites during our 2006 survey was the exotic invader species Tarebia granifera which was reported for the first time in Africa by Appleton and Nadasan (2002). According to Pointier and McCullough (1989) this species has demonstrated its capacity to invade and rapidly colonize a wide range of water-body types on numerous islands and countries in the Neotropical area and succeeded in reducing and even eliminating populations of other mollusc species. Whether the invasion of water-bodies in the Kruger National Park by this exotic species could have a bearing on the observed decline in positive sites of both Melanoides spp. needs further investigation.
From the literature it is clear that M. tuberculata can serve as intermediate host for several trematode species which can be harmful to a number of vertebrate species, including man. These include amongst others, Clonorchis sinensis, the Oriental liverfluke (Lun et al., 2005) and Philopthalmus gralli, a trematode infecting the eyes of bird species but also reported infecting humans (Díaz et al. 2002). Melanoides tuberculata was also proved to be a compatible intermediate hosts for Gastrodiscus aegyptiacus, the fluke responsible for gastrodiscosis in equine populations in Zimbabwe (Mukaratirwa et al., 2004) and Calicophoron microbothrium another trematode fluke of veterinary importance in that country (Chingwena et al., 2002). Furthermore, specimens of M. tuberculata infected with larval stages of economically important intestinal flukes of the family Heterophyidae were reported from the Rio de Janeiro metropolitan area, Brazil (Bogéa et al., 2005). Melanoides tuberculata was also reported from Australia as the intermediate host of the trematode, Transotrema licinum an ectoparasite of several fish species (Manter, 1970) and evidence was also put forward by Frandsen and Christensen (1984) that M. tuberculata could be an important intermediate host for several fluke species. Shedding of non-schistosome cercariae was also reported for M. tuberculata from the Msambweni area, Coast Province, Kenya (Kariuki et al., 2004).
Due to the fact that M. tuberculata is relatively easy to cultivate and maintain in the laboratory, it has been utilised locally as bio-indicator to assess biological effects of diffuse sources of pollutants in a wetland system (Wepener et al., 2005) and in comparative studies in the laboratory on the uptake and effects of heavy metals on cellular energy and allocation (Moolman et al., 2007). Studies on the life cycle and growth of M. tuberculata were also conducted in a natural habitat in Mpumalanga (Appleton, 1974). To our knowledge, however, the capacity of representatives of the 2 local Melanoides species to serve as intermediate hosts for parasitic flukes has not yet been investigated. However, after eggs resembling those of Paragonimus kellicotti, a lung fluke infecting cats and dogs, were reported from humans and cats in KwaZulu-Natal (Proctor and Gregory, 1974), circumstantial evidence implicated M. tuberculata as the intermediate host because it was the only prosobranch snail that could be found in the area at that stage.
In view of the important role played by M. tuberculata in the epidemiology of a number of trematode species of medical and veterinary importance elsewhere in the world, it is recommended that the ability to act as intermediate hosts for economically important trematode flukes of both the Melanoides species occurring in South Africa should be investigated. At the same time efforts should be made to update the geographical distribution of both species and to compare the results with existing records in the database of the NFSC to evaluate their conservation status. The ability of M. tuberculata to aestivate was listed as a poor by Brown (1994) and the fact that perennial rivers seemed to be the water-body of preference for both species could be a disadvantage for their long-term survival. Increased evaporation of surface water due to global warming could have a detrimental effect on the permanency of such water-bodies and suitable habitats could become less available which in turn could impact negatively on their geographical distribution and conservation status in this country. As mentioned earlier M. victoriae seemed to be considerably more stenoecious than M. tuberculata and therefore more prone to be affected by changes in environmental conditions. Taking into account the relatively limited geographical distribution reported for M. victoriae and the results of our recent surveys in the Kruger National Park, the conservation status of this species could justifiably be considered as vulnerable.
Acknowledgements
The authors wish to thank the following persons for their assistance in processing the data: Professors HS Steyn, head of the Statistical Consulting Service and DA de Waal of the Centre for Business Mathematics and Informatics of the North-West University, Potchefstroom Campus. We are also indebted to the North-West University for financial support and infrastructure.
References
APPLETON CC (1974) The population fluctuation of five fresh-water snail species in the Eastern Transvaal Lowveld, and their relationship to known bilharzia transmission patterns. S. Afr. J. Sci. 70 145-150. [ Links ]
APPLETON CC (2002) Mollusca. In: De Moor IJ and Day JA (eds.) Guides to the Freshwater Invertebrates of Southern Africa (Volume 6) Chapter 3: Arachnida & Mollusca, Araneae, Water Mites & Mollusca. WRC Report No. 182/02. Water Research Commission, Pretoria, South Africa. 42-125. [ Links ]
APPLETON CC and NADASAN DS (2002) First report of Tarebia granifera (Lamarck, 1816) (Gastropoda: Thiaridae) from Africa. J. Moll. Stud. 68 399-402. [ Links ]
BOGÉA T, CORDEIRO FM and DE GOUVEIA JS (2005) Melanoides tuberculatus (Gastropoda: Thiaridae) as intermediate host of Heterophyidae (Trematoda: Digenea) in Rio de Janeiro metropolitan area, Brazil. Rev. Inst. Med. Trop. São Paulo. 47 87-90. [ Links ]
BREIMAN L, FRIEDMAN JH, OLSHEN RA and STONE CJ (1984) Classification and Regression Trees. Chapman and Hall. [ Links ]
BROWN DS (1978) Freshwater molluscs: In: Werger MJA (ed.) Biogeography and Ecology of Southern Africa. Junk, The Haque, The Netherlands. 1153-1180. [ Links ]
BROWN DS (1994) Freshwater Snails of Africa and their Medical Importance (revised 2nd edn.). Taylor & Francis, London. [ Links ]
CHINGWENA G, MUKARATIRWA S, KRISTENSEN TK and CHIMBARI M (2002) Susceptibility of freshwater snails to the amphistome Calicophoron microbothrium and the influence of the species on susceptibility of Bulinus tropicus to Schistosoma haematobium and Schistosoma mattheei infections. J. Parasitol. 88 880-883. [ Links ]
COHEN J (1977) Power Analysis for the Behaviour Sciences (revised edn.). Academic Press, Orlando, USA. [ Links ]
DE KOCK KN, JOUBERT PH and PRETORIUS SJ (1989) Geographical distribution and habitat preferences of the invader freshwater snail species Lymnaea columella (Mollusca: Gastropoda) in South Africa. Onderstepoort J. Vet. Res. 56 271-275. [ Links ]
DE KOCK KN and WOLMARANS CT (1998) A re-evaluation of the occurrence of freshwater molluscs in the Kruger National Park. Koedoe 41 1-8. [ Links ]
DE KOCK KN and WOLMARANS CT (2004a) Distribution and habitats of Biomphalaria pfeifferi, snail intermediate host of Schistosoma mansoni, in South Africa. Water SA 30 29-36. [ Links ]
DE KOCK KN and WOLMARANS CT (2004b) Verspreiding en habitats van Gyraulus connollyi, slaktussengasheer van ingewandsbotte van die familie Echinostomatidae, in Suid-Afrika. S. Afr. Tydskr. Natuurwet. Teg. 23 79-86. [ Links ]
DE KOCK KN and WOLMARANS CT (2005a) Distribution and habitats of the Bulinus africanus species group, snail intermediate hosts of Schistosoma haematobium and S. mattheei in South Africa. Water SA 31 117-126. [ Links ]
DE KOCK KN and WOLMARANS CT (2005b) Distribution and habitats of Bulinus depressus and possible role as intermediate host of economically important helminth parasites in South Africa. Water SA 31 491-496. [ Links ]
DE KOCK KN and WOLMARANS CT (2005c) Distribution, habitats and role as intermediate host of the freshwater snail, Bulinus forskalii, in South Africa. Onderstepoort J. Vet. Res. 72 165-174. [ Links ]
DE KOCK KN and WOLMARANS CT (2007) Verspreiding en habitats van Ceratophallus natalensis (Mollusca: Planorbidae) in Suid-Afrika. S. Afr. Tydskr. Natuurwet. Teg. 26 109-119. [ Links ]
DE KOCK KN, WOLMARANS CT, BORNMAN M and MAREE DC (2002a) Verspreiding en habitats van Bulinus tropicus, tussengasheerslak van die peervormige bot, Calicophoron microbothrium, in Suid-Afrika. S. Afr. Tydskr. Natuurwet. Teg. 21 114-120. [ Links ]
DE KOCK KN, WOLMARANS CT and DU PREEZ LH (2002b) Freshwater mollusc diversity in the Kruger National Park: a comparison between a period of prolonged drought and a period of exceptionally high rainfall. Koedoe 45 1-11. [ Links ]
DE KOCK KN, WOLMARANS CT, STRAUSS HD and KILLIAN M (2001) Verspreiding en habitats van Lymnaea natalensis, tussengasheerslak van die lewerbot Fasciola gigantica, in Suid-Afrika. S. Afr. Tydskr. Natuurwet. Teg. 20 49-53. [ Links ]
DÍAZ MT, HERNÁNDEZ LE and BASHIRULLAH AK (2002) Experimental life cycle of Philophtalmus gralli (Trematoda: Philopthalmidae) in Venezuela. Rev. Biol. Trop. 50 629-641. [ Links ]
FRANDSEN F and CHRISTENSEN NØ (1984) An introductory guide to the identification of cercariae from African freshwater snails with special reference to cercariae of trematode species of medical and veterinary importance. Acta Trop. 41 181-202. [ Links ]
KARIUKI HC, CLENNON JA, BRADY MS, KITRON U, STURROCK RF, OUMA JH, NDZOVU STM, MUNGAI P, HOFFMAN O, HAMBURGER J, PELLEGRINI C, MUCHIRI EM and KING CH (2004) Distribution patterns and cercarial shedding of Bulinus nasutus and other snails in the Msambweni area, Coast Province, Kenya. Am. J. Trop. Med. Hyg. 70 449-456. [ Links ]
LUN Z-R, GASSER RB, LAI D-H, LI A-X, ZHU X-Q, YU X-B and FANG Y-Y (2005) Clonorchiasis: a key foodborne zoonosis in China. Lancet Infec. Dis. 5 31-41. [ Links ]
MANTER HW (1970) A new species of Transversotrema (Trematoda: Digenea) from marine fishes of Australia. J. Parasitol. 56 486-489. [ Links ]
MOOLMAN L, VAN VUREN JHJ and WEPENER V (2007) Comparative studies on the uptake and effects of cadmium and zinc on the cellular energy allocation of two freshwater gastropods. Ecotoxicol. Environ. Saf. 68 443-450. [ Links ]
MUKARATIRWA S, MUNJERE IF, TAKAWIRA M and CHINGWENA G (2004)Susceptibility of seven freshwater gastropod species in Zimbabwe to infection with Gastrodiscus aegyptiacus (Cobbold, 1876) Looss, 1896. S. Afr. Vet. Ass. 75 186-188. [ Links ]
OBERHOLZER G and VAN EEDEN JA (1967) The freshwater molluscs of the Kruger National Park. Koedoe 10 1-42. [ Links ]
PILSBRY HA and BEQUAERT J (1927) The aquatic molluscs of the Belgian Congo, with a geographical and ecological account of Congo malacology. Bull. Amer. Mus. Nat. Hist. 53 69-602. [ Links ]
POINTIER J-P (2001) Invading freshwater snails and biological control in Martinique Island, French West Indies. Mem. Inst. Oswaldo Cruz 96 67-74. [ Links ]
POINTIER J-P and McCULLOUGH F (1989) Biological control of the snail hosts of Schistosoma mansoni in the Caribbean area using Thiara spp. Acta Tropica 46 147-155. [ Links ]
POTTS WJE (1999) Decision Tree Modeling Course Notes. SAS Institute Inc., Cary, USA. [ Links ]
PROCTOR EM and GREGORY MA (1974) An ultrastructural study of ova of Paragonimus species from human and cat faeces. S. Afr. Med. J. 48 1947-1948. [ Links ]
ROCHA-MIRANDA F and MARTINS-SILVA MJ (2006) First record of the invasive snail Melanoides tuberculatus (Gastropoda: Prosobranchia: Thiaridae) in the Paranã River basin, GO, Brazil. Braz. J. Biol. 66 1109-1115. [ Links ]
VAN DAMME D (1984) The Freshwater Mollusca of Northern Africa, Distribution, Biogeography and Palaeoecology. W Junk, Dordrecht, the Netherlands. [ Links ]
WEPENER V, VAN VUREN JHJ, CHATIZA FP, MBIZI Z, SLABBERT L and MASOLA B (2005) Active biomonitoring in freshwater environments: early warning signals from biomarkers in assessing biological effects of diffuse sources of pollutants. Phys. Chem. Earth 30 751-761. [ Links ]
WOLMARANS CT and DE KOCK KN (2006) The current status of freshwater molluscs in the Kruger National Park. Koedoe 49 39-44. [ Links ]
Received 4 November 2008; accepted in revised form 28 August 2009.
* To whom all correspondence should be addressed.
+2718 299-2380; fax: +2718 299-2370;
e-mail: kenne.dekock@nwu.ac.za
Nitrate-nitrogen removal with small-scale reverse osmosis, electrodialysis and ion-exchange units in rural areas
J Schoeman*
University of Pretoria, Department of Chemical Engineering, Water Utilisation Division, Pretoria 0002, South Africa
ABSTRACT
The nitrate-nitrogen concentration in water supplied to clinics in Limpopo Province is too high to be fit for human consumption (35 to 75 mg/ℓ NO3-N). Therefore, small-scale technologies (reverse osmosis, ion-exchange and electrodialysis) were evaluated for nitrate-nitrogen removal to make the water potable (< 10 mg/ℓ NO3-N). It was found that the reverse osmosis process should function well for nitrate-nitrogen removal. Nitrate-nitrogen could be reduced from a concentration of 35 to 43 mg/ℓ in 1 case to a concentration of between 1.4 and 5.5 mg/ℓ in the treated water. In another case it could be reduced from 54 to 72 mg/ℓ to 12 to 17 mg/ℓ in the treated water. The water was also effectively desalinated. The ion-exchange process could also reduce the nitrate-nitrogen concentration to less than 10 mg/ℓ in the treated water. However, the water could not be efficiently desalinated and the process should function better when the level of total dissolved solids in the feed is not very high. The electrodialysis process should also function well for nitrate-nitrogen and salinity removal. However, the electrodialysis process is more complicated to operate. The reverse osmosis and ion-exchange processes are therefore suggested for nitrate-nitrogen removal at clinics. Capital costs for small-scale reverse osmosis and ion-exchange units are estimated at ZAR7 000 and ZAR10 000, respectively. Operational costs for reverse osmosis and ion-exchange are estimated at ZAR3.16/m3 and ZAR3.60/m3 of treated water, respectively.
Keywords: Water quality, nitrate-nitrogen removal, reverse osmosis, ion-exchange, electrodialysis, costs
Introduction
Many borehole waters in rural areas in South Africa are not fit for human consumption because the nitrate-nitrogen (>6 mg/ℓ), fluoride (>1 mg/ℓ) and salinity (>1 000 mg/ℓ) concentrations are too high (Schoeman and Steyn, 2000). High nitrate-nitrogen concentrations in drinking water can cause an illness called methaemoglobinaemia or 'Blue Baby Syndrome' in small children. This happens when the nitrate is reduced to nitrite in the gastrointestinal tract and the nitrite reacts directly with haemoglobin in the bloodstream to produce methaemoglobin with consequent impairment of oxygen transportation. The reaction of nitrite with haemoglobin can be especially hazardous in infants under 3 months of age. Serious, and occasionally fatal, poisoning in infants has occurred following the ingestion of untreated well waters with nitrate-nitrogen concentration levels greater than 10 mg/ℓ (Holden et al., 1970). Other adverse human health effects associated with high nitrate-nitrogen concentrations in water include spontaneous abortions, the possibility of malformations in children, increased incidence of hyperthyroidism (goitre), and bladder cancer (Weyer, 2001).
The nitrate-nitrogen concentration of many borehole waters near clinics in the Limpopo Province is very high (30 to 70 mg/ℓ NO3-N). In many cases this is the only source of water nearby, and this water is not suitable for potable purposes, although the water is consumed for these purposes. Consequently, the nitrate-nitrogen concentration in the borehole waters should be reduced to potable standards (< 10 mg/ℓ NO3-N). Many clinics require only about 250 ℓ/d of potable water. Therefore, small-scale treatment technologies are required for water denitrification.
Reverse osmosis (RO), ion-exchange (IX), electrodialysis (ED) and biological denitrification technologies, which are successfully used for large-scale denitrification of water, should all be suitable technologies for small-scale application. A newly-developed membrane biofilm reactor also appears to have merit for small-scale usage (Chung et al., 2007). However, each of these technologies has its own advantages and disadvantages for water denitrification. Biological denitrification, for example, can remove nitrate-nitrogen very effectively from water. However, the perception that the water is in contact with bacteria, which are responsible for the removal of nitrate-nitrogen, is not always acceptable to people. The control of a biological process could also be difficult in a rural area. Reverse osmosis, IX and ED can also remove nitrate-nitrogen very effectively from contaminated waters (Tisseau, 1998; Kesore et al., 1997; Lauch and Guter, 1986). The control of these processes in rural areas should be easier than that of a biological process. Very little information is available regarding the biofilm reactor for nitrate-nitrogen removal. Therefore, the RO, IX and ED processes were selected for the small-scale removal of nitrate-nitrogen from boreholes serving clinics in rural areas.
The objectives of the investigation were to:
- Evaluate RO, IX and ED for nitrate-nitrogen removal at clinics
- Establish the most suitable technology for use at clinics
- Determine the preliminary economics of the processes
- Recommend the most suitable technology for use at clinics
Nitrogen sources
Waste of organic origin in soil contains nitrogen in protein form. The 1st transformation step is protein degradation (proteolysis and ammonia fixation of molecules) into ammonia-nitrogen by micro-organisms (DWAF, 1996). The 2nd step is the nitrification (2 phases) performed by autotrophic bacteria:
- NH4+ is oxidised into NO2- by Nitrosomonas
- NO2- is oxidised into nitrate (nitration) by Nitrobacter.
It is believed that high nitrate concentrations in borehole waters in rural areas originate from natural organic matter in soil and from pit latrines in the vicinity of boreholes. Other potential nitrogenous sources include runoff from agricultural land, wastewater and domestic water (Tisseau, 1998). However, it is doubtful whether any of these sources contribute significant quantities of nitrate-nitrogen to the groundwater in rural areas.
Water quality at clinics
The water quality experienced at some of the clinics in the Limpopo Province is shown in Tables 1, 2 and 3 ( Crosby, 2003), along with the resulting classification of this water quality in terms of an applicable water quality assessment tool (DWAF, DoH and WRC, 1998). The high nitrate-nitrogen concentrations are due to the location of pit latrines and other community sewage-disposal systems in the vicinity of production boreholes. It should be noted that the nitrate-nitrogen concentration levels (Class 4) indicate a dangerous water quality – totally unsuitable for use. The salinity levels, including chlorides and hardness, are also high in some of the waters. Therefore, water desalination would be required to reduce water quality to potable standards.
Methods
Clinic A
Reverse osmosis unit
An RO Model 10F4 with booster pump was used at Clinic A (Fig. 1) (Schoeman, 2004).
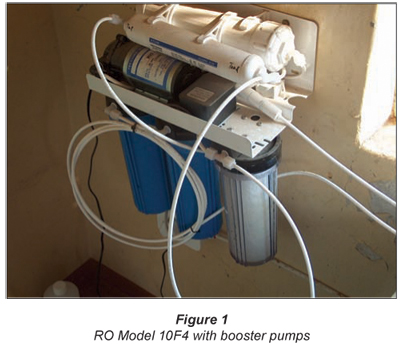
The RO unit containing Filmtec TW30-18-12 membranes (96% rejection) was tested in the laboratory prior to installation at the clinic in order to ensure correct procedure of operation and performance. Water flow rates, water recovery and salt rejections were determined on tap water.
Feed water at the clinic was supplied from a 10 m3 plastic tank (4 m high) to the RO unit that was installed indoors against a wall. Water flow rates (product or permeate and brine), water recovery and salt rejection were measured on a regular basis. Personnel from the clinic assisted in sample taking. The nitrate-nitrogen concentrations of the RO feed, product and brine were determined by chemical analysis. The major ions in the RO feed, product and brine were also determined at irregular intervals, along with the bacteriological composition of the untreated and treated feed.
IX unit
A POU-200-N600 Ion-Exchange Nitrate Removal Unit containing Lewatit M600 strong base anion resin was used at Clinic A (Figs. 2a and 2b) (Schoeman, 2004). The IX unit is similar to the units that are used for water softening.
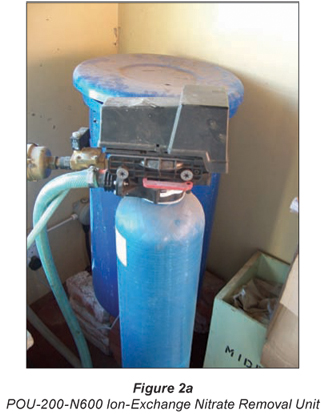
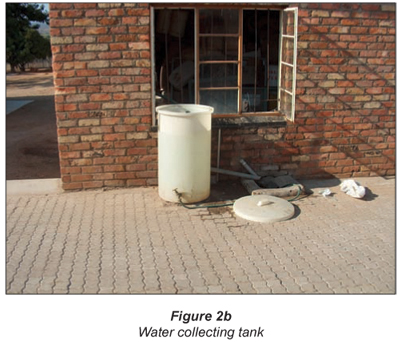
A bag of salt (25 kg) was put in the regeneration tank (height of water = 22 cm ; tank diameter = 41.5 cm ; volume = approx. 30 ℓ; anion-exchange resin was regenerated with approximately 10% salt solution (0.4 bed volumes (BVs); 1 BV = 20.5 ℓ)). Excess salt was removed by water rinses before the service cycle was started. A breakthrough curve was first established by taking hourly samples of the treated water for nitrate-nitrogen analysis. The nitrate-nitrogen concentration in the treated water was plotted as a function of throughput and the number of BVs produced at nitrate-nitrogen breakthrough (10 mg/ℓ NO3-N). Note that 20.5 ℓ resin (1 BV = 20.5 ℓ) was used.
Nitrate-nitrogen removal with the IX unit was studied over a 7-month period. Treated water was collected for approximately 1 to 3 hours every day in a 200 ℓ container (Fig. 2b). Samples for nitrate-nitrogen analysis were taken where the treated water entered the 200 ℓ container through a float, and the treated water volume (throughput) was recorded. Personnel from the clinic assisted in the taking of samples and flow-meter readings.
The IX unit is an automated unit (Schoeman, 2004). Regeneration is conducted with salt using an Autotrol 400 series control. The resin is first backwashed, then regenerated, followed by rinses to remove excess salt prior to the service cycle. Salt must be added to the regeneration tank when the salt bag (25 kg) in the tank is empty. Water is automatically sucked into the regeneration tank when it is empty.
ED unit
A laboratory-scale ED unit with an effective membrane area of 81 cm2 was evaluated in the laboratory for the removal of nitrate-nitrogen from borehole waters obtained at the clinics (Fig. 3) (Schoeman, 2004). The experiments were performed in the batch mode; 4 ℓ feed and 1 ℓ brine (feed) were used. The feed and brine solutions were circulated through 10 cell pairs (Selemion AMV and CMV membranes) at a constant cell stack voltage (20 V), and the decrease in electrical current was measured as a function of time. Samples of the treated water were taken regularly for nitrate-nitrogen analysis.
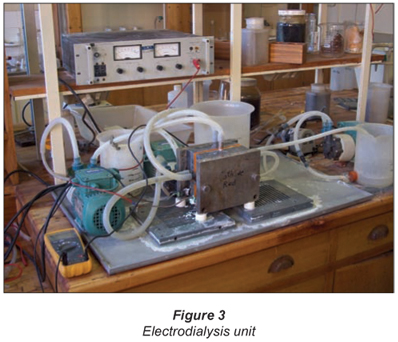
Clinic B
A similar RO unit to that used at Clinic A was used at Clinic B (Schoeman, 2004). Clinic B receives water of a poorer quality than that received by Clinic A. Note that the membrane module size was 5 cm by 25 cm at both clinics.
Results and discussion
Clinic A
RO test results on tap water
The RO unit was first tested on tap water prior to installation at the clinic. The desalination performance of the RO unit on tap water is shown in Table 4.
Salt rejection and water recovery were 96.06% and 27.01%, respectively. The low water recovery is due to the low feed inlet pressure (approx. 300 kPa). The product water output was 10.26 ℓ/h or 246.24 ℓ/d (1 d = 24 h).
RO test results on borehole water at clinic A
The nitrate-nitrogen concentration, measured in the RO feed, product and brine over the test period, is shown in Fig. 4. The nitrate-nitrogen concentration in the RO feed varied between 35 and 43 mg/ℓ. The nitrate-nitrogen concentration in the RO product varied between 1.4 and 5.2 mg/ℓ. Therefore, a high quality product water could be produced with RO desalination of the water. The nitrate-nitrogen concentration in the RO brine varied between 46 and 56 mg/ℓ; this concentration was not much higher than the feed concentration due to the low water recovery.
The initial nitrate-nitrogen concentration in the RO product was 1.4 mg/ℓ. This concentration in the product water was 5.2 mg/ℓ when approximately 23.3 m3 of the feed water had been treated. Therefore, it appears that there was a steady increase in the nitrate-nitrogen concentration in the product water. However, the nitrate-nitrogen concentration of 5.2 mg/ℓ in the product water at the end of the run was still far below the value of 10 mg/ℓ which is recommended for potable purposes.
The per cent nitrate-nitrogen removal, as a function of throughput over the test period, is shown in Fig. 5. The percentage nitrate-nitrogen removal varied between 96.7% and 86.7%. The results showed that there was a decline in the percentage nitrate-nitrogen removal from the beginning to the end of the run. However, there were highs and lows in the percentage nitrate-nitrogen removal over the test period. This phenomenon could not be explained at this stage.
The electrical conductivity of the RO feed, product and brine over the test period, as a function of throughput, is shown in Fig. 6. The electrical conductivity of the borehole water varied between 1 279 and 1 310 µS/cm over the test period and was very constant. The product water conductivity was lowest at the beginning of the run (78.9 µS/cm) with a maximum of 116 µS/cm occurring during the run. It also appeared that there was a steady increase in the conductivity of the product from the beginning to the end of the run. Brine conductivity varied between 1 560 and 1 722 µS/cm. There was again not much difference between the brine and the feed conductivity as a result of the low water recovery, and the brine could be used for toilet flushing.
The percentage conductivity rejection as a function of throughput over the test period is shown in Fig. 7. Conductivity rejection varied between 91.14% and 93.56% over the test period. Conductivity rejection was the highest at the beginning of the run (93.95%) and was 92.03% at the end of the run. This decline in conductivity rejection might indicate some degree of membrane fouling. However, the reduction in conductivity rejection was minimal and it appeared that membrane fouling should not be a serious problem.
It is interesting to note that the highs and lows in the conductivity rejection (Fig. 7) correspond with the highs and lows in the percentage nitrate-nitrogen removal (Fig. 5). These highs and lows in ion removal could be ascribed to a non-constant feed pressure during desalination.
The RO product and brine flow rates, as a function of throughput over the test period, are shown in Fig. 8. The product flow rate started at 120 mℓ/min, increased slightly, then declined slightly, increased again and was 135 mℓ/min at the end of the run. Therefore, the output of product water was higher at the end of the run than at the beginning of the run. This could indicate that membrane fouling should not be a problem. Brine flow rate varied between 264 and 438 ℓ/min over the test period. The brine flow rate was not significantly higher than the feed flow rate due to the low water recovery.
Water recovery as a function of throughput over the test period is shown in Fig. 9. Water recovery was 31.25% at the beginning of the run, declined to a low of 20%, then increased again and was 28.1% at the end of the run. (Note: The increase in water recovery and product flow is due to higher feed water temperatures during the summer months.)
The pH of the RO feed varied between 6.62 and 7.02 over the test period and was fairly constant. The product water pH was lower and varied between 5.61 and 6.59. This lower pH of the product water is due to the removal of alkalinity from the feed with the RO membranes. Brine pH was higher and varied between 6.77 and 7.15.
The 5 µm cartridge filter ahead of the RO membrane was replaced after 17.63 m3 of water had been processed. The cartridge filter had a brownish colour on the outside but was still white on the inside showing that no contaminants had leaked into the membranes. The brownish material entrapped in the filter consisted of 72.33% iron and 16.12% silicon as analysed by EDX (Schoeman, 2004; Isner and Williams, 1993).
A typical chemical composition of the RO feed, product and brine is shown in Table 5.
High-quality water could be produced with RO treatment (Class 0). This quality of water is ideal for life time use. The bacteriological quality of the RO feed, product and brine at the end of the run is shown in Table 6.
Reverse osmosis membranes are a good barrier against bacterial contamination. This is demonstrated by the results shown in Table 6 (Class 0). The heterotrophic plate count, however, was high. This showed that the water should be further disinfected by chlorine, prior to use.
Performance of the IX unit for nitrate-nitrogen removal at Clinic A
Data from a breakthrough curve has shown that approximately 100 ℓ (995 ℓ; 48.54 BVs) of denitrified water could be produced with ease (Schoeman, 2004). The nitrate-nitrogen concentration was only 0.8 mg/ℓ after 995 ℓ of water had been treated. It should be possible to produce significantly more denitrified water (approximately 2 000 ℓ) before regeneration would be required.
The electrical conductivity of the feed to the IX unit was 129 mS/m and the conductivity of the product water was significantly higher (146 mS/m) at the beginning of the run due to the displacement of chloride by nitrate from the resin. The conductivity of the product water, however, dropped to lower levels towards the end of the run.
The nitrate-nitrogen concentration in the treated water as a function of throughput over a number of regeneration and service cycles is shown in Fig. 10.
The IX unit was set at 1 regeneration per week at the beginning of the run. The feed flow rate was set at 13.2 BVs/h (1 BV = 20.5 ℓ) and a sample of the treated water was taken after approximately 2 to 3 hours every day, at the float. The tap at the outlet of the product water collecting tank was then closed and the tank was allowed to fillup to approximately 200 ℓ, when the float stopped the production of treated water. Therefore, at least a 1 000 ℓ of treated water was produced each day.
The data in Fig. 10 show that between approximately 2 and 3 m3 of denitrified water (< 10 mg/ℓ NO3-N) could be produced between regeneration cycles (zero to 31.03 m3 throughput; 1 regeneration per week). The nitrate-nitrogen concentration in the product water exceeded 10 mg/ℓ when approximately 3 m3 of product water had been produced. However, the run was continued waiting for regeneration to commence with the result that the product concentration was approximately the same as the feed concentration prior to regeneration. Therefore, the resin should be regenerated more frequently, i.e. at least twice per week.
The ion-exchange unit was set at 3 regenerations per week after 33.9 m3 of product water had been produced. The data in Fig. 10 clearly show that a product water with a nitrate-nitrogen concentration of 10 mg/ℓ and less could be continuously produced (from 35.9 m3 to 57.1 m3 throughput). Regeneration was not very effective (possibly no salt was added) at a throughput of between 57.6 m3 and 67.9 m3, and a poor quality product water was produced. However, water quality improved after a throughput of 68.9 m3, lasting for a short period until a throughput of 70.3 m3 (0.4 to 0.2 mg/ℓ NO3-N) was reached. Regeneration improved again and highquality water was produced at throughputs of between 74.3 m3 and 102.6 m3 (28.3 m3). Water quality then deteriorated (101.3 m3 to 107.4 m3 throughput) and further deteriorated from 107.9 m3 to 112.7 m3 throughput because no salt was added to the regeneration tank by the operator.
It was determined that approximately 90 ℓ of an approximately 10% salt solution was used for each regeneration of the resin.
The nitrate-nitrogen removal performance data show that it should be possible to continuously produce a good quality water (< 10 mg/ℓ NO3-N) with ion-exchange treatment. However, care should be taken that salt is always added to the regeneration tank once all the salt has been used. A disadvantage of the ion-exchange unit was that it was not refilling the regeneration tank properly with water after regeneration, with the result that the tank had to be filled manually. This problem, however, should be rectified by using an improved controller.
The chloride concentration in the borehole water is approximately 181 mg/ℓ (Class 1) (Schoeman, 2004). However, the chloride concentration in the treated water is approximately 300 mg/ℓ and higher (Class 2). Therefore, the treated water quality deteriorates as a result of the release of chloride ions into the treated water. However, a higher concentration of chloride ions in the treated water should be less of a problem than a high nitrate-nitrogen concentration. An excess concentration of chloride ions in the feed water and an excess total dissolved ion concentration will limit the use of ion-exchange for nitrate-nitrogen removal. Use of sodium bicarbonate as a regenerant instead of sodium chloride offers the potential of not adding chloride ions to the treated water (Matosic et al., 2000).
Performance of the ED unit for nitrate-nitrogen removal at Clinic A
The nitrate-nitrogen removal results are shown in Table 7.
It should be possible to reduce the nitrate-nitrogen concentration from 42 mg/ℓ in the feed to less than 10 mg/ℓ in the product water with ED. The ED process, however, is a much more complicated process to operate than the RO and IX processes. Electrodialysis is therefore not suggested for water denitrification in a rural area.
Clinic B
Performance of the RO unit for nitrate-nitrogen removal
The nitrate-nitrogen concentration in the RO feed was significantly higher at Clinic B than at Clinic A. The nitrate-nitrogen concentration in the RO feed varied between 54 and 69 mg/ℓ (Fig. 11). The initial nitrate-nitrogen concentration in the RO product was 21 mg/ℓ and declined to approximately 15 mg/ℓ after approximately 1 m3 of water had been processed and remained at this level until the run was terminated (10.8 m3). The nitrate-nitrogen concentration in the brine varied between 73 and 101 mg/ℓ.
The RO product flow rate started at 216 mℓ/min and was 198 mℓ/min after 10.8 m3 of water was treated. Brine flow rate was 318 mℓ/min at the beginning of the run and was 330 mℓ/min at the end of the run.
Water recovery decreased from 40.5% at the beginning of the run to 37.5% after 10.8 m3 of feed had been treated. The feed pH was 6.92 and the product pH was 5.98. Brine pH was slightly higher than the feed pH. The chemical composition of the RO feed, product and brine is shown in Table 8.
A high quality water could be produced with RO desalination. This is a Class 0 water, with the exception of nitrate-nitrogen concentration (Class 1). The nitrate-nitrogen removal characteristics of the small RO modules that are currently available are not high enough to produce a treated water with very low nitrate-nitrogen concentration from high nitrate-nitrogen feed waters. Such membrane modules should be developed. It was also found that the low pressure RO feed pump became damaged after use as a result of the relatively high TDS of the feed. Improved quality pumps should be used for this type of water.
Performance of the ED unit for nitrate-nitrogen removal
The nitrate-nitrogen removal results are shown in Table 9.
It should again be possible to reduce the higher nitrate-nitrogen concentration at Clinic B to approximately 10 mg/ℓ with ED. It should also be possible to reduce the salinity of the feed to potable quality.
Economics
The estimated capital and operational costs of the RO and IX technologies for use in rural areas are shown in Table 10 (Schoeman, 2004).
Summary and conclusions
Small-scale RO, IX and ED units were evaluated for water denitrification at clinics. The following conclusions can be made as a result of the investigation:
- High-quality water (1.4 to 5.5 mg/ℓ NO3-N) could be produced with RO desalination at Clinic A, where the feed-water nitrate-nitrogen concentration was lower (35 to 43 mg/ℓ NO3-N) than at Clinic B. However, the heterotrophic plate count of the treated water was high and the water should be disinfected before use. Small-scale RO should be a suitable technology for the treatment of this type of water.
- The quality of the RO treated water (12 to 17 mg/ℓ) at Clinic B, where the feed-water NO3-N (54 to 72 mg/ℓ) concentration was higher, was less satisfactory. The heterotrophic plate count of the treated water was also high and the water should be disinfected before use. Small-scale RO should be a suitable process for treatment of this water, especially with the high salinity of the water. However, higher rejection nitrate-nitrogen membranes should be found for this application.
- The ion-exchange process should be a suitable process for treatment of the water at Clinic A. Nitrate-nitrogen should be reduced to less than 10 mg/ℓ with ease. The ion-exchange process, however, adds chloride to the treated water, which might adversely affect the taste of the water. The ion-exchange process also does not desalinate the feed water properly and would not be a suitable process for a high TDS water as is the case at Clinic B.
- Electrodialysis should also be a suitable technology for the treatment of the water at both clinics. However, the ED process is considered to be too difficult to operate and maintain in rural areas.
- The RO process appears to be easier to operate and maintain than either the IX and ED processes and is therefore recommended for use at clinics. The RO brine concentration is only slightly higher than the feed concentration and can be used for the flushing of toilets. The IX process should also be a suitable process where the salinity of the feed is not too high. Proper maintenance of these units is very important and is the key to success for use in rural areas.
- The capital and operational costs of a small-scale RO unit (output of 195 to 259 ℓ/d) are estimated at approximately ZAR7 000 and ZAR3.16/m3 treated water, respectively (membrane replacement costs excluded).
- The capital and operational costs of an IX unit (output of approximately 3 m3/d) are estimated at approximately ZAR10 000 and ZAR3.60/m3 treated water, respectively (resin replacement costs excluded).
References
CROSBY R (2003) Personal communication. AGES, PO Box 2526, Polokwane 0700. [ Links ]
CHUNG J, RITTMANN BE, WRIGHT WF and BOWMAN RH (2007) Simultaneous bio-reduction of nitrate, perchlorate, selenate, chromate, arsenate and dibromochloropropane using a hydrogen-based membrane biofilm reactor. Biodegradation 18 199-209. [ Links ]
DWAF (DEPARTMENT OF WATER AFFAIRS AND FORESTRY, SOUTH AFRICA) (1996) South African Water Quality Guidelines (2nd edn.) Vol. 1, Domestic Water Use. Department of Water Affairs and Forestry, Pretoria, South Africa. [ Links ]
DWAF, DoH and WRC (DEPARTMENT OF WATER AFFAIRS AND FORESTRY, DEPARTMENT OF HEALTH and WATER RESEARCH COMMISSION) (1998) Quality of Domestic Water Supplies Vol. 1: Assessment Guide (2nd edn.). WRC Report No. TT 101/98. Water Research Commission, Pretoria, South Africa. [ Links ]
HOLDEN WA, CHURCHILL A and CHURCHILL J (1970) (eds.) Water Treatment and Examination. 104 Gloucester Place, London, UK. [ Links ]
ISNER RJD and WILLIAMS RC (1993) Analytical techniques for identifying reverse osmosis foulants. In: Amjad Z (ed.) Reverse Osmosis, Membrane Technology, Water Chemistry and Industrial Applications. Van Nostrand Reinhold, New York. [ Links ]
KESORE K, JANOWSKI F and SHAPOSHNIK VA (1997) Highly effective electrodialysis for selective elimination of nitrates from drinking water. J. of Membrane Sci. 127 17-24. [ Links ]
LAUCH RP and GUTER GA (1986) Ion-exchange for the removal of nitrate from well water. J. AWWA 78 (5) 83-88. [ Links ]
MATOSIC M, MIJATOVIC I and HODZIC E (2000) Nitrate removal from drinking water using ion-exchange – comparison of chloride and bicarbonate form of the resins. Chem. Biochem. Eng. Q. 14 (4) 141-146. [ Links ]
SCHOEMAN JJ and STEYN A (2000) Defluoridation, denitrification and desalination of water using ion-exchange and reverse osmosis. WRC Report No. TT 124/00. Water Research Commission, Pretoria, South Africa. [ Links ]
SCHOEMAN JJ (2004) Evaluation of reverse osmosis, ion-exchange and electrodialysis for nitrate-nitrogen removal from borehole water at clinics in the Northern Province. Unpublished report, available from: Japie.schoeman@up.ac.za. [ Links ]
TISSEAU MA (1998) Nitrates. In IWSA (ed.) The Blue Pages, The IWSA Information Source on Drinking Water Issues. IWSA . [ Links ]
WEYER P (2001) Nitrate in drinking water and human health. Review paper prepared for the University of Illinois Urbana-Champaign Agriculture Safety and Health Conf., March 2001. URL: http://www.cheec.uiowa.edu/nitrate/health.html (Accessed 2009) [ Links ]
Received 22 December 2008; accepted in revised form 28 August 2009.
* To whom all correspondence should be addressed.
+2712 420 3569; fax: +2712 362 5089;
e-mail: japie.schoeman@up.ac.za
Cyclodextrin-ionic liquid polyurethanes for application in drinking water treatment
TJ Malefetse, BB Mamba*; RW Krause and MM Mahlambi
University of Johannesburg, Department of Chemical Technology, PO Box 17011, Doornfontein 2028, South Africa
ABSTRACT
The prevalence of toxic contaminants in water remains a huge challenge for water-supplying companies and municipalities. Both organic and inorganic (especially heavy metals) pollutants are often present in water distribution networks. The presence of these contaminants in drinking water poses a major risk to human health. Organic and inorganic pollutants often co-occur in drinking water networks. However, at present there is no water treatment intervention that simultaneously removes both organic and inorganic pollutants from water to desirable levels. In our laboratories, recent studies have shown that both functionalised and un-functionalised cyclodextrin (CD) polymers are capable of removing organic pollutants from water, with the functionalised CD polymers showing an enhanced absorption capability. Ionic liquids (ILs), on the other hand, have been reported to absorb heavy metals from aqueous media. In this paper, we report on the synthesis of several cyclodextrin-ionic liquid (CD-IL) polymers, a dual system capable of removing both organic and inorganic pollutants from water. This system has been tested and has proved to possess excellent capabilities for the removal of model pollutants such as p-nitrophenol (PNP), 2,4,6-trichlorophenol (TCP) and chromium (Cr6+) from aqueous media.
Keywords: organic and inorganic pollutants, CD polymers, ionic liquids, CD-IL polymers
Introduction
Organic and inorganic water pollutants pose a major threat to human health even when present at low concentrations. For instance, because organic pollutants persist in the environment for long periods of time, they can be absorbed by plants thereby finding their way to poisoning the food chains of living organisms (Oleszczuk et al., 2004). They have also been linked to adverse human effects such as cancer, nervous system damage, reproductive disorders, as well as the disruption of the immune system (EPA, 2006). Also, organic contaminants released in one part of the world can be transported globally via oceans and atmospherically, and their effects can be felt in regions which are distant from where they originate.
On the other hand, inorganic pollutants, particularly heavy metals such as lead, cadmium, mercury and silver, have been reported to be toxic and even lethal to the human body, especially the central nervous system (Morales et al., 1999). These metals have a great affinity for sulphur and hence attack the sulphur bonds of enzymes causing them to malfunction (Lewis et al., 2001; Morales et al., 1999). One of the primary sources of heavy metal pollution in developing countries is industrial discharge. Taking into consideration the toxicity and the bioaccumulation of organic and inorganic pollutants, even in drinking water networks, a technique that can simultaneously remove both inorganic and organics from water needs to be developed. In this paper, we thus report on a technique that utilises cyclodextrin-ionic liquid (CD-IL) polymers for the simultaneous quenching of these pollutants from drinking water.
Cyclodextrins (CDs), first discovered by Villiers in 1891, are cyclic oligomers formed by the enzymatic hydrolysis of starch by Bacillus macerans (Szeitjli, 1998). The three most commonly known CDs contain 6 (α), 7 (β) and 8 (γ) glucose units which are linked together by α-(1,4) linkages (Bender and Komiyana, 1978). Liu et al. (2003) reported that CDs have a non-polar cavity which provides a micro-environment for the encapsulation of non-polar, low molecular weight compounds (formation of an inclusion complex) (Scheme 1).
However, CDs are slightly soluble in water which limits their sole application for water treatment purposes. This necessitates the functionalisation and, in particular, polymerisation of the parental CDs with suitable bi-functional linkers such as hexamethylene diisocyanate (HDI) and toluene diisocyanate (TDI) to make them insoluble (Li and Ma, 1999). These water-insoluble cyclodextrin polymers have been successfully synthesised in our laboratories and have been found to be effective in the absorption of organic pollutants at very low (ng·ℓ-1) concentrations (Mhlanga et al., 2007; Mamba et al., 2007). Also, mono-functionalised insoluble CD polymers were found to be effective in the removal of toxic phenolic compounds from the aqueous media at very low concentrations (Mamba et al., 2007). Trichloroethylene was removed to non-detectable levels whilst PNP was removed from a 10 mg·ℓ-1 spiked water sample with a removal efficiency of 99% (Salipira et al., 2007). During functionalisation, incorporation of specific functional groups can decrease the solubility of CDs, increase their stability in the presence of light, heat and oxidising conditions, or decrease their volatility (Szeitjli, 1998; Harada, 1997).
Ionic liquids (ILs) have aroused increasing interest for their promising role as alternative media for volatile solvents (Wei et al., 2003). ILs are defined as salts with a low melting point composed of organic cations and mostly inorganic anions such as Cl-, Br-, [PF6]- and [BF4]- (see Fig. 1). Besides anions such as hexafluorophosphate, tetrafluoroborate and halide anions, other common inorganic anions that are used for the preparation of ILs are [SbF6]- and [(CF3SO2)2N]-. The anion need not necessarily be inorganic; ILs possessing organic anions such as alkylsulphate, tosylate and methanesulfonate are known. The most common types of organic cations are the imidazolium and pyridinium ions (Pereiro et al., 2007). Other less common cations include ammonium, phosphonium, pyrrolidinium and sulphonium cations.
Ferreira et al. (2000) reported that the forces of attraction between the cation and the anion are not sufficiently strong enough to hold them together as solids at ambient temperatures hence it is possible, by proper choice of starting material, to synthesise ionic liquids that are liquid at or below room temperature. ILs possess unique physical properties such as negligible vapour pressure, an ability to dissolve a wide range of organic and inorganic material, high thermal stability (for example, some ILs are liquid at 400ºC, while others are liquid at -96ºC) as well as variable viscosity and miscibility with water and other organic solvents (Liu et al., 2003; Liu et al., 2005; Welton, 1999). However, the most important property of ionic liquids that has been exploited in this study is their ability to extract metals from aqueous media (Cruz, 2000; Liu et al., 2005). In this regard, Visser et al. (2002) have reported the successful extraction of cadmium (Cd2+) and mercury (Hg2+) from an aqueous medium using ionic liquids via the formation of an IL-metal complex.
Since water-insoluble CD polymers have demonstrated the ability to absorb organic pollutants from water even at ng·ℓ-1 levels and on the other hand ILs are able to remove metal ions from water, these properties have therefore been combined by preparing polymers that are capable of removing both organic and inorganic contaminants from drinking water. The polymers are accessed via an initial functionalisation of a CD with an ionic liquid skeleton. Functionalisation of CDs mainly occurs at the hydroxyl groups located at C-2, C-3, and C-6 positions. In this study, CDs were functionalised at the C-6 (primary hydroxyl group) position with a tosyl group or halogen (Zhong et al., 1998). Both the tosylated and halogenated CDs provided access to a variety of CD-IL complexes. Upon reaction with bi-functional linkers (HDI and TDI), the CD-IL complexes produced the corresponding water-insoluble polymers (Fig. 2).
To the best of our knowledge, there is no known technique that simultaneously removes organic and inorganic contaminants from water. This paper reports on the synthesis and applications of water insoluble CD-IL polymers in the removal of model pollutants (PNP, TCP and Cr6+) from water.
Experimental
Materials
Unless otherwise specified, all chemicals were obtained from suppliers and used without further purification. All reactions were performed under inert conditions using argon or nitrogen pressure. N,N-dimethylformamide (DMF) was dried over calcium hydride for two days and then distilled under reduced pressure over calcium sulphate before usage. The p-toluene sulphonic anhydride was prepared according to literature procedure (Gao et al., 1995) and used without further purification.
All reactions were monitored by thin layer chromatography (TLC). TLC analysis was performed on aluminium sheets pre-coated with a 0.25mm layer of silica F254. The eluant used for the TLC analysis of CD derivatives, i.e. mono-6-deoxy-6-β-cyclodextrin tosylate (CDOTs), mono-6-iodo-6-β-cyclodextrin iodide (CDI) and CD-IL complexes was 5:4:3 butanol/ ethanol (95%) / water. TLC spots were visualised under an ultraviolet lamp (254 nm and/or 365 nm) or dipped in 5% sulphuric acid (H2SO4) in ethanol followed by heating on a hot-plate.
Instrumentation
A Midac FT-IR 5000 spectrophotometer was used for all infrared (IR) spectral measurements. IR data are listed with characteristic peaks in wave number (cm-1). The identity of the compounds was confirmed using NMR spectroscopy whose spectra were recorded at 300 MHz using a Varian Gemini 2000 spectrometer. Proton and carbon chemical shifts are reported in mg·ℓ-1 using the residual signal dimethyl sulphoxide (DMSO-d6) (δ = 2.49 for 1H and 39.50 for 13C) or trimethyl silane (TMS) (δ = 0) as an internal reference. For ultraviolet (UV) experiments, a UV-Visible Cary 50 Spectrophotometer was used for the collection of data. A Varian CP-3800 gas chromatograph ion-trap Saturn 2000 Mass Spectrometer was used for the quantification of organic pollutants. The GC was equipped with a Chrompac CP Sil 8 CB, 30m × 0.25 mm column with an internal diameter of 0.25 µm. A Varian Spectr Atomic Absorption 10 flame spectrophotometer (AAS) was used for the analysis of heavy metal ions. The AAS wavelength was set at 357.9 nm for the analysis of Cr6+ and a flame of air/acetylene was employed.
Synthesis of CD-IL complexes
The CD-IL complexes were synthesised from CDOTs and CDI. Due to the ease of formation of the mono-tosylate and ease with which the tosyl leaving group can be replaced, mono-tosylated cyclodextrins are generally good precursors for derivatives of CDs (Zhong et al., 1998). To prepare the CD-IL derivatives, an alkyl imidazole (10 molar equiv.) was added drop-wise to a stirred solution of either β-CDI or β-CDOTs (0.88mmol) dissolved in anhydrous DMF (40 mℓ). Stirring was continued at elevated temperatures (80ºC and 90ºC for β-CDI an β-CDOTs, respectively) under nitrogen for a further 24 h. After cooling to room temperature, acetone (25 mℓ) was added to precipitate the product. The reaction mixture was then stirred for 30 min. Evaporation of organic solvents using a rotary evaporator produced a white solid. This solid was finally dissolved in deionised water (50 mℓ) and precipitated by the addition of acetone (200 mℓ). The precipitate was filtered off and dried under vacuum to yield a white powdery solid.
Synthesis of CD-IL polymers
The CD-IL complexes in the above section (both tosylate and iodide derivatives) were reacted with bi-functional diisocyanate linkers, hexamethylene diisocyanate (HDI) and toluene-2,4-diisocyanate (TDI), to produce CD-IL polymers. Typically, the β-CD-IL complex (0.88 mmol) was dissolved in DMF (20 mℓ) and the bi-functional linker was added drop-wise to the reaction mixture. The solution was allowed to react at 75ºC for 18 to 24 h with constant stirring. The polymerisation reaction was monitored by IR spectroscopy. The completion of the polymerisation was confirmed by the total disappearance of the isocyanate peak at 2 270 cm-1 after 18 to 24 h (Li and Ma, 1999). The reaction mixture was then precipitated by the addition of acetone (100 mℓ). The solid formed was then left to settle in acetone for 10 min to allow for the removal of residual DMF from the polymers. To remove traces of DMF which might still be present, the polymers were filtered and washed with copious amounts of acetone (100 mℓ). The polymers were then dried overnight under reduced pressure.
The polymers under investigation were derived from the tosylate and iodide derivatives of β-cyclodextrin methyl imidazolium, β-cyclodextrin butyl imidazolium and β-cyclodextrin pyridinium precursors.
Preparation of para-nitrophenol (PNP), 2,4,6-trichlorophenol (TCP) and Cr6+ standards
Potassium dichromate, p-nitrophenol and 2,4,6-trichlorophenol were purchased from suppliers and used without further purification. PNP standards of 2, 5, 10, 15 and 20 µg·ℓ-1 were prepared and used to test the absorption efficiencies of the polymers in the absorption of organic pollutants from water. UV-visible spectroscopy was used to determine the amount of the pollutant absorbed by the polymers. A 10 mm cuvette cell was used as a sample holder. For the analysis of TCP, standards of 1, 2, 5, 10, 15 and 20 µg·ℓ-1 were prepared.
Gas chromatograph-mass spectrometry (GC-MS) was used for the analysis of TCP absorbed by the polymers; 2,4,6-trichlorophenol (10 mg·ℓ-1) was passed through the polymers and the filtrate was analysed for the residual amount of TCP using GC-MS. Solid-phase extraction (SPE) was employed to extract TCP from the filtrate. The extractant from SPE analysis was concentrated to about 2 mℓ by bubbling through nitrogen gas.
To analyse for the amount of Cr6+ absorbed by the polymers, atomic absorption spectrophotometer (AAS) was employed. Cr6+ standards of 2, 4, 5, 6 and 8 µg·ℓ-1 were prepared and used to determine the absorption efficiencies of the polymers. A Cr6+ concentration of 5 mg·ℓ-1 was chosen based on the detection limit of chromium by the AA instrument that was used (1 to 20 mg·ℓ-1).
Typically, 30 mℓ (10 mg·ℓ-1) of the pollutant was passed through the polymers (300 mg). GC-MS, AA and UV measurements were done before and after the spiked water samples have been passed through the polymers. A calibration curve was plotted in order to determine the amount of the spiked pollutants absorbed by the polymers.
Results and discussions
The results obtained after passing water containing PNP, TCP and chromium through the polymers are summarised in Table 1.
UV-visible spectroscopy results
Phenolic compounds are quite prevalent as pollutants in most aquatic systems; PNP was thus selected as a model pollutant. Furthermore, PNP can be analysed by UV spectroscopy since it has chromophores (i.e. covalently bonded but unsaturated groups such as NO2, C=C and C=O) that absorb electromagnetic radiation in the ultraviolet and visible regions of the spectrum (Field et al., 1995). Thus PNP strongly absorbs at λ = 318 nm (visible region of the spectrum). The PNP-spiked water samples that passed through the polymers were measured by UV spectroscopy and using the absorbance, the residual PNP concentration was determined using the calibration curve and the results are shown in Table 1.
It is evident from Table 1 that the CD-IL polymers that were synthesised have generally higher absorption efficiencies for organic pollutants when compared with the native β-CD/HDI and β-CD/TDI polymers. For example, absorption of up to 80% was recorded for the β-CDMIMOTs/HDI polymer. This is substantially higher than the respective 64% and 68% observed for the CD/HDI and CD/TDI native polymers. It should also be noted that the extraction efficiency of the imidazolium-based polymers is generally superior to those of pyridinium-based polymers. In fact, the extraction efficiency of 15%, which was recorded for β-CDPYROTs/HDI, is even lower than that of the native polymers.
GC-MS results
TCP-spiked water samples were passed through the polymers and it was observed that a substantial amount of the TCP was absorbed by the polymers. However, the amount of TCP absorbed by the polymers was found to be less than that absorbed for PNP. These polymers were therefore found to have higher affinity for PNP than TCP (Table 1). This may be attributed to the structure of these 2 compounds; the structure of compounds (compatible geometry) determines the amount of the compound that will fit in the cavity (Linde et al., 2000). TCP is highly branched and could not perfectly pack in the CD cavity while the structure of PNP renders it more amenable to the absorption sites of the β-CD-IL polymers resulting in higher removal efficiency of PNP than TCP. However, these polymers still showed high absorption efficiencies when compared to the native CD polymers. This implies that the incorporation of the imidazolium ring onto the CD backbone resulted in an enhancement of absorption efficiency by the polymers.
AAS results
Besides being readily available in our laboratories, chromium was chosen because it is a toxic inorganic pollutant (heavy metal) especially when present in water as Cr6+. This metal ion can penetrate the skin causing irritation, liver and kidney damage as well as a decrease in male sperm counts (Morales et al., 1999). AAS analysis of the eluant after passing the Cr6+ containing water samples demonstrated that the CD-IL polymers were able to remove Cr6+ with an absorption efficiency of up to 100%. This observation suggests that the IL component incorporated onto the CD backbone was still highly active in the extraction of heavy metals from water. It is noteworthy that the native β-CD polymers also absorbed Cr6+ from water. Similar studies (Cardas et al., 2005; Brusseau et al., 1997) have also revealed that native CD polymers indeed form complexes with heavy metal ions. Results for the extraction of Cr6+ using the native polymers as well as the CD-IL polymers are summarised in Table 1.
Effect of the type of the cation – imidazolium vs. pyridinium
As shown in Table 1, incorporation of the imidazolium ring onto the CD backbone generally favours the absorption of both PNP and TCP by the polymers. On the contrary, the pyridinium-based polymers are far much better at the extraction of TCP. Although the IL component also enhances the complexation of Cr6+ ions, due consideration must be given to the type of anion.
Effect of the alkyl chain length attached to the imidazolium ring: methyl vs. butyl
Previous studies (Visser et al., 2001; Pandey, 2006) suggest that the amount of pollutant absorbed is affected by the length of the alkyl chain attached to the imidazolium ring. These reports stated that the longer the alkyl chain, the less effective the ionic liquid for metal ion extraction. Our investigation seems to support a decrease in the amount of the pollutant absorbed when the alkyl chain is extended. As shown in Table 1, the methylimidazolium polymers were found to possess higher extraction efficiency compared to their butylimidazolium counterparts.
Effect of the type of anion – tosylate vs. iodide
A study of the effect of the counter-anion (tosylate and iodide) on the absorption efficiency of the polymer revealed no correlation between the amount of organic pollutant (TCP and PNP) absorbed and the type of anion present in the polymer. However, for the absorption of Cr6+, the tosylated polymers had high absorption efficiencies compared to the iodinated polymers. The tosylate anion is hydrophobic and thus enhances the chelation (hexavalent dentition) of the chromium with the cationic component of the CD-IL polymers. The tosylate anion enhances the chelation of the heavy metal by repelling the water molecules from the cationic component. The iodide anion is, on the other hand, a hydrophilic anion and has the opposite effect. This observation is in agreement with reports by Welton (1999) and Cocalia et al. (2006) which reported a high absorption efficiency of heavy metal ions when hydrophobic anions were used. Hydrophobic anions repel water molecules thus creating an environment conducive for IL-metal-ion complex formation.
Comparison of absorption vs. surface area (BET results)
After determining the absorption efficiencies of the polymers, it was necessary to assess whether there was any correlation between the amount of pollutant absorbed and the surface area of the polymers. The surface analysis data (Table 2) do not reveal any direct relationship between the amount of pollutant absorbed and the surface areas of the polymers. For example, both β-CDMIMOTs/HDI and β-CDPYROTs/HDI polymers showed 100% absorption efficiency for PNP, yet their surface areas were significantly different (23.26 m2·g-1 and 2.89 m2·g-1, respectively).
Scanning electron microscopy (SEM)
Scanning electron microscopy was carried out to determine the surface morphology of the polymers. This was done in order to determine whether the absorption efficiency of the polymers could be linked to the surface morphology of the polymers. The morphology of the polymers was found to have no bearing on the amount of the pollutant absorbed by the polymers. Although the polymers had different morphological appearances (see Fig. 3), their absorption efficiencies were still comparable. For example, although β-CDMIMOTs/TDI and β-CDMIMOTs/HDI appear different under a scanning electron microscope, they both absorbed 100% of Cr6+. However, the same polymers show different absorption capabilities for PNP. β-CDMIMOTs/TDI absorbed 77% of the model pollutant while β-CDMIMOTs/HDI exhibited an absorption efficiency of 80%.
Conclusion
Paranitrophenol, 2,4,6-trichlorophenol and Cr6+ were successfully extracted from an aqueous mixture using CD-IL. A high percentage removal by these ionic liquid polymers was observed after passing water containing the model pollutants through the polymers.. The polymers showed fairly high absorption efficiencies for both the inorganic (Cr6+) and organic pollutants (PNP and TCP). CD-IL polymers can potentially be used for the removal of both organic and inorganic pollutants from drinking water systems.
Acknowledgements
Financial assistance from the University of Johannesburg and the National Research Foundation (NRF) is appreciated.
References
BENDER ML and KOMIYANA M (1978) Cyclodextrin Chemistry. Springer-Verlag Berlin, Heidelberg, New York. 1-3. [ Links ]
BRUSSEAU ML, WANG X and WANG W-Z (1997) Simultaneous elution of heavy metals and organic compounds from soil by cyclodextrin. Environ. Sci. Technol. 31 1087-1092. [ Links ]
CARDAS S, FORAY M-F, GADELLE A. GERBAUD G and BARDET M (2005) High-resolution solid state 13C NMR study of per(3,6-anhydro)-α-cyclodextrin based polymers and of their chromium complexes. Carbohydr. Polym. 61 88-94. [ Links ]
CRUZ DMP (2000) Thermal Analysis and Oxidation Reactions with Room-Temperature Ionic Liquids. DOE ERULF Program, University of Puerto Rico, National Renewable Energy Laboratory, Golden, Colorado. [ Links ]
FERREIRA P, GONCALVES IS, PILLINGER M, ROCHA J, SANTOS P and TEIXEIRA-DIAS JJC (2000) Modifications of β-cyclodextrin with ferrocenyl groups by ring opening of an encapsulated [1] ferrocenophane. Organomet. 19 1455-1455. [ Links ]
FIELD LD, STERNHELL S and KALMAN JR (1995) Organic Structures from Spectra. John Wiley and Sons, New York. p 6. [ Links ]
GAO XM, TONG LH, INOUOE Y and TAI A (1995) Synthesis and characterisation of novel multifunctional host compounds. 4 cyclodextrin derivatives bearing chromophores. Synth. Commun. 25 703-710. [ Links ]
LEWIS R and EVANS W (2001) Chemistry (2nd edn.). 415 pp. [ Links ]
LI D and MA M (1999) Nanosponges: From inclusion chemistry to water purifying technology. Chem. Tech. 35 31-37. [ Links ]
LINDE JJ, FREESE SD and PIETERSE S (2000) Evaluation of Powdered Activated Carbon (PAC) for the Removal of Taste and Odour Causing Compounds from Water. WRC Report No.1124/1/04. Water Research Commission, Pretoria, South Africa. [ Links ]
LIU J, JIANG G, CHI Y, CAI Y, ZHOU Q and HU J-T (2003) Use of ionic liquids for liquid-phase microextraction of polycyclic hydrocarbons. Anal. Chem. 75 5870-5876. [ Links ]
LIU J, LI N, JIANG G, LIU J, JOHNSSON JA and WEN M (2005) Disposable ionic liquid coating for headspace solid-phase microextraction of benzene, toluene, ethylbenzene, and xylenes in paints by gas chromatography-flame ionization detection. J. Chromatogr. A. 1066 27-32. [ Links ]
MAMBA BB, KRAUSE RW, MALEFETSE TJ and NXUMALO EN (2007) Monofunctionalised cyclodextrin polymers for the removal of organic pollutants from water. Environ. Chem. Lett. 5 79-84. [ Links ]
MAMBA BB, KRAUSE RW, MALEFETSE TJ, MHLANGA SD, SALIPIRA KL, SITHOLE SP, and NXUMALO EN (2007) Removal of geosmin and 2-methylisorboneol (2-MIB) in water from Zuikerbosch Treatment Plant (Rand Water) using β-cyclodextrin polyurethanes. Water SA 33 (2) 223-228. [ Links ]
MHLANGA SD, MAMBA BB, KRAUSE RW and TJ MALEFETSE (2007) Removal of organic contaminants from water using nanosponge cyclodextrin polyurethanes. J. Chem. Technol. Biotechnol. 82 382-388. [ Links ]
MORALES MM, MARTI P, LLOPIS A, CAMPOS L and SAGRADO S (1999) An environmental study by factor analysis of surface seawaters in the Gulf of Valencia (Western Mediterranean). Anal. Chim. Acta 394 109-117. [ Links ]
OLESZCZUK P and BARAN S (2004) Application of solid-phase extraction to determination of polycyclic aromatic hydrocarbons in sewage sludge extracts. J. Hazard. Mater. 113 237-245. [ Links ]
PANDEY S (2006) Analytical applications of room temperature ionic liquids: A review of recent efforts. Anal. Chim. Acta 556 38-45. [ Links ]
PEREIRO AB, LEGIDO JL and RODRIGUEZ A (2007) Physical properties of ionic liquids based on 1-alkyl-3-methylimidazolium cation and hexafluorophosphate as anion and temperature dependence. J. Chem. Thermodyn. 39 1219-1230. [ Links ]
SALIPIRA KL, MAMBA BB, KRAUSE RW, MALEFETSE TJ and DURBACH SH (2007) Carbon nanotubes and cyclodextrin polymers for the removal of organic pollutants from drinking water. Environ. Chem. Lett. 5 13-17. [ Links ]
SZEITJLI J (1998) Introduction and general overview of cyclodextrin chemistry. Chem. Rev. 98 1743-1753. [ Links ]
US ENVIRONMENTAL PROTECTION AGENCY (EPA) (2000) Chemical Precipitation, US EPA, Washington DC. (EPA832-f-00-018). [ Links ]
VISSER AE, SWATLOSKI RP, GRIFFIN ST, HARTMEN DH and ROGERS RD (2001) Liquid extraction of metal ions in Room temperature ionic liquids. Sep. Sci. Technol. 36 785-804. [ Links ]
VISSER AE, SWATLOSKI RP, REICHERTWM, MAYTON R, SHEFF S, WIERZBICKI A, DAVIS JH and ROGERS RD (2002) Task-Specific ionic liquids incorporating novel cations for the coordinating and extraction of Hg2+ and Cd2+: Synthesis, Characterization, and Extraction Studies. Environ. Sci. Technol. 36 2523-2529. [ Links ]
WEI G-T, YANG Z and CHEN C-J (2003) Room temperature ionic liquid as a novel medium for liquid/liquid extraction of heavy metals. Anal. Chim. Acta 488 183-192. [ Links ]
WELTON T (1999) Room-Temperature ionic liquid. Solvents for synthesis and catalysis. Chem. Rev. 99 2071-2083. [ Links ]
ZHONG N, BYUN H-S and BITTMAN R (1998) An improved synthesis of 6-O-monotosyl-6-deoxy-β-cyclodextrin. Tetrahedron Lett. 39 2919-2920. [ Links ]
Received 16 May 2009; accepted in revised form 10 August 2009.
* To whom all correspondence should be addressed.
+2711 559-6516; fax: +2711 559-6425;
e-mail: bmamba@uj.ac.za
REVIEW
Nitrosamines: A review on their prevalence as emerging pollutants and potential remediation options
Sthembile H Mhlongo; Bhekie B Mamba*; Rui W Krause
University of Johannesburg, Department of Chemical Technology, PO Box 17011, Doornfontein, 2028, South Africa
ABSTRACT
This review provides an overview of the current state of knowledge on the prevalence of nitrosamines in drinking water, especially nitrosodimethylamine (NDMA), and discusses published research on the detection, mechanisms of formation, and removal of nitrosamines. While the number of published reports in the South African context is very limited, this review also attempts to contextualise and report specifically on the challenges for South Africa. Besides direct industrial or human-derived contamination, nitrosodimethylamine can be formed through a chemical reaction between monochloroamine and an organic-based compound such as dimethylamine which is frequently detected in surface water. It has been suggested that chloramination of surface waters with a high concentration of dissolved organic carbon (DOC) could result in elevated NDMA formation. Growing evidence suggests that NDMA occurs more frequently and at higher concentrations in drinking water systems that practise chloramination compared to systems that use chlorination.
Keywords: drinking water, mechanisms of formation of nitrosamines, N-nitrosodimethylamine (NDMA)
Introduction
Nitrosodimethylamine (NDMA) belongs to a group of extremely toxic and mostly carcinogenic substances, the N-nitrosamines. NDMA and other members of the group are also considered as emerging organic pollutants, since their increased presence in drinking water has been linked to both raw-water contamination and developments in disinfection techniques (CDHS, 2007). Decontamination of NDMA relies mostly on UV irradiation, but these methods are rather impractical and expensive when applied to municipal and wastewater treatment (Jobb et al., 1994).
Current research has focused primarily on techniques for the removal of the nitrogenous precursors that have been implicated in the formation of NDMA, but not on the removal of NDMA itself. These techniques are expected to result in an overall cost saving for the treatment process, with the added benefit of producing fewer DBPs. Other promising methods of treatment of either nitrosamines or their precursors include UV or sunlight photolysis, catalytic degradation, zeolite entrapment, and bioremediation.
Since NDMA is such a potent carcinogen (more potent than most trihalomethanes (THMs)) part of the current problem in dealing with its contamination and treatment is the detection of minute quantities of both the NDMA and the precursors on a continuous basis. In this regard several pre-concentration techniques coupled with chromatographic and spectroscopic analyses have been developed, but these are not yet able to offer continuous in situ monitoring.
Nitrosamines are not new contaminants; their potential carcinogenic effects have been studied for over 40 years. In 1976, for example, researchers proposed that increased levels of NDMA in the air around industrialised urban centres could be responsible for higher rates of certain cancers (Shapley, 1976). Recently, in South Africa, the presence of NDMA and other nitrosamines, primarily from food and tobacco smoke, have been implicated as a possible cause of higher incidences of oesophageal cancers amongst Black populations in the former Transkei region (Sammon, 2007). Several other studies have correlated high incidences of certain cancers with high environmental availability of nitrosamines. In some cases this correlation is rather direct (as in the case of oesophageal carcinoma and cigarette smoking), while in others it is more difficult to determine (such as the link between certain cancers and the dietary change from sorghum- to maize-based beverages) (Sammon, 2007). In the latter case of a maize-based diet, among Black South African men in particular the epidemic increase in cancers begs the question of whether fungi such as Fusarium vertillioides (a common maize fungus) and their toxins could lead to increased levels of nitrosamines. The fungus could be a leading cause for the increased carcinogenesis; however, the increased levels of nitrosamines could be the root cause of the problem (Marasas et al., 1988). While there appears to be an epidemiological link between cancers and NDMA levels, a theory which is substantiated by several animal studies, it is not yet understood how nitrosamines cause cancer. Furthermore, to our knowledge no adequate human studies on the relationship between NDMA and cancer have been reported. Still, animal studies have shown that exposure to increased levels of nitrosamines (and even certain nitrogenous precursors) can lead to increased rates of cancer (IARC, 1982). Whether this is a direct result of the exposure to nitrosamines or whether nitrosamines merely increase an individual's predisposition or susceptibility to cancers is also still largely debated.
Much of the previous research around the occurrence of NDMA has focused on its presence in foods and beverages, where very often nitrites could be linked to higher levels of the contaminants and are the likely sources in vivo. Methods for reducing the risk of NDMA formation, such as the addition of ascorbic acid to processed meats, have been developed and regulated (Mitch et al., 2003b). However, since the occurrence of NDMA in water is a fairly recent discovery, treatment methods are less well known and much more research is needed. The current concern over NDMA in water stems from its detection at sites that appear to have no obvious source, and where its occurrence is thought to be linked to the disinfection process. Of particular concern are the strong correlations of elevated levels of NDMA with water treatment sites that use wastewater or monochloramination as part of their treatment regime (Mitch et al., 2003b). With the increasing demand for drinking water, the reuse of wastewater is likely to increase, and hence detection and removal of NDMA from water has become a priority worldwide. Alarmingly, the concentrations of nitrosamines have been shown to increase with increasing distance from such treatment plants (CDHS, 2007). This is probably linked to the presence of residual disinfectant in the water distribution system, coupled with the availability of nitrogenous compounds. In a study of 2 systems in Canada (Li et al., 2006), it was discovered that while there was little or no detectable NDMA in the source water, significant amounts were present in both the final (at the exit from the treatment plant) and distributed water. In fact, at a sampling point some distance from the treatment plant the concentration of NDMA was nearly 200 times greater than the recommended maximum for drinking water in the region.
A 2nd point of concern highlighted by the Canadian study was the detection (for the 1st time) of 2 new nitrosamines, namely N-nitrosodiphenylamine (NDPhA) and N-nitrosopyrolidine (NP) in a drinking water distribution system. These pollutants were not present in the source water; hence they could certainly have been generated during the disinfection process. Although new nitrosamines are constantly being added to environmental monitoring and action lists, there is a need to detect previously undetected and even perhaps unknown nitroso-compounds, as well as a need to rethink, in some cases, the current proposals for nitrosamine formation. These research concerns must be complemented with further development of methods for the detection of nitrosamines, and of more affordable methods for their removal. There also needs to be a greater understanding of the aetiology of nitrosamine-implicated cancers. As an indication of the confusion in this area, there is no uniform agreement on acceptable levels of NDMA, even in the USA and Canada, where concerns over NDMA in water have resulted in some response for at least 5 years (Li et al., 2006). There are also no uniform methods for detecting and removing nitrosamines in water, or for following their environmental fate.
Sources of NDMA in water
There are at least 4 known sources of nitrosamines and NDMA in particular. These are as follows:
- Direct industrial or human-derived contamination
- Microbial action
- Disinfection by-product formation
- 'Natural' degradation of precursors
Direct industrial or human-derived formation
Initial attention to the presence of NDMA in water came as a result of its detection in wastewater surrounding factories that manufacture or use unsymmetrical dimethylhydrazine (UDMH), particularly in rocket fuels and certain explosives (Mitch et al., 2003b). These hydrazines are well-known sources of nitrosamines through oxidation (Scheme 1) and hence the detection of NDMA in high concentrations around these factories was not unexpected.

Unsymmetrical dimethylhydrazine (UDMA) is an important intermediate in the formation of nitrosamines, but it is by no means the only source. Indeed the nitrosation of amines by nitrosyl (NO•) radicals or the nitrosyl cation (NO+) are more likely to be responsible for the presence of NDMA in foods and in tobacco smoke (Mitch et al., 2003b). Other industrial sources such as nitrates, nitrites, rubber treatment plants, and the use of exhaust and air-drying heaters containing NOx have been well studied. For example (Sen et al., 1996) found that the use of indirect heat during the malting stage of beer-making resulted in a significant drop in the amounts of NDMA in the beer compared to the previously used method of direct air-heating with NOx-containing exhaust gases. Similarly, the formation of a nitrosyl cation is most rapid at acidic pHs (fastest cation formation at a pH of around 3.4 and hence controlling the pH can reduce the formation of nitrosyl cations (Mirvish, 1975). Another method of controlling the concentration of nitrosyl cations is the addition of reducing agents such as ascorbic acid, which can lead to the formation of neutral or more stable nitrogen species (Scheme 2). These sources of NDMA are likely to contribute to the nitrosamine load in water, and hence need serious consideration.

The nitrosyl radical or cation only leads to the formation of NDMA in the presence of dimethylamine (DMA) or an amine precursor (Scheme 3), hence reducing the formation or the presence of these amines also leads to a decrease in the amount of NDMA. This is an important strategy for reducing NDMA in water.
Microbial degradation
In the case of microbial-derived nitrosamines, the addition of antimicrobial agents to limit the formation and growth of microbes leads to a decrease in NDMA contamination. In some cases, however, the sources are difficult to control, e.g. the formation of NDMA by Candida albicans (a common yeast infection) in the mouth is thought to be responsible for some oral cancers (Krogh et al., 1978). Also NDMA formation in traditional beer, brewed from maize polluted with NDMA, could be responsible for the high level of oesophageal cancer in South Africa (Isaacson, 2005). While some nitrates and nitrites appear to be converted to NDMA in the stomach and by bacteria in the gastrointestinal tract, (Mirvish, 1975) to date no research has shown any significant contribution to the levels of NDMA in water from bacteria and other microbes in these environments. Similarly, since background levels of NDMA in pristine areas are very low, we could reasonably assume that natural formation pathways contribute only trace amounts of nitrosamines to the environment. Thus only direct disinfection by-products (DBPs) remain as the major source of concern for drinking-water NDMA contamination.
Disinfection by-product formation
NDMA, in addition to being a contaminant originating from rocket fuel, plasticizers, polymers, batteries and other industrial sources, has also been discovered to form DBPs in drinking water treated with chloramines or chlorine (Richardson, 2003). The use of chloramines or chlorine as a primary disinfectant may increase NDMA concentrations in drinking water treatments. Monochloramine is used directly or formed during the chlorination of drinking water in the presence of ammonia. Gerecke and Sedlak showed that the yield of NDMA from chloramination of DMA was about 0.6% in natural waters (Gerecke and Sedlak, 2003). Also, the chloramination of surface water with high DOC concentrations could result in elevated NDMA formation (Kim and Clevenger, 2007). The chlorination of drinking water results in the formation of NDMA through UDMH acting as an intermediate (Mitch and Sedlak, 2002a; Choi and Valentine, 2002). According to Mitch et al.(2003a) the rate of formation of NDMA varies with pH, with a maximum formation rate occurring between pH 7 and 8. Therefore, the UDMH pathway has significant implications for disinfection of water and wastewater since NDMA formation is maximized at pH values of between 6 and 9, which are typical pH values for water and the wastewater treatment process.
In Canada and the USA, the discovery of unusually high levels of NDMA in drinking water following disinfection treatment in the late 1980s and late 1990s, respectively, prompted surveys of 145 drinking water plants in Ontario (Ministry of the Environment, 2007) and 19 in California (CDHS, 2007). These surveys indicated that NDMA concentrations at most treatment plants were below the notification levels of 9 ng/ℓ (recently changed in California to 10 ng/ℓ for NDMA and other nitrosamines), and that none were near the response levels of 100 ng/ℓ. Similar results have been cited for natural aquifers, e.g. samples taken from 56 lakes in Missouri showed very little inherent NDMA but did demonstrate the potential for NDMA formation under circumstances of added DMA (Hua et al., 2007).
In contrast to these low levels in both natural and treated drinking water sources, analyses from wastewater and recycled-water plants often show much higher concentrations of NDMA. Raw sewage also often contains levels of NDMA that are 100 to 1 000 times higher than recommended levels, and some of this NDMA can persist in the treated water. Studies show that treatment of these wastes and recycled waters with monochloramine or even with chlorine can result in the formation of an additional 20 to 100 ng/ℓ of NDMA (Mitch and Sedlak, 2002b). The presence of amine species such as ammonia, and DMA, can lead to significant increases in NDMA even though only chlorination is used in the disinfection train.
Natural degradation of precursors
Sources of amines can be both natural DMA and trimethylamine-N-oxide, which are both constituents of urine and human and animal waste (Zuppi et al., 1997). Artificial water treatment methods (for example, ion-exchange resins used in water treatment) can easily leach DMA and lead to increased NDMA concentrations of 20 to 50 ng/ℓ (Najm and Trussel, 2001). NDMA can be formed as a result of biological, chemical or photochemical processes (Ayanaba and Alexander, 1974). The presence of NDMA in water, air, and soil may be due to chemical reactions between ubiquitous, naturally-occurring precursors classified as nitrosatable substrates (secondary amines) or nitrosating agents (nitrites). For example, NDMA may form in air during night-time as a result of the atmospheric reaction of DMA with nitrogen oxides (Cohen and Bachman, 1978). Soil bacteria may also synthesize NDMA from various precursor substances, such as nitrate, nitrite and amine compounds (ATSDR, 1989).
Mechanisms of formation
Current proposed mechanisms of formation of nitrosylated molecules lack detailed mechanistic research, but the available data suggest that the formation of NDMA from monochloramine (or from chlorinated nitrogenous molecules) present in feed-water probably proceeds via the UDMA pathway (Scheme 1) (Mitch et al., 2003b). Oxidation of UDMA (Scheme 4) could generate significant amounts of not only NDMA and other nitrosamines but also of other pollutants such as dimethylformamide (DMF) (Mitch et al., 2003b).

Similar mechanisms have been proposed for the formation of other nitrosamines such as NP and NDPhA, and the monochloramine can serve as the source of both the reactant for the synthesis of UDMA, as shown above, and the oxidant to promote oxidation of UDMA to NDMA.
Most of these proposed methods require the presence of DMA, but even structurally-related molecules such as trimethylamine-N-oxide are potential DMA precursors and hence potential sources of NDMA. In general, however, other molecules tend to give much lower yields of NDMA due to the fact that a C–N bond usually needs to be broken in order to release DMA. In unpolluted water the background levels of DMA are generally very low (less than 100 ng/ℓ) but this can increase significantly with the reuse of wastewater or ion-exchange membranes (Richardson, 2003). Also, waters with higher dissolved organic nitrogen (DON) could lead to the formation of NDMA and other nitrosamines via nitrosation of available amines. One drawback of using this study to propose the mechanisms of formation is that they are necessarily conducted under carefully-controlled conditions. This means that the experiments do not accurately replicate conditions pertaining during the industrial chlorination of wastewater and municipal water. They do, however, provide a better understanding of the possible roles of monochloramine and the formation of nitrosamines, and as such also provide a useful 'handle' for monitoring not only the levels of NDMA, but also the potential for its formation in a system (Mitch and Sedlak, 2002a).
The use of resins and even activated carbons (ACs) may pose another risk, i.e. the catalysis of NDMA formation. While basic resins can leach amines, acid resins could be a source of displaced hydrogens, which would increase the rate of formation of nitrosyl precursors (Dietrich et al., 1986). Other potential sources of primary amines are industrial and agricultural pollutants with amine or amide functional groups, which are often formulated as amine salts to increase their solubility (IARC, 1982). Amine-based catalysts and polymers are very common in industrial processes and are often used as additives in the production of plastics and rubber. Workers in these environments and water treatment plants using these wastewaters should be particularly cautious.
Regulation
The lack of firm directives for the maximum allowable amounts of NDMA and other nitrosamines has led to rather arbitrary levels being set, and even more arbitrary enforcement of these regulations. Current internationally-accepted limits for notification are in the order of 10 ng/ℓ (Mitch et al., 2003b). This simply means that where NDMA (and a few other nitrosamines) are detected above this level the water authorities should inform regulatory bodies who would typically decide whether or not action is needed. The state of California has recently published a Public Health Guide (PHG) for levels of NDMA of only 3 ng/ℓ, but again these are target levels for determining if action is needed, and in general action levels for NDMA found at source or at treatment plants are much higher – typically 10 to 30 times higher (CDHS, 2007).
The USEPA recommends that levels of NDMA in lakes and rivers should be limited to 1.4 ppt (1.4 ng/ℓ), to prevent possible health effects from drinking water or eating contaminated fish (USEPA, 1980).
Detection methods
One of the major concerns in water quality management is the need to find cost-effective and appropriate methods of monitoring pollution. In the case of nitrosamines, several factors complicate this study, such as detecting sufficiently low concentrations, detecting both thermally stable and labile nitrosamines, and detecting previously unknown nitrosamines. There are several detection methods for nitrosamines that have been described comprehensively in literature especially in the chromatographic analysis compendium (Nollet and Grobb, 2006).
However, we will briefly describe two techniques which emerge as potentially useful techniques to deal with the detection of nitrosamines.
Gas chromatography-mass spectrometry (GC-MS)
This is the most common method currently in use. The USEPA for example, has Method 521 for nitrosamines in drinking water with an established laboratory approval process (USEPA, 2004). This method essentially relies on the GC-MS for detection of pollutants against internal or surrogate standards with deuterium labelling. Together with suitable pre-concentration such as solid-phase extraction (SPE), this technique has the potential to detect a large number of nitrosamines (Jenkins et al., 1995). The use of tandem MS on the other hand allows detection of unknown nitrosamines (Zhao et al., 2006). One drawback of this method, besides the high price tag for the instrument, is the fact that GC relies on thermal volatilisation and hence thermally labile nitrosamines cannot be detected. One current method to overcome this restriction is the use of liquid-chromatography (LC) in place of GC, but currently the limits of detection are a little higher (around 1 to 10 ng/ℓ) than for GC (Mitch et al., 2003b). In response to health concerns associated with NDMA, the California Department of Health Services set an NDMA notification level of 10 ng/ℓ (CDHS, 2002).
The advantage of these techniques is that there are several possible modifications, both in the sample preparation and in the detection. For example, the addition of a gas such as ammonia can enhance the detection and lower the detection limits for most nitrosamines (0.1 to 10.6 ng/ℓ).
Fluorescence fingerprinting
The simultaneous collection of a matrix of excitation and emission fluorescence spectra now allows the resolution of various components of water with specific fluorescence spectra (fingerprints). While this technique cannot directly detect NDMA, there is a correlation between the fluorescence excitation emission matrix (FEEM) and the formation potential (CDHS, 2007). Currently the drawback of this method is that it relies on the detection of relatively high dissolved organic matter (DOM), in the order of at least 3 to 12 mg/ℓ, which tends to have significant fluorescence excitations. The advantage may be the simultaneous determination of formation potential for other pollutants such as halomethanes.
Carcinogenic potential
Given its very low vapour pressure and low octanol/water partition coefficient, log Kow = -0.57 (a measure of its lipophilicity), it is unlikely to be absorbed by the skin (ATSDR, 1989). Therefore, the exposure to NDMA in the air, through showering or swimming, is considered negligible. The carcinogenic potential of NDMA is only based on oral exposure. For example, the skin permeability constant for NDMA (Kp = 2.65 x 10⁻⁴ cm/h) is very low (CICADS, 2002).
Since no direct human cancer studies exist for the exposure to NDMA in water, cancer risks have been calculated based on the ingestion of about 2 ℓ/d of contaminated water, over a lifetime. A generally accepted risk level by the USEPA is a one in a million chance of developing cancer from a life-time exposure to the chemical.
This calculation does not consider any other sources of NDMA, but provides an assessment of the 'added risk' from exposure to NDMA in water, and places the maximum exposure at between 1 and 10 ng/ℓ. Although other non-cancer effects are poorly studied, this maximum level of exposure is also expected to be protective against these risks.
Removing NDMA from water
NDMA has a low vapour pressure and hence is unlikely to be adsorbed to particulates, AC or soil, and is therefore highly mobile in soil and has the potential to rapidly leach into groundwater (ATSDR, 1989). NDMA is rapidly photolysed, and would probably rapidly degrade in air or surface soil on exposure to sunlight. It has an estimated half-life of 5 to 30 min in the air and a few hours in surface dust and soil (ATSDR, 1989).
Removal of NDMA from water by sorbents (AC and zeolites) and reverse osmosis
In water, however, the high miscibility (NDMA has a very low Henry's constant of 2.6 x 10⁻⁴ atm.M–1 at 20ºC) and low vapour pressure results in long residence times (ATSDR, 1989). This means that volatilisation from water is unlikely to occur to any great extent. The small and polar nature of NDMA means that it is poorly sorbed onto particles and ACs, but at least one recent study has shown that some zeolites or alumina-modified amorphous silica gels could be effective in its removal (Cao et al., 2007). Its small size also leads to significant amounts of NDMA leaching through reverse-osmosis membranes and therefore only about 50% is removed by this means (Steinle-Darling, 2007). Also, increasing membrane fouling and other effects tend to lead to less NDMA being removed.
Removal by UV radiation
Currently the most common method of removing NDMA takes advantage of the photolytic instability of its N–N bond. NDMA has 2 absorption bands, a strong π→π* band in the UV region (λmax = 228 nm, where ε = 7 380 M–1·cm–1) and a second n→π* band at λmax = 332 nm (ε = 109 M–1·cm–1) (Polo and Chow, 1976; Stefan and Bolton, 2002). The most commonly-used source of UV radiation in disinfection trains are the mercury lamps whose wavelength maxima do not correspond well with the absorption spectrum of NDMA. Therefore, in conditions typically encountered in drinking water disinfection a UV dose of 1 J·cm–2 is required to reduce NDMA concentrations by 90% (Stefan and Bolton, 2002). This is about 10 times the dosage currently used for virus disinfection by UV. Hence, while this method is theoretically feasible, it would be very expensive in drinking water treatment (Mitch et al., 2003b).
Removal by sunlight photolysis
Sunlight photolysis has also been attempted in shallow basins, but again due to poor wavelength matching and low sunlight transmission in water, approximately 1 day of exposure was required to reduce the NDMA concentration by 50% (ATSDR, 1989). Photolysis of NDMA in sunlight occurs as a result of NDMA's secondary absorption band between 300 and 350 nm (Mitch et al., 2003b). Atmospheric photolysis of NDMA removes NDMA from the sunlit atmosphere within a few hours (Shapley, 1976).
Removal of NDMA precursors
In contrast to NDMA, its amine precursors are chemically very different, and pose an easier target for removal (Mitch et al. 2003b). For example, amines can be removed by bio-filtration, reverse osmosis, and microfiltration. According to a study by Hwang et al. (1994), DMA and other aliphatic amines were poorly removed by sorption through the use of granular activated carbon (GAC). Although these techniques currently have very high costs, they provide a viable set of alternatives for the treatment of polluted water.
Although direct photolysis of NDMA is an effective technique, the absence of the nitroso functional group on the nitrogen-containing precursors makes the precursors unreactive. The reaction of DMA with ozone is very slow.
Other removal methods
Other techniques, such as the use of zero-valent metal ions, bioremediation, ozonation and phytoremediation, have been attempted but none have shown much success to date (Mitch et al., 2003b; Dean-Raymond and Alexander, 1976; Bingbing et al., 2009; Gui et al., 2000). In our research group we have reported the use of water-insoluble cyclodextrin polymers in the removal of various kinds of organic pollutants in water through the encapsulation of these contaminants into the cavities of the cyclodextrin moiety (Salipira, et al., 2007; Mamba et al., 2007; Mhlanga et al., 2007). These polymers have demonstrated capacity to remove the water contaminants even at parts-per-billion concentration levels and could be recycled several times while maintaining high absorption efficiencies (Salipira, et al., 2008). Recently, these cyclodextrin polyurethane polymers were applied in the removal of NDMA in distribution systems of selected water treatment plants in South Africa and the cyclodextrin polymers could remove NDMA present at ng/ℓ levels (Mhlongo, 2009).
Conclusions and future concerns
This review has highlighted the current wealth of research into the occurrence, detection and treatment of NDMA in water; however, much more research is needed in some areas.
One of the concerns for pollution monitoring in general is the detection of unknown or unidentified pollutants. Very little information is available for these pollutants. As an indication of the extent of the problem, the following list shows some of the potentially carcinogenic N-nitrosoamines currently under investigation in the USA: N-nitrosodibutylamine, N-nitrosodimethylamine, N-nitrosodiethylamine, N-nitrosodiethanolamine, N-nitrosodipropylamine, N-nitrosopyrrolidine, N-nitrosopiperidine, N-nitroso-N-methylurea, N-nitrosomethylvinylamine, N-nitrosomorpholine, N-nitrosonornicotine, N-nitrososarcosine, N-nitroso-N-ethylurea, and 4-(N-nitrosomethylamino)-1-(3-pyridyl)-1-butanone.
There is also a need for a study on non-carcinogenic effects; most studies have focused on the carcinogenic activity of NDMA and very few studies have been aimed at evaluating other toxic effects that may exist. High concentrations of NDMA have shown hepatotoxicity and immune system depression in animals but the toxicity at lower doses has not yet been established.
More work is required in order to understand and characterise the mechanisms of NDMA formation, including the precursors involved, the effect of residual disinfectant, the effect of ion-exchange resins, and other potential sources of DMAs.
In addition, improved and cost-effective methods for the removal of NDMA and its precursors are needed. This could involve measurements of rates of photolysis, bioremediation and phytoremediation, for which little evidence currently exists.
References
AYANABA A and ALEXANDER M (1974) Transformations of methylamines and formation of a hazardous product, dimethylnitrosamine in samples of treated sewage and lake water. J. Environ. Qual. 3 (1) 83-89. [ Links ]
ATSDR (Agency for Toxic Substances and Disease Registry ) (1989) Toxicological profile for N-nitrosodimethylamine. US Public Health Services in collaboration with the US Environmental Protection Agency. URL: http://www.atsdr.cdc.gov/toxprofiles/tp141.html (Accessed June 2009). [ Links ]
BINGBING X, ZHONGLIN C, FEI Q, JIMIN S and FENGCHANG W (2009) Factors influencing the photodegradation of N- Nitrosodimethylamine in drinking water. Frontiers of Environmental Science & Engineering in China. 3 (1) 91-97. [ Links ]
CALIFORNIA DEPARTMENT OF HEALTH SERVICES (CDHS) (2007) Public health goal for N- Nitrosodimethylamine in drinking water. URL:http://www.oehha.ca.gov/water/phg/pdf/122206NDMAphg.pdf (Accessed June 2007). [ Links ]
CALIFORNIA DEPARTMENT OF HEALTH SERVICES (CDHS) (2002) NDMA in California Drinking Water URL:http://www.dhs.ca.gov/water/ps/ddwem/chemicals/NDMA/history.htm (Accessed June 2009). [ Links ]
CAO Y, YUN ZY, ZHOU CF, ZHUANG TT, YU Q, LIU HD and ZHU JH (2007) Removal of carcinogens in environment: Adsorption and degradation of N-nitrosonornicotine (NNN) in zeolites. Microporous Mesoporous Mater. 103 352-362. [ Links ]
CHOI JH and VALENTINE RL (2002) Formation of N-nitrosodimethylamine (NDMA) by reaction of monochloramine in a model water: A new disinfection by-product. Water Res. 36 817-824. [ Links ]
COHEN JB and BACHMAN JD (1978) Measurement of environmental nitrosamines. IARC Sci Publ. 19 357-372. [ Links ]
DEAN-RAYMOND D and ALEXANDER M (1976) Plant uptake and leaching of dimethylamine. Nat. 262 394-396. [ Links ]
DIETRICH AM, GALLAGHER DL, DEDOSA PM, MILLINGTON DS and DIGIANO FA (1986) Enhancement of N-nitrosamine formation on granular-activated carbon from N-methylaniline and nitrite. Environ. Sci. Technol. 20 1050-1055. [ Links ]
GERECKE AC and SEDLAK DL (2003) Precursors of N-nitrosodimethylamine (NDMA) in natural waters. Environ. Sci. Technol. 37 1331-1336. [ Links ]
GUI L, GILLHAM RW and ODZIEMKOWSKI MS (2000) Reduction of N-nitrosodimethylamine with granular iron and nickel- enhanced iron: 1. Pathways and kinetics. Environ. Sci. Technol. 34 3489-3494. [ Links ]
HUA B, VEUM K, KOIRALA A, JONES J, CLEVENGER T and DENG B (2007). Fluorescence fingerprints to monitor total trihalomethanes and N-nitrosodimethylamine formation potential. Environ. Chem. Lett. 5 (2) 73-77. [ Links ]
HWANG Y, MATSUO T, HANAKI K and SUZUKI N (1994) Removal of odorous compounds in wastewater by using activated carbon, ozonation and aerated biofilter. Water Res. 28 (11) 2309-2319. [ Links ]
IARC (WHO International Agency for Research on Cancer) (1982) Some N-nitroso compounds. IARC Monographs on the Evaluation of the Carcinogenic Risks to Humans 17 125-175. [ Links ]
ISAACSON C (2005) The change of the staple diet of black South Africans from sorghum to maize is the cause of the epidemic of squamous carcinoma of the oesophagus. Med. Hypotheses 64 658-660. [ Links ]
JENKINS SWD, KOESTER CJ, TAGUCHI VY, WANG DT, PALMENTIER JPFP and HONG KP (1995) N-nitrosodimethylamine in drinking water using a rapid, solid-phase extraction method. Environ. Sci. Pollut. Res. 2 (4) 207-210. [ Links ]
JOBB DB, HUNSINGER RB, MERESZ O and TAGUCHI V (1994) Removal of N-nitrosodimethylamine. Ohsweken (Six Nations) Water Supply Final Report. Ontario Ministry of Environment, Queen's Printer for Ontario. [ Links ]
KIM J and CLEVENGER TE (2007) Prediction of N-nitrosodimethylamine (NDMA) formation as a disinfection by-product. J. Hazardous Mater. 145 270-276. [ Links ]
KROGH P, HALD B and HOLMSTRUP P (1978) Possible mycological etiology of oral mucosal cancer: Catalytic potential of infecting Candida albicans and other yeasts in production of N-nitrosobenzylmethylamine. Carcinog. 8 1907-1912. [ Links ]
MAMBA BB, KRAUSE RW, MALEFETSE TJ, MHLANGA SD, SITHOLE SP, SALIPIRA KL and NXUMALO EN (2008) Removal of geosmin and 2-methylisorboneol (2-MIB) in water from Zuikerbosch Treatment Plant (Rand Water) using b-cyclodextrin polyurethanes. Water SA 33(2) 223-227. [ Links ]
MARASAS WF, JASKIEWICZ K, VENTER FS and VAN SCHALKWYK DJS (1988). Fusarium moniliforme contamination of maize in oesophageal cancer areas in Transkei. S. Afr. Med. J.74 (3) 110-114. [ Links ]
MHLANGA SD, MAMBA BB, KRAUSE RWM and MALEFETSE TJ (2007) Removal of organic contaminants from water using nanosponge cyclodextrin polyurethanes. J. Chem. Technol.Biotechnol. 82 (4) 382-388. [ Links ]
MHLONGO SH (2009) M.Sc. Dissertation, University of Johannesburg, South Africa. [ Links ]
Ministry of the Environment (1998) Drinking Water Surveillance program. URL: http://www.ene.gov.on.ca/programs/3554e01.htm (Accessed June 2007). [ Links ]
MIRVISH SS (1975) Formation of N-nitroso compounds: Chemistry, kinetics and in vivo occurrence. Toxicol. Appl. Pharmacol. 31 325-351. [ Links ]
MITCH WA and SEDLAK DL (2002a) Formation of N-nitrosodimethylamine (NDMA) from dimethylamine during chlorination. Environ. Sci. Technol. 36 588-595. [ Links ]
MITCH WA and SEDLAK DL (2002b) Factors controlling nitrosamine formation during wastewater chlorination. Water Sci. Technol. Water Supply 2 (3) 191-198. [ Links ]
MITCH WA, GERECKE A and SEDLAK DL (2003a) A N-nitrosodimethylamine (NDMA) precursor analysis for chlorination of water and wastewater. Water Res. 37 3733-3741. [ Links ]
MITCH WA, SHARP JO, TRUSSEL RR, VALENTINE RL, ALVAREZ-COHEN L and SEDLAK DL (2003b) N-nitrosodimethylamine (NDMA) as a drinking water contaminant: A review. Environ. Eng. Sci. 20 (5) 389-403. [ Links ]
NAJM I and TRUSSEL RR (2001) NDMA formation in water and wastewater. J. AWWA February 92-99. [ Links ]
NOLLET LML and GROB RL (2006) Chromatographic Analysis of the Environment (3rd edn.). CRC Press, New York. 419-452. [ Links ]
POLO J and CHOW YL (1976) Efficient photolytic degradation of nitrosamines. J. Natl. Cancer Inst. 56 (5) 997-1001. [ Links ]
RICHARDSON SD (2003) Disinfection by-products and other emerging contaminants in drinking water. Trends Anal. Chem. 22 (10) 666-684. [ Links ]
SALIPIRA KL, MAMBA BB, KRAUSE RW, MALEFETSE TJ and DURBACH SH (2007) Carbon nanotubes and cyclodextrin polymers for removing organic pollutants from water. Environ. Chem. Lett. 5 (1) 13-17. [ Links ]
SALIPIRA KL, KRAUSE RW, MAMBA BB, MALEFETSE TJ, CELE LM and DURBACH SH (2008) Cyclodextrin polyurethanes polymerized with multi-walled carbon nanotubes: Synthesis and characterization. Mater. Chem. Phys. 111 (2-3) 218-224. [ Links ]
SAMMON AM (2007) Environmental initiation is the dominant factor; tobacco or other carcinogens of low potency or concentration are sufficient for carcinogenesis in the predisposed mucosa. Med. Hypotheses 69 (1) 125-131. [ Links ]
SEN NP, SEAMAN SW, BERGERON C and BROUSSEAU RJ (1996) Trends in the level of N-nitrosodimethylamine in Canadian and imported beers. Agric. Food. Chem. 44 (6) 1498-1501. [ Links ]
SHAPLEY D (1976) Nitrosamines: Scientists on the trail of prime suspect in urban cancer. Sci. 191 268-270. [ Links ]
STEFAN MI and BOLTON JR (2002) UV direct photolysis of N-nitrosodimethylamine (NDMA): Kinetic and product study. Helv. Chim. Acta 85 1416-1426. [ Links ]
STEINLE-DARLING E, ZEDDA M, PLUMLEE MH, RIDGEWAY HF and REINHARD M (2007) N-nitrosodimethylamine (NDMA) removal by reverse osmosis and UV treatment and analysis via LC-MS/MS. Water Res. 42 (1-2) 347-355. [ Links ]
USEPA (United States Environmental Protection Agency) (1980) Ambient water quality criteria for nitrosamines. URL: http://www.epa.gov/ (Accessed June 2006). [ Links ]
USEPA (United States Environmental Protection Agency) (2004) Method 521 URL: http://www.epa.gov/nerlcwww/ordmeth.htm (Accessed June 2007). [ Links ]
ZHAO Y-Y, BOYD J, HRUDEY SE and LI X-F (2006) Characterization of new nitrosamines in drinking water using liquid chromatography and tandem mass spectrometry. Environ. Sci. Technol. 40 7636-7641. [ Links ]
ZUPPI C, MESSANA I, FORNI F, ROSSI C, PENNACHIETTI L, FERRARI F and GIARDINA B (1997). 1H NMR spectra of normal urines: reference ranges of the major metabolites. Clin. Chim. Acta 265 85-97. [ Links ]
Received 20 March 2009; accepted in revised form 5 June 2009.
* To whom all correspondence should be addressed.
+2711 559 6516; fax: +2711 559 6425;
e-mail: bmamba@uj.ac.za
REVIEW
Review of commonly used remote sensing and ground-;based technologies to measure plant water stress
M GovenderI, II, *; PJ DyeI; IM WeiersbyeI; ETF WitkowskiI; F AhmedIII
ISchool of Animal, Plant and Environmental Sciences, University of the Witwatersrand, Johannesburg, PO Wits 2050, South Africa
IICSIR Natural Resources and the Environment, c/o School of Environmental Sciences, University of KwaZulu-;Natal, Private Bag X01, Scottsville, 3209, South Africa
IIIRemote sensing GIS and spatial modelling, School of Environmental Sciences, University of KwaZulu-;Natal, Durban 4041, South Africa
ABSTRACT
This review provides an overview of the use of remote sensing data, the development of spectral reflectance indices for detecting plant water stress, and the usefulness of field measurements for ground-;truthing purposes. Reliable measurements of plant water stress over large areas are often required for management applications in the fields of agriculture, forestry, conservation and land rehabilitation. The use of remote sensing technologies and spectral reflectance data for determining spatial patterns of plant water stress is widely described in the scientific literature. Airborne, space-;borne and hand-;held remote sensing technologies are commonly used to investigate the spectral responses of vegetation to plant stress. Earlier studies utilised multispectral sensors which commonly collect four to seven spectral bands in the visible and near-;infrared region of the electromagnetic spectrum. Advances in sensor and image processor technology over the past 3 decades now allow for the simultaneous collection of several hundred narrow spectral bands resulting in more detailed hyperspectral data. The availability of hyperspectral data has led to the identification of several spectral indices that have been shown to be useful in identifying plant stress. Such studies have revealed strong linear relationships between plant pigment concentration and the visible (VIS) and near-;infrared (NIR) reflectance, while plant water content has been linked to specific bands in the short-;wave infrared (SWIR) region of the spectrum. Ground-;truthing is essential to identifying useful reflectance information for detecting plant water stress, and four commonly used ground-;based methods viz. predawn leaf water potential, leaf chlorophyll fluorescence, leaf pigment concentrations and leaf water content are reviewed for their, usefulness and practical application.
Keywords: leaf chlorophyll fluorescence, leaf-;water content, plant pigment concentrations, plant water stress, predawn leaf water potential, remote sensing
Introduction
All living organisms including plants need an adequate supply of water to ensure both their growth and survival. Water in plants is required to permit vital processes such as photosynthesis, respiration and nutrient uptake. Plants absorb water from the soil through their roots, which is then transported to their stems, leaves and flowers for the maintenance of the different vital processes. When water supply is insufficient, plants may suffer water stress which could then compromise their growth production, reproduction and survival.
Water stress in plants is a complex physiological response to the limited availability of water to a plant. When plants suffer from water stress, a series of harmful plant-;water interactions occur, which may disrupt a plant's physiology. These include a decrease in cell water potential, cell turgor and relative water content (Hsiao, 1973).
The available water to plants is usually expressed in terms of water potential. Water potential is commonly assessed by measuring predawn leaf water potential; a direct measure of plant water stress. Measurements at predawn directly evaluate the water status of the plant, because during night-;time hours under zero transpiration, plant water potential equilibrates to the available soil water (Cleary and Zaerr, 1984). Cleary and Zaerr (1984) suggested that a predawn leaf water potential of less than -;0.8 MPa is an indication of stressed vegetation. Indirect measurements may also be used to detect plant water stress. The more commonly used techniques include measurements of relative leaf water content, plant chlorophyll pigment content and chlorophyll fluorescence. Other, less frequently applied measurements used in verifying remote sensing studies include variations in trunk or stem diameters or even xylem vessel characteristics.
Although characterising cavitations in xylem vessels is potentially a useful technique for understanding the response to water stress in a plant, this method is time-;consuming, costly and not suitable for use over large spatial scales. It has been shown in many plant species that roots are more vulnerable to cavitation than stems, and thus root cavitation is more suited to characterise plant water stress between species (Sperry and Saliendra, 1994; Alder et al., 1996; Hacke and Sauter, 1996; Linton et al., 1998).
Reliable detection and prediction of plant water stress is desirable for numerous agricultural, forestry, conservation and land rehabilitation applications. Various remote and ground-;based technologies are available for the measurement of plant water stress.
Remote sensing technologies which utilise spectral reflectance data have increasingly been used for determining spatial patterns of plant water stress (Yamasaki and Dillenburg, 1999; Ceccato et al., 2001; Sims and Gamon, 2002; Pu et al., 2003; Jackson et al., 2004; Stimson et al., 2005; Chun-;Jiang et al., 2006; Clay et al., 2006; De Tar et al., 2006; Eitel et al., 2006; Fitzgerald et al., 2006; Harris et al., 2006; Sepulcre-;Cantó et al., 2006; Campbell et al., 2007; Hope et al., 2009). Important advantages of remote sensing technologies include cost-;effectiveness, efficiency in displaying spatial patterns at a variety of scales, and versatility in revealing a variety of structural and physiological characteristics of water-;stressed plants. Despite numerous successful case studies, the selection of suitable remote sensing methodologies and reflectance algorithms remains difficult, due to the influence of vegetation diversity and site conditions on vegetation spectral reflectance.
This paper reviews the detection of plant water stress using remote sensing technologies and ground-;based techniques commonly used to identify water stress in plants and which are suitable for ground-;truthing remotely-;sensed imagery. Within the scope of this review, no distinction is made between the technologies used for acquiring the remote sensing data, but rather the focus is on highlighting vegetative spectral sensitivities which have been used to detect plant water stress. The ground-;based techniques reviewed are based on measurements of predawn leaf water potential (Dixon, 1914), leaf chlorophyll fluorescence (Muller, 1874), leaf water content (Weatherley, 1950) and leaf pigment concentrations (Lichtenthaler, 1987).
Detection of plant water stress using remote sensing
The application of remote sensing technologies for plant and environmental studies became widespread during the 1980s. These studies made use of low spatial and spectral resolution (60 m to 80 m and 4 spectral bands) multispectral data. Multispectral remote sensing data commonly consist of 4 to 7 broad spectral bands in the visible (VIS) and near infrared (NIR) regions of the electromagnetic spectrum. These datasets were acquired using airborne, satellite and ground-;based spectrometers. Early airborne systems consisted of a multispectral camera mounted on board a light aircraft. Spectrometers at this time were bulky, heavy instruments which were not easily transportable in the field; therefore most measurements were taken in laboratories.
Remote sensing technologies have advanced significantly over the past 10 to 15 years. With the development of hyperspectral remote sensing technologies, researchers have benefited from significant improvements in the spectral and spatial properties of the data, allowing for more detailed plant and environmental studies. These technologies acquire many hundreds of spectral bands across the spectrum from 400 nm to 2 500 nm, using satellite, airborne or hand-;held devices. The Casi or Hymap airborne imagers are examples of commonly used hyperspectral imagers which acquire high spectral and spatial resolution images. A distinct advantage of most airborne imagers is their capability to acquire at least 200 or more spectral bands at less than 5 m spatial resolution. Advances in spectrometry have also resulted in state-;of-;the-;art portable field instruments which allow for the collection of hand-;held hyperspectral signatures. The Hyperion sensor is currently the only hyperspectral satellite system available for research.
In recent years, there has been an expanding body of literature concerning the relationship between the spectral reflectance properties of vegetation and the structural characteristics of vegetation and pigment concentration in leaves. The spectral characteristics of vegetation are governed primarily by scattering and absorption characteristics of the leaf internal structure and biochemical constituents, such as pigments, water, nitrogen, cellulose and lignin (Asner, 1998; Coops et al., 2002). Pigments are the main determinants controlling the spectral responses of leaves in the visible wavelengths (Gaussman, 1977). Chlorophyll pigment content, in particular, is directly associated with photosynthetic capacity and productivity (Gaussman, 1977; Curran et al., 1992). Reduced concentrations of chlorophyll are indicative of plant stress (Curran et al., 1992). On the other hand, cellular structure and water content of leaves are the main determinants in the near-; and mid-;infrared wavelengths as shown in Fig. 1.

A summary of important findings since the early 1980s which highlights specific regions of the electromagnetic spectrum and their relation to vegetation spectral reflectance properties is presented in Table 1. Many of the earlier studies focused on broad spectral bands such as the VIS and NIR regions (350 nm to 1 300 nm), which could be used in vegetation studies. More recent work has highlighted the importance of more specific narrow-;band regions such as the red edge (maximum slope of vegetation reflectance from 690 nm to 740 nm) for predicting plant stress (Clay et al., 2006; Fitzgerald et al., 2006; Blackburn, 2007; Campbell et al., 2007). The extent of the literature is indicative of the importance of relationships between plant stress and both plant chlorophyll and water content. Plant chlorophyll and water content have thus been used as 'surrogates' of plant stress, under the assumption that decreases in chlorophyll and water content are indicative of plant stress. Numerous individual spectral bands and vegetation spectral reflectance indices have been identified for use in predicting plant chlorophyll content and water content.
Spectral indicators of plant chlorophyll content
In stressed vegetation, leaf chlorophyll content decreases, thereby changing the proportion of light-;absorbing pigments, leading to a reduction in the overall absorption of light (Murtha, 1982; Zarco-;Tejada et al., 2000). These changes affect the spectral reflectance signatures of plants through a reduction in green reflection and an increase in red and blue reflections, resulting in changes in the normal spectral reflectance patterns of plants (Murtha, 1982; Zarco-;Tejada et al., 2000). Thus, detecting changes from the normal (unstressed) spectral reflectance patterns is the key to interpreting plant stress.
Specific reflectance wavelengths in the red and near infrared region of the spectrum, which are sensitive to plant chlorophyll pigment variation, have been identified. Reflectance from 550 nm and 700 nm shows maximum sensitivity to a wide range of chlorophyll contents (Curran et al., 1990; Carter, 1993; Gitelson and Merzlyak, 1996; Lichtenthaler et al., 1996, Datt, 1999). However, there is little agreement on the optimum wavelengths to be used in the remote assessment of plant chlorophyll content.
Indices have been derived using a combination of specific reflectance wavelengths for the remote assessment of chlorophyll content (Curran et al., 1990; Jacquemoud, 1993; Baret and Jacquemoud, 1994; Baret et al., 1994; Filella and Penuelas, 1994; Gitelson and Merzylak, 1996; Lichtenthaler et al., 1996; Blackburn, 1998a; Blackburn, 1998b; Lelong et al., (1998); Blackburn, 1999; Datt, 1999; Stone et al., 2001; Coops et al., 2003). These indices have been typically derived through correlations between leaf reflectance and leaf chlorophyll content, and are often developed for a single species with constant leaf size and shape, leaf surface and internal structure (Datt, 1999). However, the relationship between chlorophyll content and leaf or canopy reflectance is not necessarily generic and caution needs to be taken when applying these indices over different vegetation types or biomes for the prediction of plant water stress (Coops et al., 2003).
In the remote assessment of plant water stress, total chlorophyll and chlorophyll a content have been identified as key spectral indicators. Chlorophyll a absorbs strongly in the red wavelengths because of electron transitions of the chlorophyll molecules. As the chlorophyll concentration increases, there is an apparent displacement in the slope of the spectral curve in the red wavelengths towards longer wavelengths (Horler et al., 1983). However, in a stressed plant there is a shift towards shorter wavelengths, often reported as the 'blue shift' (Carter, 1993).
The interdependence of chlorophyll a and total chlorophyll provide an appropriate measure of changes in spectral reflectance due to plant water stress. If the relative proportion of chlorophyll a were to increase there would be a movement of the red edge to longer wavelengths, independent of total chlorophyll content. Likewise, a decrease in the relative proportion of chlorophyll a would result in a movement of the red edge to shorter wavelengths, also independent of total chlorophyll content. However, the effect of a changing chlorophyll a/chlorophyll b ratio on the red edge is likely to be minor and has proved difficult to observe compared to the effect of the total chlorophyll content (Guyot and Baret, 1988). Therefore, red reflectance is considered a reliable metric for total chlorophyll content and changes in leaf pigments (Horler et al., 1983).
When chlorophyll content is used as a measure of plant water stress, the placement and shape of the spectral red edge are important indicators of plant water stress (Horler et al., 1983, Curran et al., 1990, Blackburn, 1999; Blackburn, 2007). This relationship is used to explain the movement of the red edge to shorter wavelengths during different expressions of plant water stress, such as senescence or stress-;induced chlorosis (Collins et al., 1983; Rock et al., 1988; Milton and Mouat, 1989; Clay et al., 2006; Campbell et al., 2007).
Spectral indicators of plant water content
Plant water content at the leaf and canopy scales is often estimated using specific spectral reflectance bands and spectral reflectance indices from near infrared, middle infrared (MIR) and short-;wave infrared (SWIR) regions of the electromagnetic spectrum (Tucker, 1980; Hunt and Rock, 1989; Gao, 1995; Zarco-;Tejada et al., 2003; Jackson et al., 2004; Shen et al., 2005; Chun-;Jiang et al., 2006).
NIR and MIR spectral bands are highly correlated to water content of vegetation and soils (Tucker, 1980; Hunt and Rock, 1989; Musick and Pelletier, 1986; 1988). Spectral bands from these regions have been used to delineate stressed trees from non-;stressed trees (Tucker, 1980; Hunt and Rock, 1989; Musick and Pelletier, 1986; 1988). In these regions of the electromagnetic spectrum, leaf water content has been remotely assessed using bands 1 550 nm to 1 750 nm (Tucker, 1980), as well as the ratio of spectral bands 1 550 nm to 1 750 nm and 2 080 to 2 350 nm (Musick and Pelletier, 1986; 1988). However, in laboratory experiments a good relationship was identified between water content, leaf area, and the spectral index derived using 820 nm and 1 600 nm spectral reflectance bands (Hunt and Rock, 1989). In these experiments MIR reflectance increased with decreasing leaf water content in California oak, blue spruce, soybean and sweetgum (Hunt and Rock, 1989).
In the SWIR region (1 400 nm to 2 500 nm), field measurements have shown significant changes to this region of the spectrum resulting from changes in the water content of plants (Tucker, 1980; Ceccato et al., 2001). Several relationships have been identified between specific spectral bands in the SWIR region and different ground-;based measurements of plant water stress such as relative water content, leaf water potential, stomatal conductance, and cell wall elasticity (Foutry and Baret, 1997; Pu et al., 2003). In particular, Foutry and Baret (1997) reported that the spectral wavelengths at 1 530 nm and 1 720 nm are most appropriate for assessing plant water content in both woody and herbaceous plant species.
Several spectral indices have been derived to detect changes in plant water content for the remote assessment of plant water stress. The sensitivity of such spectral indices to changes in plant water content is influenced by the internal leaf structure. Therefore, some spectral indices may not be suitable for the detection of low or moderate levels of plant water stress (Eitel et al., 2006). Two spectral indices that have been successfully used are the normalised difference water index (Gao, 1995) and water band index (Penuelas et al., 1995).
The normalised difference water index (Gao, 1995) is commonly used and accepted as an accurate estimate of plant water content. This index consists of the ratio of the difference between reflectance measured at 860 nm and 1 240 nm, and the sum of reflectance measured at 860 nm and 1 240 nm respectively (Gao, 1995). At these narrowband wavelengths, vegetation canopies have similar radiation-;scattering properties, but slightly different liquid water absorption properties. Therefore, this index has been successfully applied to remotely detect plant water content for various tree species (Gao, 1995; Jackson et al., 2004; Stimson et al., 2005; Eitel et al., 2006).
The water band index is derived from the ratio of reflectance measured at 900 nm and 970 nm (Penuelas et al., 1995). This spectral index has been correlated with ground-;based measurements of plant water content at both the leaf and canopy scales. It is, however, more sensitive to leaf water content than the water content of the whole plant. This is advantageous in agricultural applications, where leaf water content changes more noticeably in response to drought conditions than the water content of the entire plant foliage (Champagne et al., 2003).
Factors affecting spectral reflectance from leaf to canopy scales
The levels of spectral reflectance from a plant leaf or canopy are determined by a variety of factors. The factors that play a role in the spectral reflectance from a plant leaf or canopy include: species, site, age or maturity of plants or foliage, nutrient status, and leaf orientation, effects of variable irradiance, variable background, and the geometrical arrangement of the object/scene, sensor, and surface, orientation of the ground surface in relation to the location of the sun and remote sensing device and meteorological conditions (Asner, 1998; Coops et al., 2003). Their individual or combined effects are relevant for measurements with ground-;based field spectrometers, airborne and satellite remote sensing technologies.
Remote sensors differ extensively in their ability to discriminate targets. Spatial resolution varies from less than a metre to several kilometres, with some models requiring input parameters from various data sources with different spatial resolutions (Chen, 1999). Furthermore, vegetation cover can be spatially highly heterogeneous, and variability within a pixel is likely to introduce uncertainties when processing and applying remote sensing imagery at different spatial resolutions (Jiang et al., 2006).
Spectral data collected at the leaf scale usually contain the least amount of variability and are most easily correlated to ground-;truthing experiments at the same spatial scale. Ground-;truthing in conjunction with remote sensing surveys is often undertaken at the leaf scale, due to the complexity of ground-;truthing at larger spatial scales, and the difficulty in accounting for the significant variability in canopy reflectance. Therefore, spectral features and relationships which have been identified at the leaf scale in such studies have often also been applied generically at canopy and landscape scales (Mohammed et al., 1997; Datt, 1999; Zarco-;Tejada et al., 2000; Coops et al., 2003).
Despite the difficulty in reproducing canopy reflectance, attempts have been made by stacking leaves on top of each other for below-;canopy spectral measurements (Blackburn, 1999; Datt, 1999; Coops et al., 2003). The disadvantage of the leaf-;stacking method is that it is unable to represent the absolute radiation interactions which occur at the canopy scale. It also fails to replicate, for example, canopy architecture, leaf angle distribution, the reflectance of trunks and branches, and the contribution of the wider canopy outside of the instrument field of view. Thus, its use is limited. It does, however, assist in controlling the impact of variables such as background reflectance, irradiation levels and sun-;target-;sensor geometry which do affect spectral reflectance measurements of the canopy scale.
The removal of atmospheric and background interferences is necessary when processing remote sensing data. Various types of calibration models can be applied depending upon the quantity and quality of calibration data recorded during the remote sensing acquisition surveys. Alternatively, the removal of atmospheric and background interferences could be omitted when vegetation spectral reflectance indices, which account for differences in atmospheric and background effects, were applied in sparsely vegetated environments (Giannico, 2004). Furthermore, the magnitude of atmospheric and background interferences is greater as spatial resolution decreases from ground to stand and canopy levels; and spectral resolution increases from multispectral to hyperspectral data.
Detection of plant water stress using ground-;based measurements
Simple and quick ground-;truthing methods which utilise portable instruments are needed for the measurement of plant water stress. Commonly used techniques address aspects of the plant water status and plant pigment concentration.
Predawn leaf water potential
Predawn leaf water potential measurements, often undertaken with a pressure chamber, are useful for determining plant water stress. At predawn, xylem water potential has equilibrated with soil water potential after a night of negligible transpiration. At this time, plant water potential is usually at its minimum for the day (Cleary and Zaerr, 1984).
The pressure chamber is most commonly used for estimating leaf water potential, having the advantage of simplicity, reliability, instantaneous measurements, low capital cost and portability (Scholander et al., 1965; Boyer, 1968; Ritchie and Hinckley, 1975). The equipment design has not changed significantly over the past 4 decades since Scholander et al. (1965) used this technique to measure the water relations of trees and shrubs. Manual operation is still required, therefore this technique is considered slow and time-;consuming for any commercial or operational applications (Jones, 2004).
Measurement of predawn leaf water potential has gained wide acceptance among researchers. It is commonly used as a plant water stress indicator (Aranda et al., 2005; Nortes et al., 2005; Intrigliolo and Castel, 2006; Pellegrino et al., 2006) and has also been used to describe the water status of different species within a habitat (Scholander et al., 1965; Lamont and Witkowski, 1995). Predawn leaf water potentials have been shown to differ among species in the same habitat (Witkowski et al., 1992; Lamont and Witkowski, 1995), within a species across different habitats, and with leaf age (Witkowski et al., 1992) and within a species across different plant sizes (Lamont et al., 1994). Typical plant water potential measurements of unstressed plants range from -;0.15 MPa for plants under saturated soil conditions and low atmospheric demand (Cleary and Zaerr, 1984) to -;2.0 MPa for 'tank' plants such as cactus, which can store water (Scholander et al., 1965). Conversely, stressed plants such as creosote bush and juniper growing in more arid regions could achieve plant water potentials of -;8.0 MPa (Scholander et al., 1965), while for desert plants it can be much higher. Predawn leaf water potential measurements have also been successfully used in agricultural applications to evaluate plant water stress. Such applications have included estimates of transpiration of soil water and assessments of crop water stress resulting from irrigation scheduling of grapevine field sites and fruit orchards (Intrigliolo and Castel, 2006; Pellegrino et al., 2006). Predawn leaf water potentials have also been coupled with stem water potential measurements and fluctuations in trunk diameters to quantify water stress of young almond trees for irrigation management (Nortes et al., 2005).
Despite the wide application of predawn pressure chamber measurements, numerous sources of error and measurement problems have been identified (Ritchie and Hinckley, 1975). These need to be minimised in order to ensure accurate readings, and can be grouped into 4 categories, viz. speed of measurement in the field; appropriate selection and processing of samples; reduction in pressurisation problems with the chamber; and correct identification of the end point.
In the field, speed of measurement is of major importance. Moisture loss between time of sampling and measurement must be minimised (Ritchie and Hinckley, 1975; Turner, 1988; Campbell, 1990; Hsiao, 1990; Smith and Prichard, 2003). Measurements should take place directly after excision of the plant sample. If this is not possible, samples should be enclosed in plastic bags immediately after cutting and stored in a cool dark place until required. However, if time-;delays occur between predawn sampling and actual measurements, this could result in inaccurate measurements (Clear and Zaerr, 1984; Turner, 1988).
Great care should be taken in selecting and processing samples. It is important to standardise the sampling process with respect to leaf age and development stages when making a comparison between plant species (Witkowski et al., 1992). Damaged samples (crushed leaf petiole or torn leaf blades) and re-;cutting of sample stems (Scholander et al., 1965), lead to a break in the tension in the xylem water, and should thus be avoided (Clear and Zaerr, 1984; Turner, 1988). Furthermore, the portion of the leaf or stem external to the seal in the pressure chamber unit must be minimised to reduce exclusion errors (Miller and Hansen, 1975; Hsiao, 1990).
Several technical guidelines must be adhered to in order to reduce pressurisation problems within the chamber. Failure to achieve pressure equilibrium should be addressed by ensuring that the seal used in the pressure chamber is made of rubber that is sufficiently elastic to fill the indentations of irregularly shaped petioles, but not so soft that it disintegrates under pressure. For very irregular petioles, a quick-;setting silicon compound can be used. However, this slows down the number of leaves that can be measured (Turner, 1988). High-;pressure grease or a silicon adhesive compound should be used on the stopper to prevent or reduce leakage and to prevent leaf damage. Studies on the optimal rates of pressurisation of the chamber and the effects of rapid pressure and heat build-;up within the chamber have shown that fast rates of pressurisation can lead to both underestimates or overestimates of water potential depending on the gradients of water potential in the sample (Waring and Cleary, 1967; Blum et al., 1973; Tyree and Dainty, 1973; Turner, 1981). Therefore, Turner (1981) suggested an average pressurisation rate of 0.025 MPa·s-;1. Furthermore, caution must be taken in the use of the compressed gas within the pressure chamber. Pressure-;release valves protect the pressure gauges and also help prevent over-;pressurisation of the chamber (Turner, 1988). A binocular microscope or safety glasses should be used to protect the operator's eyes if any material is forced out through the seal during pressurisation (Turner, 1988).
Correct identification of the endpoint, when the xylem sap just returns to the cut surface of the xylem, is critical for accurate estimation of the water potential (Ritchie and Hinckley, 1975; Turner, 1988; Campbell, 1990; Hsiao, 1990; Smith and Prichard, 2003). Use of a binocular microscope or magnifying glass may be necessary to minimise poor endpoint recognition.
Field equipment required for leaf water potential measurements is relatively easy to set up within a specific location, but can be cumbersome when there are many sample sites which are not in close proximity to each other. When accounting for the time required for setting up of the instrument, gathering of samples and the actual measurement at predawn, only a limited number of measurements is possible within this timeframe. Therefore, from a practical view point this method would be more appropriate for localised measurements, as compared to large-;scale measurements.
Leaf chlorophyll fluorescence
Over the past decade, chlorophyll fluorescence kinetics has been used more extensively to provide considerable information on the organisation and function of the photosynthetic apparatus (Govindjee et al., 1981). Information is gathered more readily and repeatedly outside the laboratory using portable optical systems and compact chlorophyll fluorescence meters.
The functioning of the photosynthetic apparatus is dependent on the process of photosynthesis, whereby light energy is absorbed and converted into organic compounds. Several environmental factors, including water, light and nutrients, affect this process and may lead to plant stress. Therefore, the photosynthetic apparatus has been recognised as being a good indicator of stress and stress adaptation of a plant and is associated with the measurement of chlorophyll fluorescence (Salisbury and Ross, 1992; Strasser and Tsmilli-;Michael, 2001; Strasser et al., 2001). Also, because changes in chlorophyll fluorescence may occur before any physical signs of tissue or chlorophyll deterioration are manifested in the plant, stress can be detected before the onset of physical damage (Lichtenthaler et al., 2007).
Chlorophyll fluorescence measurements can be described using the typical phases of a temporary fluorescence signal or transient. During a typical fluorescence transient, the fluorescence rises rapidly from a ground state, O (or Fo) initial or minimal fluorescence, when all electron acceptors are fully oxidised, or open, to a maximum level, P (or Fm), when all electron acceptors are highly reduced, or closed and are unable to accept and transfer electrons (Rolando and Little, 2003). Various parameters representing subsequent phases in a typical fluorescence transient can yield information on how stress affects the functioning of the photosynthetic system (Strasser et al., 2001; Rolando and Little, 2003). Photochemical efficiency is a common parameter used to assess the effect of environmental stresses on the photosynthetic mechanism (Strasser and Tsmilli-;Michael, 2001). The photochemical efficiency of Photosystem II (PSII) is estimated by Fv/Fm, which is the ratio of variable fluorescence (Fv) to maximum fluorescence (Fm). Most healthy plants exhibit Fv/Fm values of around 0.8 (Peterson et al., 2001).
In most studies on the applications of chlorophyll fluorescence, the Fv/Fm ratio is used as an indicator of water stress (Govindjee et al., 1981; Havaux and Lannoye, 1983; Ögren, 1990; Van Rensburg et al., 1996; Van der Mescht et al., 1997; Lu and Zhang, 1999; Peterson et al., 2001; Rolando and Little, 2003; Cifre et al., 2005). In these studies, it has been well documented that at the chloroplast level, the function of the thylakoid membrane is sensitive to environmental stress (Öquist, 1987). Studies which have focused on deep-;rooted exotic tree species have suggested that a decrease in Fv/Fm is due to drought-;induced injury to the thylakoid structures affecting photosynthetic electron transport (Van Rensburg et al., 1996; Van der Mescht et al., 1997; Lu and Zhang, 1999). These results indicated that Fv/Fm of drought-;stressed trees was lower than the control trees, especially in the more drought-;intolerant trees. Van Rensburg et al. (1996) found that the decrease in Fv/Fm was due largely to an increase in Fo, an indication of permanent damage to the PSII. PSII appears to be particularly sensitive to a number of stress factors including freezing temperatures and drought (Öquist and Wass, 1988). Rolando and Little (2003) also showed a decrease in Fv/Fm of water-;stressed Eucalyptus grandis seedlings, resulting from a rise in Fo and a decrease in Fm. Since this ratio is a reflection of the maximum yield of primary photochemistry, Fv/Fm is also used as an indicator of tree or seedling vigour.
Water stress leads to several other changes in the photosynthetic apparatus of plants. Low water potential has been observed to cause a decrease in the quantum yield of O2 evolution in chloroplasts and leaves from sunflower plants; a decrease in the ability of the coupling factor isolated from spinach leaves to bind fluorescent nucleotides; and a decrease in the ratio of the maximum to the minimum fluorescence in the red algae Porphyrs sanjuanesis (Govindjee et al., 1981). Data presented on the relationship between maximum to minimum fluorescence ratios and the water potential of leaves of Nerium oleander, Atriplex triangularis and Tolmiea menziesii, suggest that water stress blocks electron flow to the reaction centre chlorophyll a of PSII (Govindjee et al. (1981). It was clear from these results that the ratio of maximum to minimum fluorescence decreases from a high value of 4.0 in well-;watered Nerium oleander plants (water potential -;0.8 MPa) to a low value of 1.1 in a severely stressed plant (water potential -;3.9 MPa). In all cases examined, the ratio decreased as the water potential decreased. Because of these results, Govindjee et al. (1981) concluded that water stress inhibited electron flow of PSII in the 3 species examined, and that this ratio serves as a qualitative indicator of leaf water potential.
The use of chlorophyll fluorescence ratios as an index of plant water stress has gained increasing acceptance in recent years, and is commonly measured using hand-;held relatively low-;cost portable instruments which are simple, rapid and non-;destructive (Peterson et al., 2001; Strasser et al., 2001; Strasser and Tsmilli-;Michael, 2001; Rolando and Little, 2003; Cifre et al., 2005; Lichtenthaler et al., 2007). With the development of an internal saturating light source in portable field fluorescence meters, chlorophyll fluorescence measurements can now be undertaken at any time of the day, from shaded or sunlit samples.
Chlorophyll fluorescence measurements can be used in conjunction with other techniques as a relatively quick initial screening method for assessing plant stress within a localised area. There have also been significant advances in the application of chlorophyll fluorescence at larger spatial scales over the past decade, allowing for spatial detection of chlorophyll fluorescence parameters using laser-;based fluorometers (Ounis et al., 2001; Cifre et al., 2005). Such technological improvements in chlorophyll fluorescence measurements would complement the ground-;truthing of remote sensing imagery. However, further investigations are needed to establish its applicability for different crops under different conditions (Cifre et al., 2005). A disadvantage is that these instruments have not yet been designed for commercial or operational use.
Chlorophyll and carotenoid pigment concentration
Plant pigment concentrations vary with species, ecotype and phenology, and are also affected by season and various kinds of natural and anthropogenic stresses (Gitelson and Merzylak, 1997). Healthy plants, those capable of maximum growth, are generally expected to have higher chlorophyll pigment concentrations than unhealthy plants. Reduced chlorophyll concentrations are often associated with stressed plants, with variations in total chlorophyll to carotenoid ratios used as stress indicators (Netto et al., 2005; Lichtenthaler et al., 2007). Carotenoids play an important role in protecting the photosynthetic apparatus, and regulate the flow of energy into and out of the photosynthetic system (Sims and Gamon, 2002; Netto et al., 2005). Two commonly used approaches have been adopted to quantify chlorophyll and carotenoid pigment concentrations in plants, viz. conventional chemical methods and field chlorophyll meters. Conventional chemical methods of pigment quantification require destructive sampling and time-;consuming laboratory analyses, whereas chlorophyll meters are simple, portable field instruments which permit rapid non-;destructive measurements.
Conventional analytical chemistry methods used for estimating chlorophyll and carotenoid pigment concentrations are seen to be most accurate, provided that correct sampling and laboratory procedures are followed. These methods make use of spectrophotometry to estimate pigment concentrations in plant extractions from the linear absorption characteristics of these pigments in polar extractants at specific wavelengths. Concentrations are calculated taking cognisance of the extractant and the specific extinction coefficients as described in Lichtenthaler (1987). Two precautions are recommended when sampling and during laboratory analysis: rapid and efficient collection of samples which must be immediately frozen using liquid nitrogen to prevent pigment deterioration, and minimal loss of pigment during laboratory extraction and dilution procedures in order to reduce the variability of the results. If the research is taking place in remote areas, liquid nitrogen can be substituted with sufficient dry ice or ice packs (Curran et al., 1990; Datt, 1998; Pinkard et al., 2006).
Chlorophyll meters are portable field instruments that allow for non-;destructive repetitive sampling; they have successfully been used to estimate the chlorophyll content of many plant species (Schaper and Chacko, 1991; Netto et al., 2005; Pinkard et al., 2006). A chlorophyll index derived from two peak reflectance wavelengths, 650 nm and 940 nm, is used to estimate the observed chlorophyll content in a sample. However, several factors such as different plant species, leaf weight, leaf age and growing conditions may affect the relationship between the chlorophyll index and actual chlorophyll concentration. Therefore, calibration curves are required for many species, site and experimental conditions (Pinkard et al., 2006).
Leaf-;water content
Relative leaf water content is an indirect and gross estimate of the changes in the water content in leaves (Canny and Huang, 2006). Most water in leaves resides in mesophyll cells. Volumetric changes in these cells occur as the balance shifts between the rate of evaporation from leaves and the rate of water supply to the leaves. Volumetric changes in the leaves of plants affect many internal plant conditions such as tension in the cell walls, exchange of water and carbon dioxide across cell membranes, osmotic pressure of vacuole contents, cell and tissue turgor, cell-;to-;cell contact and transport of water.
Measurements of the relative water content of leaf tissue are commonly used to assess the water status of plants (Barrs and Weatherley, 1962; Catsky, 1969; Turner, 1981; Joly, 1985; Yamasaki and Dillenburg, 1999; Shen et al., 2005; Canny and Huang, 2006). Relative leaf water content is expressed as the ratio of three weight determinations viz. fresh weight; dry weight and turgid weight of the leaf sample. It is calculated as the ratio of fresh weight minus dry weight to turgid weight minus dry weight.
It is mportant that sampling procedures are meticulous to prevent evaporative losses of water from the leaf samples (Barrs and Weatherley, 1962; Catsky, 1969; Turner, 1981; Joly, 1985; Yamasaki and Dillenburg, 1999; Shen et al., 2005; Canny and Huang, 2006). Samples must be stored immediately in plastic bags and kept in a cool, dark place to reduce moisture loss prior to fresh weight measurements. Furthermore, the validity of relative water content measurements depends on the precision of the three weight determinations; a reliable estimate of turgid weight being the most critical (Joly, 1985).
A typical water absorption curve for a leaf shows a high initial rate of absorption, followed by a prolonged period of slow absorption (Yamasaki and Dillenburg, 1999). The amount of water initially absorbed has been commonly interpreted as being the amount of water needed to compensate for the water deficit of the plant tissue. Further water absorption is driven by cell expansion, so that mass changes occurring during this phase are not used in the estimation of the relative water content of the sample. Therefore, an accurate measurement of turgid weight should be determined at the end of the first initial phase of water absorption (Yamasaki and Dillenburg, 1999).
Water absorption periods usually recommended for conifers range from 12 to 48 hours, which is much longer than the 4 hour period usually required for most broad leaved plants (Yamasaki and Dillenburg, 1999). To reduce water absorption periods, smaller leaf disks which absorb water more quickly are commonly used instead of larger whole leaves (Barrs and Weatherley, 1962). This method may however, also allow more water infiltration through intercellular spaces, thereby resulting in a greater water absorption per unit of leaf mass, when compared to absorption in whole leave (Barrs and Weatherley, 1962; Joly, 1985).
Measuring the relative leaf water content of plants is a simple yet time-;consuming process. Comparative measurements between stressed and unstressed plants should be undertaken during the morning when differences in water potentials between plants are greatest (Cleary and Zaerr, 1984). Due to these time constraints this method is most appropriate for localised ground-;truthing measurements.
Comparison of ground-;based measurement techniques for measuring plant water stress
It has been suggested in this review that all 4 ground-;based measurements, viz. predawn leaf water potentials, chlorophyll fluorescence, chlorophyll and carotenoid pigment concentrations and leaf water content can be used successfully to measure or assess plant water stress. However, these 4 methods are not suitable for large spatial scale sampling, and would be most useful for localised studies or for localised ground-;truthing of remote sensing applications. Sampling protocols for ground-;truthing applications are dependent upon the spatial scales at which the remote sensing studies are being undertaken, viz. leaf, canopy, stand or landscape scale and, hence sample sizes will differ accordingly. A summary of some of the advantages and disadvantages of each ground-;based method is listed in Table 2.
These 4 ground-;based measurements vary in their practical use as well as in the physiological processes measured. Differences in these methods as well as the processes measured may be affected by different sources of variability, which in turn may affect the strength of the relationship to spectral indices (Stimson et al., 2005). As a result, strong relationships may exist between certain ground measurements and spectral indices, while others may be poorer for a specific plant species. For example the water band index derived by Gao (1995) focused on water content of vegetation and therefore could be more strongly correlated to leaf water content measurements than plant pigment concentrations and vice versa.
Different ground-;based measurements of plant water stress may be preferred depending upon the research conditions under which a particular method is being applied. For airborne and satellite remote sensing vegetation studies, ground-;truthing techniques which are cost effective, efficient and reliable and can be applied over localised ground-;truthing regions within a reasonable time-;frame of acquiring the remote sensing images would be preferred. Under such research conditions measurements of chlorophyll fluorescence or leaf water content would be more suited. On the other hand, measurements of predawn leaf water potential or chlorophyll pigment concentrations could be used for smaller-;scale intensive sampling. However, should costs be constraining factor predawn leaf water potential measurements would be preferred over laboratory analyses of plant chlorophyll pigment concentrations.
In summary it is recommended that a more complete but practical approach to assessing plant water stress is adopted. At least one ground-;based technique such as plant pigment concentrations, chlorophyll fluorescence or relative leaf water content should be used for localised ground-;truthing measurements to identify gradients in plant water stress, followed by intensive predawn leaf water potential measurements along these gradients to identify the extremes in plant water stress.
Concluding remarks
This review demonstrates that there has been extensive research on the detection and measurement of plant water stress using ground-;based and remote sensing technologies. Ground-;based techniques are more suited for localised measurements and for ground-;truthing of remotely sensed data. Remote sensing research has identified several individual spectral bands and vegetation spectral reflectance indices which have been used to detect plant water stress. Many of the earlier studies have focused on broad spectral bandwidths and it is recommended that plant stress researchers utilise the spectral findings to further investigate the potential of narrow hyperspectral bandwidths to detect and interpret patterns of plant stress. Furthermore, the importance of the red edge defined as the region between 690 and 740 nm has gained increasingly more attention over the years, and is seen as one of the most important regions of the spectrum when investigating plant stress. It is also recommended that the results from hyperspectral studies should be incorporated in multispectral technologies through modified imaging systems or spectral filters to allow for specialised high spectral resolution investigations to be undertaken with reduced data volumes in a cost-;effective manner. Most spectral indices have been derived for a single species with constant leaf size and shape, leaf surface and internal structure, implying that their usefulness varies with respect to species and site conditions. Therefore, the most commonly used indices reported in the literature must be evaluated against ground-;truthing data. Ground-;truthing of remote sensing data is not an easy task especially when considering different temporal and spatial scales. Depending upon the scale at which an investigation is being undertaken, it is recommended that a practical approach to assessing plant water stress is adopted through the use of at least one ground-;based measurement, viz. plant pigment concentrations, chlorophyll fluorescence or relative leaf water content to identify gradients in plant stress, and to then undertake predawn leaf water potential measurements along this gradient, specifically to identify the extremes in plant water stress.
Acknowledgements
Acknowledgement for funding for this work is made to the Mine Woodlands Project (School of Animal, Plant and Environmental Sciences, University of the Witwatersrand, Johannesburg, South Africa), the South African Department of Trade and Industry (THRIP funding), AngloGold Ashanti Ltd. and the CSIR.
References
ALDER NN, SPERRY JS and POCKMAN WT (1996) Root and stem xylem embolism, stomatal conductance, and leaf turgor in Acer grandidentatum populations along a soil moisture gradient. Oecol. 105 293-;301. [ Links ]
ARANDA I, CASTRO L, PARDOS M, GIL L and PARDOS JA (2005) Effects of the interaction between drought and shade on water relations, gas exchange and morphological traits in cork oak (Querucus suber L.) seedlings. For. Ecol. Manage. 210 117-;129. [ Links ]
ASNER GP (1998) Biophysical and biochemical sources of variability in canopy reflectance. Remote Sens. Environ. 64 234-;253. [ Links ]
BARET F and JACQUEMOUD S (1994) Model inversion to retrieve canopy characteristics from high spectral resolution data. Proc. 6th Int. Symp. Physical Measurements and Signatures in Remote Sensing. 17-;21 January 1994, Val d'Isère, France. [ Links ]
BARET F, VANDERBILT VC, STEVEN MD and JACQUEMOUD S (1994) Use of spectral analogy to evaluate canopy reflectance sensitivity to leaf optical properties. Remote Sens. Environ. 48 253-;260. [ Links ]
BARRS HD and WEATHERLY PE (1962) A re-;examination of the relative turgidity technique for estimating water deficits in leaves. Aus. J. Biol. Sci. 15 413-;428. [ Links ]
BLACKBURN GA (1998a) Quantifying chlorophylls and carotenoids at leaf and canopy scales: an evaluation of some hyperspectral approaches. Remote Sens. Environ. 66 273-;285. [ Links ]
BLACKBURN GA (1998b) Spectral indices for estimating photosynthetic pigment concentrations: a test using senescent tree leaves. Int. J. Remote Sens. 19 657-;675. [ Links ]
BLACKBURN GA (1999) Relationship between spectral reflectance and pigment concentrations in stacks of deciduous broadleaves. Remote Sens. Environ. 70 224-;237. [ Links ]
BLACKBURN GA (2007) Hyperspectral remote sensing of plant pigments. J. Exp. Bot. 58 855-;867. [ Links ]
BLUM A, SULLIVAN CY and EASTIN JD (1973) On the pressure chamber technique for estimating leaf water potential in sorghum. Agron. 65 337-;338 [ Links ]
BOYER JS (1968) Relationship of water potential to growth of leaves. Plant Phys. 43 1056-;1062. [ Links ]
CAMPBELL GS (1990) Instrumentation of studying vegetation canopies for remote-;sensing in optical and thermal infrared regions -; water potential in soils and plants. Remote Sens. Rev. 5 249-;261. [ Links ]
CAMPBELL PKE, MIDDLETON EM, McMURTREY JE, CORP LA and CHAPPELLE EW (2007) Assessment of vegetation stress using reflectance or fluorescence measurements. J. Environ. Qual. 36 832-;845. [ Links ]
CANNY MJ and HUANG CX (2006) Leaf water content and palisade cell size. New Phytol. 170 75-;85. [ Links ]
CARTER GA (1993) Responses of leaf spectral reflectance to plant stress. Am. J. Bot. 80 239-;243. [ Links ]
CATSKY J (1969) Temperature effects in the measurement of water saturation deficit (relative water content) in tobacco and kale. Biol. Plantarum 11 381-;383. [ Links ]
CECCATO P, FLASSE S, TARANTOLA S, JACQUEMOUD S and GREGOIRE J-;M (2001) Detection vegetation leaf water content using reflectance in the optical domain. Remote Sens. Environ. 77 22-;33. [ Links ]
CHAMPAGNE CM, STAENZ K, BANNARI A, McNAIRIN H and DEGUISE JC (2003) Validation of a hyperspectral curve fitting model for the estimation of plant water content of agricultural canopies. Remote Sens. Environ. 87 148-;160. [ Links ]
CHEN J (1999) Spatial scaling of a remotely sensed surface parameter by contexture. Remote Sens. Environ. 69 30-;42. [ Links ]
CHUN-;JIANG Z, JI-;HUA W, LIANG-;YUN L, WEN-;JIANG H and QI-;FA Z (2006) Relationship of 2 100-;2 300nm spectral characteristics of wheat canopy to leaf area index and leaf N as affected by leaf water content. Pedosphere 16 333-;338. [ Links ]
CIFRE J, BOTA J, ESCALONA JM, MEDRANO H and FLEXAS J (2005) Physiological tools for irrigation scheduling in grapevine (Vitis vinifera L.) An open gate to improve water-;use efficiency. Agric. Ecosys. Environ. 106 159-;170. [ Links ]
CLAY DE, CHANG KKJ, CLAY SA, and DALSTED K (2006) Characterizing water and nitrogen stress in corn using remote sensing. Agron. J. 98 579-;587. [ Links ]
CLEARY B and ZAERR J (1984) Guidelines for Measuring Plant Moisture Stress with a Pressure Chamber. PMS Instrument Company. Royal Oaks Drive, Corvallis, Oregon, USA. [ Links ]
COLLINS W, CHANGE SH, RAINES G, CANNEY F and ASHLEY R (1983) Airborne biogeophysical mapping of hidden mineral deposits. Ecol. Geol. 78 737-;749. [ Links ]
COOPS N, DURY S, SMITH ML, MARTIN M and OLLINGER S (2002) Comparison of green leaf eucalypt spectra using spectral decomposition. Aust. J. Bot. 50 567-;576. [ Links ]
COOPS N, STONE C, CULVENOR DS, CHISHOLM LA and MERTON RN (2003) Chlorophyll content in eucalypt vegetation at the leaf and canopy scales as derived from high resolution spectral data. Tree Physiol. 23 23-;31. [ Links ]
CURRAN PJ, DUNGAN JL and GHOLZ HL (1990) Exploring the relationship between reflectance red edge and chlorophyll content in slash pine. Tree Physiol. 7 33-;48. [ Links ]
CURRAN PJ, DUNGAN JL, MACLER BA and PLUMMER SE (1992) The effect of a red leaf pigment on the relationship between red-;edge and chlorophyll concentration. Remote Sens. Environ. 35 69-;75. [ Links ]
DATT B (1998) Remote sensing of chlorophyll a, chlorophyll b, chlorophyll a + b, and total carotenoid content in Eucalyptus leaves. Remote Sens. Environ. 66 111-;121. [ Links ]
DATT B (1999) A new reflectance index for remote sensing of chlorophyll content in higher plants: tests using Eucalyptus leaves. J. Plant Physiol. 154 30-;36. [ Links ]
DE TAR WR, PENNER JV and FUNK HA (2006) Airborne remote sensing to detect plant water stress in full canopy cotton. Trans. Soc. Agric. Bio. Eng. 49 655-;665. [ Links ]
DIXON HH (1914) Transpiration and the Ascent of Sap in Plants. Macmillan, London. 75p. [ Links ]
EITEL JUH, GESSELER PE, SMITH AMS and ROBBERECHT R (2006) Suitability of existing and novel spectral indices to remote detect water stress in Populus spp. For. Ecol. Manage. 229 170-;182. [ Links ]
FILELLA I and PENUELAS J (1994) The red edge position and shape as indicators of plant chlorophyll content, biomass and hydric status. Int. J. Remote Sens. 15 1459-;1470. [ Links ]
FITZGERALD GJ, RODRIGUEZ D, CHRISTENSEN LK, BELFORD R, SADRAS VO and CLARKE TR (2006) Spectral and thermal sensing for nitrogen and water status in rainfed and irrigated wheat environments. Precis. Agric. 7 233-;248. [ Links ]
FOUTRY T and BARET F (1997) Vegetation water and dry matter contents estimated from top of the atmosphere reflectance data: a simulation study. Remote Sens. Environ. 61 34-;45. [ Links ]
GAO BC (1995) Normalized difference water index for remote sensing of vegetation liquid water from space. Proc. Int. Soc. Optical Eng. 2480 225-;236. [ Links ]
GAUSSMAN HW (1977) Reflectance of leaf components. Remote Sens. Environ. 6 1-;9. [ Links ]
GIANNICO C (2004) Remote sensing of vegetation in the calabrian region. Acta Astronaut. 60 119-;131. [ Links ]
GITELSON AA and MERZLYAK MN (1996) Signature analysis of leaf reflectance spectra: algorithm development for remote sensing of chlorophyll. J. Plant Physiol. 148 494-;500. [ Links ]
GITELSON AA and MERZLYAK MN (1997) Remote estimation of chlorophyll content in higher plant leaves. Int. J. Remote Sens. 18 2691-;2697. [ Links ]
GITELSON AA, ZUR Y, CHIVKUNOVA OB and MERZLYAK MN (2002) Assessing carotenoid content in plant leaves with reflectance spectroscopy. Photochem. and Photobiol. 75 272-;281. [ Links ]
GOVINDJEE DOWNTON WJS, FORK DC and ARMOND PA (1981) Chlorophyll a fluorescence transient as an indicator of water potential of leaves. Plant Sci. Letter 20 191. [ Links ]
GUYOT G and BARET F (1988) Utilization of high spectral resolution to follow the state of vegetable cover. Proc. 4th Int. Symp. Spectral Signatures of Objects in Remote Sens. 18-;22 January, Aussois, France. pp. 54-;61. [ Links ]
HACKE U and SAUTER JJ (1996) Drought-;induced xylem dysfunction in petioles, branches and roots of Populus balsamifera L. and Alnus glutinosa (L.) Gaertn. Plant Physiol. 111 413-;417. [ Links ]
HARRIS A, BRYANT RG and BAIRD AJ (2006) Mapping the effects of water stress on Sphagum: Preliminary observations using airborne remote sensing. Remote Sens. Environ. 100 363-;378. [ Links ]
HAVAUX M and LANNOYE R (1983) Chlorophyll fluorescence induction: a sensitive indicator of water stress in maize plants. Irrig. Sci. 4 147-;151. [ Links ]
HOPE A, BURVALL A, GERMISHUYSE T and NEWBY T (2009) River flow responses to changes in vegetation cover in a South Africa fynbos catchment. Water SA 35 55-;60. [ Links ]
HORLER DNH, DOCKRAY M and BARBER J (1983) The red edge of plant reflectance. Int. J. Remote Sens. 4 273-;288. [ Links ]
HSIAO TC (1973) Plant responses to water stress. Ann. Rev. Plant Physiol. 24 519-;570. [ Links ]
HSIAO TC (1990) Plant-;atmosphere interactions, evapo-;transpiration, and irrigation scheduling. Acta Hort. 278 55-;66. [ Links ]
HUNT ER and ROCK BN (1989) Detection of changes in leaf water content using near-; and middle infrared reflectances. Remote Sens. Environ. 30 43-;54. [ Links ]
INTRIGLIOLO DS and CASTEL JR 2006 Performance of various water stress indicators for prediction of fruit size response to deficit irrigation in plum. Agric. Water Manage. 83 173-;180. [ Links ]
JACKSON TJ, CHEN D, COSH M, LI F, ANDERSON M, WALTHALL C, DORIASWAMY P and HUNT ER (2004) Vegetation water content mapping using Landsat data derived normalized difference water index for corn and soybeans. Remote Sens. Environ. 92 475-;482. [ Links ]
JACQUEMOUD S (1993) Inversion of the PROSPECT + SAIL canopy reflectance model from AVIRIS equivalent spectra: theoretical study. Remote Sens. Environ. 44 281-;292. [ Links ]
JIANG Z, HUETE AR, CHEN J, CHEN Y, LI J, YAN G and ZANG X (2006) Analysis of NDVI and scaled difference vegetation index retrievals of vegetation fraction. Remote Sens. Environ. 101 366-;378. [ Links ]
JOLY RJ (1985) Techniques for determining seedling water status and their effectiveness in assessing stress. Proc. Evaluating Seedling Quality: Principles, Procedures and Predictive Abilities of Major Tests. 16-;18 October 1984, Forest Research Laboratory, Oregon State University, Corvallis, US. [ Links ]
JONES HG (2004) Irrigation scheduling: advantages and pitfalls of plant-;based methods. J. Exp. Bot. 55 2427-;2436. [ Links ]
LAMONT BB, REES RG, WITKOWSKI ETF and WHITTEN VA (1994) Comparative size, fecundity and ecophysiology of roadside plants of Banksia hookeriana. J. App. Ecol. 31 137-;144. [ Links ]
LAMONT BB and WITKOWSKI ETF (1995) A test for lottery recruitment among four Banksia species based on their demography and biological attributes. Oecol. 101 299-;308. [ Links ]
LELONG CCD, PINET PC and POILVÉ H (1998) Hyperspectral imaging and stress mapping in agriculture: a case study on wheat in Beauce (France). Remote Sens. Environ. 66 179-;191. [ Links ]
LICHTENTHALER HK (1987) Chlorophyll and carotenoids: Pigments of photosynthetic biomembranes. Methods Enzym. 148 331-;382. [ Links ]
LICHTENTHALER HK, ALEXANDER AC, MAREK MV, KALINA J and URBAN O (2007) Differences in pigment composition, photosynthetic rates and chlorophyll fluorescence images of sun and shade leaves of four tree species. Plant Physiol. Biochem. 1-;12. [ Links ]
LICHTENTHALER HK, BUSCHMANN C, RINDERLE U and SCHMUCH G (1996) Application of chlorophyll fluorescence in ecophysiology. Radiat. Environ. Biophys. 25 297-;308. [ Links ]
LINTON MJ, SPERRY JS AND WILLIAMS DG (1998) Limits to water transport in Juniperus osteosperma and Pinus edulis: implications for drought tolerance and regulation of transpiration. Funct. Ecol. 12 906-;911. [ Links ]
LU C and ZHANG J (1999) Effects of water stress on photosystem II photochemistry and its thermostability in wheat plants. J. Exp. Bot. 50 1199-;1206. [ Links ]
MILLER BD and HANSEN GK (1975) Exclusion errors in pressure chamber estimates of leaf water potential. Ann. Bot. 39 915-;920. [ Links ]
MILTON NM and MOUAT DA (1989) Remote sensing of vegetation responses to natural and cultural environmental conditions. Photogramm. Eng. Remote Sens. 55 1167-;1173. [ Links ]
MOHAMMED GH, SAMPSON PH, COLOMBO SJ, NOLAND TL and MILLER J.R., (1997) Bioindicators of Forest Sustainability: Development of a Forest Condition Rating System for Ontario. Forest Research Information Paper No. 137, Ontario Forest Research Institute, Ontario, Canada. 22 pp. [ Links ]
MULLER NJC (1874) Investigations about the diffusion of the atmospheric gases and the gas removal under different lighting terms. Ann. Sci. Bot. 9 36-;49. [ Links ]
MURTHA PA (1982) Detection and analysis of vegetation stress. In: CJ Johannsen and JL Sanders (eds.) Remote Sensing for Resource Management. Soil Conservation Society of America. Ankeny, Iowa, USA. pp 141-;158. [ Links ]
MUSICK HB and PELLETIER RE (1986) Response of some Thematic Mapper band ratios to variation in soil water content. Photogramm. Eng. Remote Sens. 52 1661–1668. [ Links ]
MUSICK HB and PELLETIER RE (1988) Response to soil moisture of spectral indexes derived from bidirectional reflectance in Thematic Mapper wavebands. Remote Sens. Environ. 25 167-;184. [ Links ]
NETTO AT, CAMPOSTRINI E, DE OLIVEIRA JG and BRESSAN-;SMITH RE (2005) Photosynthetic pigments, nitrogen, chlorophyll a fluorescence and SPAD-;502 readings in coffee leaves. Sci. Hortic. 104 199-;209. [ Links ]
NORTES PA, PASTOR-;PÉREZ A, EGEA G, CONEJERO W and DOMINGO R (2005) Comparison of changes in stem diameter and water potential values for detecting water stress in young almond trees. Agric. Water Manage. 77 296-;307. [ Links ]
ÖGREN E (1990) Evaluation of chlorophyll fluorescence as a probe for drought stress in willow leaves. Plant Physiol. 93 1280-;1285. [ Links ]
ÖQUIST G and WASS R (1988) A portable, microprocessor operated instrument for measuring chlorophyll fluorescence kinetics in stress physiology. Physiol. Plantarum 73 211-;217. [ Links ]
ÖQUIST G (1987) Environmental stress and photosynthesis. In: J Biggins (ed.) Progress in Photosynthesis Research. Martinus Nijhoff Publishers, Dordrecht, The Netherlands. Vol. IV 1-;10. [ Links ]
OUNIS A, EVAINS, FLEXAS J, TOSTI J and MOYA I (2001) Adaptation of a PAM-;fluorometer for remote sensing of chlorophyll fluorescence. Photosyn. Res.68 113-;120. [ Links ]
PELLEGRINO A, GOZÉ E, LEBON E and WERY J (2006) A model based diagnostic tool to evaluate the water stress experienced by grapevine in field sites. Eur. J. Agron. 25 49-;59. [ Links ]
PENUELAS J, FILELLA I, BIEL C, SERRANO L and SAVE R (1995) The reflectance at the 950-;970 region as an indicator of plant water status. Int. J. Remote Sens. 14 1887-;1905. [ Links ]
PETERSON JA, GRONINGER JW, SEILER JR and MOU P (2001) Utility and limitations of chlorophyll fluorescence for the determination of growth limitations in trees. Proc. 10th Bienn. Southern Silvicult. Res. Conf. LA, USA?. USDA Technical Report. SRS-;30. 480-;484. [ Links ]
PINKARD EA, PATEL V and MOHAMMED C (2006) Chlorophyll and nitrogen determination for plantation-;grown Eucalyptus nitens and Eucalyptus globules using a non-;destructive meter. For. Ecol. Manage. 223 211-;217. [ Links ]
PU R, GE S, KELLY NM and GONG P (2003) Spectral absorption features as indicators of water status in coast live oak (Quercus agrifolia) leaves. Int. J. Remote Sens. 24 1799-;1810. [ Links ]
RITCHIE GA and HINCKLEY TM (1975) The pressure chamber as an instrument for ecological research. Adv. Ecol. Res.9 165-;255. [ Links ]
ROCK BN, HOSHIZAKI T and MILLER JR (1988) Comparison of in situ and airborne spectral measurements of the blue shift associated with forest decline. Remote Sens. Environ. 24 109-;127. [ Links ]
ROLANDO CA and LITTLE KM (2003) Using chlorophyll fluorescence to determine stress in Eucalyptus grandis seedlings. S. Afr. For. J. 197 5-;12. [ Links ]
SALISBURY FB and ROSS CW (1992) Plant Physiology (4th edn.).Wadsworth Publishing Company, California, USA. 682 pp. [ Links ]
SCHAPER H and CHACKO EK (1991) Relation between extractable chlorophyll and portable chlorophyll meter readings in leaves of eight tropical and subtropical fruit tree species. J. Plant Physiol. 138 674-;677. [ Links ]
SCHOLANDER PF, HAMMEL HT, BRADSTREET EA and HEMMINGSEN EA (1965) Sap pressure in vascular plants. Sci. 148 339-;346. [ Links ]
SEPULCRE-;CANTÓ G, ZARCO-;TEJADA PJ, JIMÉNEZ-;MUNOZ JC, SOBRINO JA, DE MIGUEL E and VILLALOBOS FJ (2006) Detection of water stress in an olive orchard with thermal remote sensing imagery. Agric. For. Meteorol. 136 31-;44. [ Links ]
SHEN Y, ZHENG RS and YAN CY (2005) Estimation models for vegetation water content at both leaf and canopy levels. Inst. Elec. Electron. Eng. 2 1387-;1389. [ Links ]
SIMS DA and GAMON JA (2002) Relationships between leaf pigment content and spectral reflectance across a wide range of species, leaf structures and development stages. Remote Sens. Environ. 81 337-;354. [ Links ]
SMITH R and PRICHARD T (2003) Using a pressure chamber in winegrapes: UC Cooperative Extension. www.cesonoma.ucdavis.edu/vitic/pdf/wine_grape_pressure_chamber.pdf (Accessed 2 October 2006). [ Links ]
SPERRY JS and SALIENDRA NZ (1994) Intra-; and inter-;plant variation in xylem cavitation in Betula occidentalis. Plant, Cell Environ. 17 1233-;1241. [ Links ]
STIMSON HC, BRESHEARS DD, USTIN SL and KEFAUVER C (2005) Spectral sensing of foliar water conditions in two co-;occurring conifer species: Pinus edulis and Juniperus monosperma. Remote Sens. Environ. 96 108-;118. [ Links ]
STONE C, CHISHOLM L and COOPS N (2001) Spectral reflectance characteristics of eucalypt foliage damaged by insects. Aust. J. Bot. 49 687-;698. [ Links ]
STRASSER RJ and TSIMILLI-;MICHAEL M (2001) Stress in plants, from daily rhythm to global changes detected and quantified by the JIP-;Test. J. Chim. Nouv. 75 3321-;3326. [ Links ]
STRASSER RJ, STRIVASTAVA A and TSIMILLI-;MICHAEL M (2001) Analysis of the fluorescent transient. In: GC Papageorgiou and WJS Govindjee (eds.) Chlorophyll Fluorescence: A Signature of Photosynthesis. Kluwer Academic Publishers, Dordrecht, The Netherlands. [ Links ]
TUCKER CJ (1980) Remote sensing of leaf water content in the near infrared. Remote Sens. Environ. 10 23-;32. [ Links ]
TURNER NC (1981) Techniques and experimental approaches for the measurement of plant water status. Plant and Soil 58 339-;366. [ Links ]
TURNER NC (1988) Measurement of plant water status by the pressure chamber technique. Irrig. Sci. 9 289-;308. [ Links ]
TYREE MT and DAINTY J 1973 The water relations of hemlock (Tsuga canadiensis). II. The kinetics of water exchange between symplast and apoplast. Can. J. Bot. 51 1481-;1489. [ Links ]
VAN DER MESCHT A, DE RONDE K, VAN DER MERWE T, LAURIE R, BESTER C and WENZEL C (1997) Evaluation of chlorophyll fluorescence as a measure of drought tolerance in Eucalyptus grandis. Proc. 4th IUFRO Conf. on Siviculture and Improvement of Eucalypts. August 1997, Embrapa, Salvador, Brazil. 117-;124. [ Links ]
VAN RENSBURG L, KRUGER GHJ, EGGENBERG P and STRASSER RJ (1996) Can screening criteria for drought resistance in Nicotiana tabacum L. be derived from the polyphasic rise of the chlorophyll a fluorescent transient (OJIP). S. Afr. J. Bot. 62 337-;341. [ Links ]
WARING RH and CLEARY BD (1967) Plant moisture stress: evaluation by pressure bomb. Sci. 155 1248-;1254. [ Links ]
WEATHERLEY PE (1950) Studies in the water relations of the cotton plant. I. The field measurement of water deficits in leaves. New Phytol. 49 81-;97. [ Links ]
WITKOWSKI ETF, LAMONT BB, WALTON C and RADFORD S (1992) Leaf demography, sclerophylly and ecophysiology of two banksias with contrasting leaf life spans. Aust. J. Bot. 40 849-;62. [ Links ]
YAMASAKI S and DILLENBURG LR (1999) Measurements of leaf relative water content in Araucaria Angustifolia. Rev. Bras. Fisiol. Veg. 11 69-;75. [ Links ]
ZARCO-;TEJADA PJ, MILLER JR, MOHAMMED GH and NOLAND TL (2000) Chlorophyll fluorescence effects on vegetation apparent reflectance. I. Leaf-;level measurements and model simulation. Remote Sens. Environ. 74 582-;595. [ Links ]
ZARCO-;TEJADA PJ, RUEDA CA and USTIN SL (2003) Water content estimation in vegetation with MODIS reflectance data and model inversion methods. Remote Sens. Environ. 85 109-;124. [ Links ]
Received 1 August 2008; accepted in revised form 14 September 2009.
* To whom all correspondence should be addressed.
+2733 2605276; fax: +2733 260 5266;
e-;mail: MGovender@csir.co.za
REVIEW
Wetlands and invertebrate disease hosts: are we askin for trouble?
HL MalanI, *; CC AppletonII; JA DayI; DiniIII
IFreshwater Research Unit, Dept. of Zoology, University of Cape Town, Rondebosch, Cape Town 7701, South Africa
IISchool of Biological & Conservation Sciences, University of KwaZulu-;Natal, Westville Campus, Durban 4000, South Africa
IIISouth African National Biodiversity Institute, Brummeria, Pretoria 0001, South Africa
ABSTRACT
Wetlands provide a range of benefits to society, and yet in South Africa wetlands continue to be affected by human activities. Considerable effort is now being directed towards rehabilitation of degraded wetlands and the construction of artificial systems to treat effluent and stormwater. At the same time, wetlands provide potential habitat for vectors or intermediate hosts (collectively referred to in this document as 'invertebrate disease hosts': IDHs), of parasites implicated in the transmission of such important diseases as malaria and schistosomiasis (bilharzia). The present review considers, for the 2 major IDHs (mosquitoes and schistosome-;transmitting snails), the type of habitat required by the water-;dependent life stage and the ways in which wetland degradation, rehabilitation and creation may affect the availability of suitable habitat. General practical measures for minimising pest species, particularly mosquitoes, are included. This review also highlights other issues that require research and testing in the South African context, including: the IDHs implicated in less well-;known diseases (both of humans and animals) and the control of mosquitoes and schistosome-;transmitting snails through biomanipulation. We conclude that in regions of the country where the diseases are prevalent there is the likelihood that wetland rehabilitation and creation could inadvertently encourage the IDHs responsible for transmitting malaria and schistosomiasis. Assessment of the potential risks and benefits of a proposed wetland modification needs to be undertaken in a holistic manner using an adaptive framework that recognises the critical need to balance human and environmental health. Possible ways of controlling IDHs both in an environmentally-; and socio-;friendly manner need to be investigated using a multi-;disciplinary approach engaging invertebrate biologists, health care officials, wetland scientists and also sociologists and economists.
Keywords: vectors, malaria, Anopheles arabiensis, Anopheles funestus, mosquitoes, schistosomiasis, bilharzia, Bulinus africanus, Bulinus globosus, wetland rehabilitation, wetland creation, wetland degradation
Introduction
In the past few decades, the importance of wetlands and the benefits they provide to society have gradually become acknowledged. The 'goods and services' supplied by these aquatic ecosystems range from flood control, to water quality amelioration, to provision of fish and building materials (Maltby et al.,1994; Kotze et al., 2008a). Yet in South Africa, as globally, wetlands continue to be affected by human activities. Considerable effort and money is now being directed towards rehabilitation of degraded wetlands. This is evidenced by the activities of the highly successful Expanded Public Works Programme Working for Wetlands which targeted 91 South African wetlands for rehabilitation in 2007/2008 alone, employing nearly 2 000 previously-;disadvantaged individuals to do so. Furthermore, the construction of artificial wetlands to treat and polish effluents and stormwater is becoming increasingly popular (Kadlec and Knight, 1996; Walton, 2003), since this technology is environmentally-;friendly and cost-;effective and therefore accessible to developing countries (Kengne et al., 2003).
At the same time, wetlands provide potential habitat for vectors or intermediate hosts (collectively referred to in this document as 'invertebrate disease hosts': IDHs) of parasites causing diseases of major importance to humans and their stock animals (Zimmerman, 2001). The various IDHs under consideration are dependent for all, or at least part, of their life-;cycles on water, including freshwater ecosystems such as rivers or wetlands. They have been implicated in the transmission of such diseases as malaria (Miller et al., 2007), schistosomiasis (bilharzia) (Boelee and Laamrani, 2004), filariasis (including river blindness: Davies and Day, 1998), fascioliasis (Appleton et al., 1995) and several arbovirus (arthropod-;borne virus) diseases such as Rift Valley fever and West Nile (Matthews and Brand, 2004; Jupp, 2005; WHO, 2008a; b). Many of these diseases are of special importance in Africa. It is a sobering fact that malaria (transmitted by the females of various species of Anopheles mosquitoes), is responsible for the death of between 1.5 and 2.7 m. people in sub-;Saharan Africa every year. The disease causes untold hardship and represents a severe burden for emerging economies (Keiser et al., 2005). Bilharzia (more correctly known as schistosomiasis), on the other hand, is carried by various species of aquatic pulmonate snails (Brown, 1994) and kills approximately 200 000 people annually in sub-;Saharan Africa (WHO, 2002). The number of people infected with either urinary or intestinal schistosomiasis, or both, in South Africa is estimated to be between 3 and 4 m (Moodley et al., 2003). Mortality estimates are unavailable but are likely to be low. Morbidity is, however, often severe (Cooppan et al., 1987).
Thus there exists a paradox: whilst wetlands are important in providing many benefits to society, they can also be a source of organisms carrying devastating diseases. Willott (2004) severely criticised the lack of awareness and concern by wetland scientists, claiming that '...primary texts in conservation biology and the majority of research papers addressing restoration and wetland construction generally do not acknowledge that mosquitoes create practical implementation problems and also problems for the theoretical case for restoration...'. In a recent review of wetlands and mosquitoes, Dale and Knight (2008) note a paucity of literature that considers both the values of wetlands and the costs resulting from the presence of mosquitoes. Perhaps to address some of these deficiencies, a review by the Scientific and Technical Review Panel of the Ramsar Convention on Wetlands examined the relationship between wetlands and human health (Ramsar, 2008a).
In light of the seriousness of some of the diseases involved, the increasing focus on wetland rehabilitation and creation, and the ongoing degradation of wetlands, it is important that this matter be investigated with regard to the situation in South Africa. The following questions (amongst others) need to be asked:
- Is there a difference in the number of IDHs in pristine wetlands compared to impacted ones?
- How can artificial wetlands be constructed in a way that minimizes IDH habitat?
- Is it possible to manage wetlands so as to avoid the propagation of nuisance species and at the same time maximise the ecosystem services wetlands provide?
- If not, is it ethical to create or restore habitat for IDHs in areas that could potentially give rise to serious illnesses?
The scope of this review
Wetlands are diverse ecosystems that range from permanent to temporary systems, inundated or saturated, with water that is static or flowing, fresh or saline (Ramsar, 1971). In the present paper we concentrate on wetlands that are characterised primarily by areas of standing, non-;saline water with emergent vegetation. Relevant information has also been drawn from other water bodies, both natural (rivers, salt marshes, lakes) and artificial (reservoirs, irrigation canals, constructed wetlands). Furthermore, only diseases that affect humans are considered here, although diseases that affect animals (both 'stock' and 'domestic') also need investigation. The review is limited primarily to IDHs that have been recorded in South Africa. To a lesser extent, those that occur in South Africa's neighbours are also considered, since one of the effects of climate change is the potential globally for diseases to change their distribution ranges (Poff et al., 2002; Mathews and Brand, 2004; Ramsar, 2008a).
The topic of Southern African wetlands and water-;related parasitic diseases of humans was reviewed by Appleton (1983) and Appleton et al. (1995). The present review aims to build on this work by considering, for each of the major IDHs in South Africa, the type of habitat required by the water-;dependent life stage, and the ways in which wetland degradation, rehabilitation and creation may affec t the availability of suitable habitat. This is followed by some general practical measures for minimising pest species, particularly mosquitoes.
The major diseases and their invertebrate hosts
Only a brief outline is presented here of the diseases considered and their invertebrate hosts. Descriptions of the life-;cycles of the parasites involved and their transmission routes are given for malaria, schistosomiasis, fascioliasis and other diseases in most medical parasitology textbooks and invertebrate texts.
Table 1 lists the major disease-;causing organisms, together with their invertebrate hosts, that are linked to wetlands in Africa. It is interesting to note that, in addition to malaria, mosquitoes are the vectors of pathogens causing several other serious diseases. According to Jupp (2005), 22 mosquito-;borne viruses have been isolated in Southern Africa, and of these 10 are known to be human pathogens. Four of them (chikungunya, sindbis, West Nile and Rift Valley fever) cause serious illness. One of the most pathogenic arboviruses, dengue, is not endemic to Southern Africa although it is spreading elsewhere in the world. While Aedes aegypti from KwaZulu-;Natal are competent vectors of this disease (Jupp, 2005), its failure to become established is attributable to several factors:
- The number of introduced infections is too low
- The monkey populations available to serve as reservoir hosts are too fragmented
- Infected vervet monkeys (i.e. non-;macaques) are likely to die of the disease (Swanepoel and Kemp, 2005).
Of the diseases listed, malaria and schistosomiasis are currently the most important from the point of view of human health and are discussed further in this review. Others, such as fascioliasis and several of the arboviruses may pose a threat, but at this stage little is known about their prevalence (Appleton et al., 1995; Jupp, 2005) and they require further investigation.
Malaria
Malaria has a long history of association with wetlands. The name was coined in 1690 by physician Francesco Torti from the Italian 'mal aria' or bad air – an allusion to the belief that noxious marsh gases caused the deadly disease (Langone, 2008). Today it is known that the disease is caused by Plasmodium parasites transmitted by various species of female Anopheles mosquitoes. More than 90% of the malaria cases in South Africa are caused by Plasmodium falciparum, the species that results in the most serious complication, cerebral malaria (Durrheim et al., 2001). Although globally there are many mosquito species, only a few are of concern as vectors of disease; furthermore, the species in a region vary geographically and temporally (Russell, 1999). In South Africa malaria is endemic to parts of Limpopo Province, Mpumalanga and northern KwaZulu-;Natal and also occurs in eastern Swaziland (Jupp, 2005). The most important vector of malaria in South Africa is Anopheles arabiensis (Appleton et al., 1995; Maharaj, 2003). Anopheles funestus and An. gambiae sensu stricto (s.s.) also occur in South Africa but are currently of less importance in transmitting the disease than is An. arabiensis. The situation is made more difficult by the fact that the mosquito vectors involved belong to complexes, each of which consist of several species that cannot be separated by morphology but only by laboratory techniques that distinguish them genetically. Identification to species level is important, since different species of the same complex, found in the same geographical regions, may have different environmental preferences and different degrees of vector competency, and thus vary in their ability to transmit malaria. Anopheles arabiensis, the most important malarial vector in South Africa and elsewhere in Africa, belongs to the complex An. gambiae sensu lato (s.l.). Two other vector species that are grouped within this complex have been known to occur in South Africa: An. gambiae s.s. and An. merus. Anopheles funestus s.s., on the other hand, belongs to the An. funestus s.l. complex. No other members of this complex are considered to be important in the transmission of malaria. It would seem, however, that An. gambiae s.s. and An. funestus were both eradicated from South Africa through the indoor DDT spraying programme by the 1980s (although see below).
Malaria in Africa is on the increase (WHO and UNICEF, 2003). In South Africa the period 1996 to 2000 saw an alarming increase in the number of reported cases of malaria with associated deaths rising from fewer than 50 per year to more than 450 which necessitated the limited, but still controversial, reintroduction of indoor spraying with the insecticide DDT (Attaran and Maharaj, 2000; Tren and Bate, 2004; Wells and Leonard, 2006). The mortality rate due to malaria has since returned to less than 50 per year and has stabilised at that level (DOH, 2008). This epidemic was at least partly due to the reintroduction of An. funestus. There is a high probability that this species has again been eradicated from South Africa, although it still occurs in southern Mozambique (Maharaj et al., 2005; Wells and Leonard, 2006). Thus, there is an ever-;present threat of resurgence due to the re-;entry of An. funestus and the development of resistance – both by the parasite to anti-;malarial drugs and by the vector to insecticides (WHO and UNICEF, 2006). The influx of infected refugees across South Africa's borders from countries such as Zimbabwe and Mozambique, where malarial control programmes are weak (Tren and Bate, 2004), increased travel by South Africans into malarial-;infested areas (Durrheim et al., 2001), and the possible spread of the disease beyond its current limits due to global climate change (Tanser et al., 2003; DEAT, 2006) are factors that may potentially contribute to increased malarial transmission in this country.
Schistosomiasis
There are 2 species of schistosomes (or blood flukes) that commonly cause serious human morbidity in South Africa. Schistosoma haematobium causes urinary schistosomiasis, and Schistosoma mansoni causes the intestinal form of the disease. All schistosomes have an obligatory intermediate host, a freshwater snail, in which asexual reproduction takes place, alternating with a human definitive host in which the parasite reproduces sexually. Although compared with malaria it has a low mortality rate in people, schistosomiasis is a chronic, debilitating disease that is especially prevalent in children (Thomas and Tait, 1984; Appleton et al., 1995). It may cause damage to the bladder, liver and intestine, lowers resistance of the host to other diseases, and often results in retarded growth and reduced cognitive development in children (WHO, 2002; Kvalsvig, 2003; WHO and UNICEF, 2006). Schistosomiasis is endemic to the eastern parts of South Africa, mainly the provinces of Limpopo, KwaZulu-;Natal and Mpumalanga, where prevalence rates of 60-;80% in schoolchildren from rural areas have been reported (Gear et al., 1980; Wolmarans et al., 2006). Two freshwater snails Bulinus africanus and B. globosus, serve as intermediate hosts for S. haematobium. Schistosoma mansoni is less widely distributed than the urinary parasite in South Africa and uses the snail Biomphalaria pfeifferi as its intermediate host.
Both Bulinus africanus and B. globosus belong to the B. africanus group of the genus Bulinus (Brown, 1994). There is, however, debate around the validity of the 2 species as they occur in South Africa, based on anatomical criteria. It is possible, since intermediate forms undoubtedly do exist, that they represent physiological extremes of a single eurythermal species. Comparative temperature studies (Shiff, 1964; Shiff and Garnett, 1967; Joubert et al., 1984; Joubert et al., 1986) have shown that B. globosus is better adapted to warmer conditions than B. africanus and this is reflected in the respective geographical ranges of the 2 'species' (Brown, 1966; De Kock and Wolmarans, 2005). In terms of parasitology, both species are susceptible to infection by S. haematobium but although the range of B. africanus covers most of the endemic area of the country, that of B. globosus covers the area with the highest prevalence.
The genus Biomphalaria belongs to the same family of snails as Bulinus and Biomphalaria pfeifferi is the only species occurring in South Africa (Brown, 1994). As is the case with B. africanus/globosus and the parasite S. haematobium, the distribution of B. pfeifferi is wider than that of S. mansoni.
Abiotic and biotic effects of wetland degradation, rehabilitation and creation
Wetlands in South Africa have been altered mainly by agricultural activities, by the mining sector and by urban development, leading to the loss of more than 50% of wetlands in some catchments (Kotze et al., 1995). A list of the major impacts, both direct and indirect, that result in wetland loss and degradation, in conjunction with the major associated abiotic or biotic effects, is shown in Table 2.
As can be seen from Table 2, a wide range of impacts occur in wetlands. The major abiotic effects include changes to wetland hydrology, frequently reducing wetland extent through deliberate draining, or the inadvertent formation of erosion gullies, which leads to reduced water retention. In some cases there is an increase in the extent of inundated areas due to the construction of weirs, berms or roads, or the creation of borrow pits. Water quality can be impaired due to pollution and direct impacts to the vegetation can be brought about by agricultural activities, burning and overgrazing. Only the major effects are noted in Table 2, but ancillary effects are also likely. For example, the discharge of effluents into a wetland may, in addition to changing water quality, have an effect on the biota.
It follows from the discussion above that rehabilitation of wetlands also encompasses a range of remedial activities that includes restoration of indigenous vegetation and removal of alien plants (and sometimes animals), reproducing natural processes and restoring the physical characteristics of the system (Duffield and Hill, 2002). From an analysis of the projects undertaken by Working for Wetlands, Kotze et al. (2008b) found that, in essence, the focus of rehabilitation interventions was to achieve one or more of 3 broad objectives: raising the water table, reinstating a more diffuse pattern of surface water flow, and stabilising eroding areas. The first 2, by altering the hydraulic habitat, may increase the extent of habitat available for IDHs. Russell (1999) noted that in regard to mosquito-;borne pathogens, the severity of disease is usually related to the number of adult mosquito vectors, which in turn, is related to the availability of suitable breeding sites. Another common rehabilitation activity is removal of alien plants. Alteration of the vegetation in a wetland can have implications for control of IDHs, as described later. Furthermore, changes in water quality may also encourage IDHs if this leads to a more favourable environment. In short, with regard to IDH populations the consequences of wetland degradation, rehabilitation or creation will depend on the specific environmental requirements of the aquatic life stage, be it of a mosquito or a schistosome-;carrying snail, as discussed in the next section.
Habitat requirements of the invertebrate disease hosts
The environmental requirements of both juveniles and adults differ for different species of IDHs. The snails that are the intermediate hosts of the schistosomiasis parasite require an aquatic habitat for their entire lives (Wolmarans et al., 2005), and are therefore limited in the extent to which they can disperse. Anopheline mosquitoes, on the other hand, require an aquatic habitat only in their immature stages. The adults are highly mobile and can select favourable sites for egg-;laying. Table 3 provides a summary of environmental requirements of the larvae of the key IDHs, as gleaned from the literature. According to Walker and Lynch (2007), larval habitat requirements differ not only between different species of the An. gambiae s.l. complex but even between different populations of the same species. Species were included in Table 3 only if reference was made to the particular species (e.g. An. gambiae s.s. and not An. gambiae s.l.).
Aquatic habitat requirements of anopheline larvae
There are important differences in breeding habitats used by females of the Anopheles gambiae and An. funestus complexes. Site selection and larval behaviour are influenced by several environmental factors (Impoinvil et al., 2008), including distance to human habitation and substrate type. Other important parameters are: the salinity and turbidity of the water, the size and degree of permanence of the water body, the amount of sunlight, the presence of emergent/floating vegetation and shade (Walker and Lynch, 2007). In general, larvae of anopheline mosquitoes, in common with larvae of most other mosquito species, are confined to still waters. This enables the larvae to remain close to the surface with their spiracles and breathing tubes open (Russell, 1999). In comparison to many other species of mosquitoes, anophelines prefer clean rather than polluted water (Walker and Lynch, 2007), although in urban areas in parts of Africa An. gambiae s.l. appears to be adapting to new habitats such as rubbish-;filled pools, sometimes containing sewage (Keating et al., 2003; Awolola et al., 2007).
The distribution of members of the An. gambiae complex within the endemic malaria area of South Africa appears to be opportunistic, depending largely on the availability of suitable breeding habitats. As can be seen from Table 3, larvae of the sibling species An. gambiae s.s.and An. arabiensis may be found in aquatic habitats ranging from rice fields, borrow pits and temporary pools to drinking-;water vessels, the water collecting in a cows' hoof prints, and even tyre tracks (Le Sueur and Sharp, 1988; Service and Townsend, 2002 cited in Walker and Lynch, 2007). On the Makathini Flats in north-;eastern KwaZulu-;Natal, one of South Africa's worst malaria areas, rice paddies, rain pools, cattle hoof prints and human footprints are all used by An. arabiensis for breeding, particularly during the transmission season. Natural rain pools and hoof/footprints are used more-;or-;less equally and constitute the primary breeding habitats for An. arabiensis. The major physical and chemical characteristics of these 3 habitat types are given by Le Sueur and Sharp (1988), Hamer and Appleton (1991) and Appleton et al. (1995).
In general there appears to be little difference in the environmental requirements of the larval stages of An. gambiae s.s.and An. arabiensis, both preferring sunny, temporary puddles or pools rather than permanent systems (Gillies and de Meillon, 1968; Gimnig et al., 2001; Koenraadt et al., 2004; Walker and Lynch, 2007). Adaptation to temporary aquatic habitats is enhanced by the short larval development times and the absence of predators. There are reports of An. gambiae larvae (species not given) surviving on moist and drying mud (Miller et al., 2007) but generally they are intolerant of desiccation. Several studies have observed temporal variation in abundance of the 2 species, however, suggesting that adults of An. arabiensis are better adapted to dry, hot conditions (Lindsay et al., 1998; Gimnig et al., 2001; Koenraadt et al., 2004), whereas An. gambiae s.s.prefers more humid conditions. Due to the temporary nature of the preferred breeding habitats, during the dry season these anopheline species over-;winter in perennial water bodies (Appleton et al., 1995) often some distance from the temporary ones to which they spread after the rains have started.
In contrast to the opportunistic habitat preferences of An. arabiensis and An. gambiae s.s., Anopheles funestus chooses permanent, standing water bodies in which to lay eggs. These are typically shaded and have dense vegetation, either floating or emergent (Mendis et al., 2000). The different breeding requirements of An. arabiensis and An. funestus can influence the presence/absence of malaria in an area. For example, the absence of malaria in the narrow 7-;8 km wide strip along the coast of northern KwaZulu-;Natal is probably because the local vector, An. funestus, was eliminated through the spraying of DDT (Hargreaves et al., 2000). Furthermore, because the area supported mainly perennial freshwater habitats such as lakes, pans and streams, the other vector species, An. arabiensis, could not survive, and as a result neither could malaria (Le Sueur, 1993). Current maps of malaria risk in South Africa produced by the Medical Research Council (MRC, 2007) show this strip to be either low or intermediate risk while the Makathini Flats to the west are high risk due to the presence of the Pongolo floodplain and irrigation schemes.
Habitat requirements of schistosome-;transmitting snails
The habitat requirements of Bulinus africanus, B. globosus and Biomphalaria pfeifferi in South Africa have been fairly well-;studied over the past few decades (for example Appleton, 1975; Appleton et al., 1995). Many of the findings from these studies have been confirmed through analysis of the data held in the National Freshwater Snail Collection (NFSC) (De Kock and Wolmarans, 2005) and have recently been summarised by Quayle and Appleton (2008). Consequently, unless indicated otherwise, the information presented below and in Table 3 is from this work. It should be noted that, whilst both B. africanus and B. globosus are the intermediate hosts for S. haematobium, on examination of the nearly 3 000 samples in the NFSC, De Kock and Wolmarans (2005) found that only roughly 500 samples could be identified as definitely belonging to the first species and 800 to the latter species. The majority of the samples were considered to be from an intermediate population. For that reason the habitat preferences of the B. africanus/globosus group as a whole were identified by De Kock and Wolmarans (2005) and are presented as such in Table 3.
It can be seen from Table 3 that the habitat preferences of all the snail hosts are similar, in that they prefer a permanently-;inundated aquatic habitat, with slow flowing, or standing water. Bulinus africanus and B. globosus can tolerate some degree of desiccation; however, Biomphalaria pfeifferi is sensitive to drying out. Consequently, these snail species, and in particular B. pfeifferi, are usually found in permanent water bodies. According to Appleton and Stiles (1976) the major environmental factors that influence the distribution of host snails are temperature and current velocity but habitat stability is probably a more accurate parameter. Using records housed in the NFSC, Gear et al. (1980) and De Kock and Wolmarans (2005) showed that B. africanus was distributed from the northern Limpopo Province, Mpumalanga Province and KwaZulu-;Natal Province, and down the coastal parts of the Eastern Cape as far as Humansdorp (Kromme River). Bulinus globosus, on the other hand, has a more limited distribution and is found only in the warmer, north-;eastern parts of the country southwards to Lake Nhlabane in northern KwaZulu-;Natal. While all 3 snail species are tolerant of water with a wide range of chemical conditions (Appleton, 1978), B. africanus, and perhaps other species as well, are able to survive sudden and severe changes in dissolved salt content (Heeg, 1975). The possession of haemoglobin as their respiratory pigment allows them to survive in water with low oxygen concentrations, but where extensive coverage of the surface by floating plants causes the water to become anoxic, or nearly so, they cannot survive (Donnelly and Appleton, 1985) and this can interrupt the transmission of schistosomiasis.
Potential effects of wetland degradation, rehabilitation, and construction, on invertebrate disease hosts
The potential abiotic and biotic changes brought about by wetland degradation or, conversely, rehabilitation, have been discussed above. These changes will now be examined in the light of possible effects on the IDHs of malaria and schistosomiasis, with particular reference to the habitat required by the aquatic life stages. Since these diseases are prevalent only in some parts of South Africa, predominantly in the north-;eastern corner of the country and the eastern coastal plain, it is particularly in these areas that activities potentially leading to an increase in IDH-;suitable habitat are of concern.
Alteration in the extent of inundated area
Upsurges in schistosomiasis and malaria in local communities following the modification of aquatic ecosystems and construction of water resource development projects have been well-;documented (Chitsulo et al., 2000; Zimmerman, 2001; Millennium Ecosystem Assessment, 2005). An increase in the extent of inundated area, either of an existing natural wetland, or by creation of a new artificial system, is likely to lead to an increase in mosquito populations, particularly if other environmental parameters (e.g. flow, water quality) are favourable. Draining and in-;filling of wetlands is a time-;honoured method used for controlling mosquito populations. It has led to elimination of the disease, and the enabling of settlement, in many regions of the world, including Italy (Millennium Ecosystem Assessment, 2005) and Louisiana in the USA (Willott, 2004), but was accompanied by an inevitable loss of valuable wetland services. Because of the ability of An. arabiensis (and An. gambiae s.s.) to breed in very small isolated pools during the rainy season, if infilling or draining leads to the formation of such habitats the density of the vectors may increase. The provision of permanent water bodies for the insects to over-;winter as larvae would also enhance vector populations.
In the case of the snail hosts involved in transmission of schistosomiasis, these are all obligate freshwater species and draining of wetlands would be expected to eradicate them. But would an increase in inundated area automatically lead to an increase in host snails, and therefore to an increase in prevalence of schistosomiasis in the area? Wolmarans et al. (2005) showed that prediction of schistosomiasis infection levels simply by looking at snail density and habitat availability was speculative. Frequent contact between infected people and the shistosome-;infested water resource is necessary to initiate and maintain transmission. Nevertheless, there is a well-;documented link between water resource development and enhanced burdens of schistosomiasis in nearby communities (Boelee and Laamrani, 2004; WHO and UNICEF, 2006; Millennium Ecosystem Assessment, 2005). Pretorius et al. (1989) and Ofoezie (2002) investigated the occurrence of snail intermediate hosts of schistosomiasis in South African and Nigerian dams respectively. They concluded that unless urgent steps were taken, the adverse health consequences of dams could be greater than their socio-;economic benefits. If environmental conditions are favourable, and if populations of snails are present upstream, then they will colonise the new habitat. The salient point is, however, that in order for the schistosome parasite to complete its life-;cycle and proliferate, it is necessary for eggs in the urine or faeces of infected humans to enter the water resource. Free-;swimming cercariae which emerge from their snail hosts penetrate the skin of people whilst bathing or washing (Davies and Day, 1998), but swimming is the water contact activity most likely to result in transmission since it involves exposure of large areas of the body for long periods of time (Kvalsvig and Schutte, 1986). Good sanitation and the availability of safe, alternative swimming facilities can be very effective measures for reducing schistosomiasis levels (Appleton et al., 1995). In the case of artificial wetlands created to treat effluent or stormwater, it may be possible to exclude people from these areas. A point worth emphasizing is that it is possible to reduce schistosomiasis transmission simply by manipulating human behaviour, but that it is a lot more difficult to do so with malaria.
Alteration in the extent of saturated areas
Some activities in wetlands (either impacts or remedial measures) may lead to an increase in the areal extent of soil saturation, rather than of inundation. The snail hosts of schistosomes are unlikely to increase in numbers under these conditions but An. arabiensis, with its propensity for breeding in tiny pools, may well do so. An illustration of this is the localised malaria outbreak in Mamfene on the Makathini Flats, north-;east KwaZulu-;Natal, in 1987, which was traced to An. arabiensis breeding in the hoofprints of cattle attracted by poorly-;managed overflow water from nearby cotton fields and rice paddies (Appleton et al., 1995). Furthermore, other IDHs (Table 1) are likely to have very different habitat requirements from those considered here. For instance several species of Aedes mosquitoes that are implicated in diseases such as dengue, yellow fever and West Nile virus lay their eggs on wet mud (Dale and Knight, 2008). Although these diseases (with the possible exception of isolated cases of West Nile virus) do not currently occur in South Africa, global climate change is likely to significantly alter the distribution patterns of organisms throughout the world (Russell, 1998; Poff et al., 2002). Thus activities that lead to incomplete draining of wetland soils may result in the removal of habitat for some IDHs, but create potential habitat for others.
Altering flow pattern
As noted by Kotze et al. (2008b), one of the major activities of wetland rehabilitation is to reinstate diffuse flow. This increases the retention time of water within the wetland and enhances several key wetland functions such as amelioration of water quality and retention of flood-;flows. Table 3 shows that An. arabiensis, An. gambiae and An. funestus all breed in standing water, which facilitates larval respiration and prevents the larvae from being washed away. The snail hosts of schistosomiasis, Bulinus africanus, B. globosus and Biomphalaria pfeifferi also prefer standing or slow-;flowing water, and cannot tolerate water velocities greater than 0.3m/s (Appleton et al., 1995). Thus, there is a potential risk of increasing IDH densities under decreased flow conditions. Other factors may also come into play, however, depending on site-;specific conditions. For example if the number of predators is also enhanced by reduced flow this could off-;set the effects of increased numbers of IDHs resulting from more favourable environmental conditions.
Secondary effects of altered hydraulic conditions
Altering hydraulic habitat can in turn give rise to secondary effects such as changes in water quality. Aquatic plants and animals may respond directly to altered hydraulic conditions, or indirectly to altered water quality (Malan and Day, 2002). For example, alteration of water depth is likely to change the extent of emergent macrophyte beds. Manipulation of macrophytes, both emergent and floating, has been used in artificial wetlands to minimise mosquitoes and snails (see later). Changing water depth (and flow rate) may also alter water quality in a wetland. Reduced depth and flow rates are likely to result in decreased turbidity, as well as increased temperatures in summer and decreased temperatures in winter. Anopheles arabiensis is well adapted to high temperatures, since it preferentially breeds in small water bodies in summer (Le Sueur and Sharp, 1988). The snail hosts of human schistosomes have specific requirements in terms of water quality: for instance, Thomas and Tait (1984) and Donnelly and Appleton (1985) noted that they avoid anoxic habitats, a common condition in permanently-;inundated zones of wetlands (Malan and Day, 2005). These organisms also respond to temperature which, as noted previously, is a major driver in their distribution (Appleton, 1978). The B. africanus group and Biomphalaria pfeiferri are found in areas where the mean annual air temperature ranges from 15ºC to 25ºC. There is convincing evidence that the reproductive rates of snails such as Bulinus globosus and Biomphalaria pfeifferi are reduced when the temperature is above 27ºC and 25ºC respectively (Shiff and Husting, 1966). Appleton (2006) showed how such high temperatures have determined the distribution of B. pfeifferi, and hence S. mansoni as well, in north-;eastern KwaZulu-;Natal. Thus, changes in temperature resulting from alterations in hydraulic conditions may well influence snail distribution.
Changes in water quality
The influence of some aspects of water quality on IDHs has already been discussed. As noted in Table 3, the anopheline mosquitoes in general seem to prefer fresh, clean water for breeding. This does not mean, however, that maintaining polluted water would necessarily obviate the mosquito problem. Firstly, there is a threat that some Anopheles populations are adapting to polluted urban water sources. Secondly, there is the risk of an explosion in populations of mosquitoes such as Culex quinquefasciatus which breed in polluted water and, whilst not vectoring serious diseases, except in certain circumstances hepatitis B (Fouché et al., 1990), are very much a nuisance factor.
Changes in vegetation
The effect of vegetation on IDHs is complex. According to Mwangangi et al. (2008), emergent vegetation is known to have a deleterious effect on some mosquito species by obstructing gravid females about to oviposit, and by supporting a greater diversity of aquatic predators. For other species, vegetation can be beneficial, providing protection for their larvae from predators. For example, in Mexico, removal of algal mats from rivers and irrigation canals has led to an effective reduction in malaria by reducing larval habitat (Pepall, 2003). In South Africa, An. funestus is known to prefer to lay eggs in permanent aquatic habitats that are shaded and have emergent vegetation (Table 3). An. arabiensis prefers unvegetated pools during the summer but it overwinters amongst emergent vegetation in permanent water bodies. Thus, increasing the amount of emergent vegetation in a wetland (as may well happen if flow is made more diffuse) is likely to encourage these disease vectors, especially in semi-;arid areas where temporary habitats dry out during winter.
Pulmonate snails, including those responsible for schistosomiasis, also prefer habitats with emergent vegetation (Thomas and Daldorph, 1991; Boelee and Laamrani, 2004) although this is not always straight-;forward. Floating macrophytes such as Salvinia were found to decrease snail numbers in irrigation canals since their dense growth eliminated submerged macrophytes (although Salvinia mats increased snail numbers in Lake Kariba after it filled). Thomas and Daldorph (1991), working in Nigeria, and Boelee and Laamrani (2004) in Morocco, proposed using dense mats of Salvinia, Pistia or Azolla in water bodies in order to control problem snail populations. While Salvinia and Pistia are native to the northern parts of Africa, they and some subspecies of Azolla are highly invasive in South Africa and so their use in this regard would be problematic.
As noted previously, physico-;chemical impacts and biotic responses are inter-;related, and changing 1 parameter can have implications for others. For example, the clearing of papyrus from swamps in south-;western Uganda (accompanied by some in-;filling and cultivation) has resulted in an increased risk of malaria transmission in a region previously at low risk (Lindblade et al., 2000). It is of interest to note here that degradation of a natural wetland has led to an increase in the mosquito problem. This was a consequence of the fact that removal of the natural wetland vegetation led to increased minimum and maximum temperatures, and more favourable mosquito larval habitat. In the rice paddies on the Makathini Flats of north-;eastern KwaZulu-;Natal the temperature regime was buffered more and more as the rice plants grew and shading of the water increased (Appleton, 2006). In this way a thermally inhospitable habitat was rendered hospitable for snails potentially carrying schistosomiasis.
Biomanipulation and wetland management
A fairly extensive body of literature exists on the concept of environmental manipulation or modification for the control of mosquitoes (Ault, 1994; Russell, 1999; Keiser et al., 2005; Walker and Lynch, 2007) and schistosome-;carrying snails (Thomas and Tait, 1984; Thomas and Daldorph, 1991). Environmental manipulation has been advocated because it is usually less destructive to the environment than using larvicides or molluscicides and, in the case of malaria, avoids the increasing problem of insecticide-;resistant vectors. Environmental manipulation methods require a good understanding of the ecology of the pest species and site-;specific conditions in order to be effective, however (Russell, 1999; Keiser et al., 2005). In certain scenarios control of schistosomiasis snail hosts has been achieved through removal of vegetation (Boelee and Laamrani, 2004; Thomas and Tait, 1984) but this is not generally recommended. Closer to home, in the 1980s the Durban Municipality used the manual clearing of emergent vegetation from streams within its jurisdiction to control nuisance mosquitoes and at the same time kept snaiI numbers (all species) low for long periods (Gruneberg, 1999). This practice has been discontinued. Recently, Culler and Lamp (2009) advocated the conservation and use of indigenous invertebrate predators such as dytiscid beetles for the control of mosquito larvae in constructed wetlands.
Manipulation of flow has been investigated for control of both snails and mosquitoes (Walker and Lynch, 2007). This aspect is currently being reviewed elsewhere with special reference to rivers (Quayle and Appleton, 2008) and is therefore not repeated here. Instead the focus is on the general characteristics of wetlands that promote mosquito proliferation. This is because, whilst only a limited area of the country is prone to malaria, mosquitoes are a nuisance factor, in terms of biting humans and livestock, country-;wide. Furthermore, Walker and Lynch (2007) noted that the popularity and public acceptance of malaria control programmes was limited if only disease vectors were considered rather than if attempts were made to control all nuisance mosquito species. This aspect also needs to be considered when undertaking wetland rehabilitation efforts or constructing artificial wetlands.
Knight et al. (2003) list more than 15 papers giving technical information on how to manage mosquitoes in municipal wastewaters, although such approaches have also been applied to natural wetlands. Papers (e.g. Walton, 2003) and popular articles (e.g. IDNR, 2008) are also available that give general approaches to minimising mosquito abundance. These approaches are discussed below in order to stimulate research in this field. It should be emphasised that critical investigations are required into the applicability of these approaches to the conditions and the pest species found in South Africa. Note that the approaches discussed here apply to freshwater wetlands. Several pest species of mosquito use salt marshes and mud flats as breeding habitat and management techniques for these species (although not specific to South Africa) are discussed in Dale (2007).
The following general characteristics have been found to promote mosquito production in wetlands:
- Shallow water with dense vegetation (Russell, 1999; Knight et al., 2003)
- Areas of standing water
- Newly-;flooded habitats with no predators (Russell, 1993 cited in Russell, 1999), especially if located in arid areas (Knight et al., 2003; Karpiscak et al., 2004; Tirados et al., 2006)
- Polluted water, since high levels of organic matter can provide nutrients for the bacteria and algae used as food by mosquito larvae (Walton, 2003); predators may be killed due to poor quality water, and mosquito populations may re-;establish themselves faster than other faunal components (Russell, 1999). (This aspect is not directly applicable to anophelines, since they usually prefer clean water).
The following general characteristics have been found to reduce mosquito production in wetlands:
- Open water subjected to wind and wave action, which inhibits larval respiration (Russell, 1999; Walton, 2003)
- Deeper habitats (> 0.6 m) with steep sides that do not support emergent vegetation but do provide habitat for predators, including invertebrates and fish (Service, 1993); the ponds should have a simple shape and low perimeter-;to-;area ratio; Thullen et al. (2002) suggest controlling excessive plant growth by building small hummocks/islands for emergent vegetation surrounded by deeper water. For a diagram of constructed wetlands in the USA that are designed to minimise mosquitoes, see Walton (2003).
- Subsurface flow, rather than surface water (Russell, 1999)
- Variation in water level can be disruptive to some mosquito species as the larvae can become stranded and desiccated. Constructed wetlands should be designed to have this facility (Russell, 1999). This approach is usually not feasible for natural wetlands, since the aquatic phase of An. arabiensis can be as short as 11 days in summer (Maharaj, 2003).
- Water movement, or generating areas of turbulence in constructed wetlands, for example, by pumping or mechanical aeration (Service, 1993).
- Well-;established, more permanently-;flooded habitats with established and diverse invertebrate and vertebrate faunas tend to produce relatively few individual mosquitoes (Pont, 2004), although they may support a wide range of mosquito species (Russell, 1993 cited in Russell, 1999).
- Strategic manipulation of vegetation, for example, removal of floating vegetation, may reduce numbers of larvae because they are then more exposed to predators and to wind action (Batzer and Resh, 1994); such an effect is highly dependent on the species of mosquito involved.
Other considerations
Russell (1999) points out the need to understand aspects of the ecology of mosquitoes additional to breeding habitat preference in order to assess and understand the risk to human communities near a wetland. These aspects include vector behaviour (do they bite at night or during the day, inside or outside?), the flight range, the preferred blood-;host (human or non-;human?), and the susceptibility of the vector to pathogens. According to Russell (1999), management of mosquitoes is best achieved using an integrated approach designed to make the wetland less suitable for larvae, including manipulation of hydraulic habitat and vegetation, and utilising chemical and biological agents to reduce populations of pest species.
The proximity of human habitation to a wetland is an important consideration in the case of both malaria transmission and schistosomiasis. For afro-;tropical malarial vectors, including An. arabiensis and An. funestus, there appears to be a negative correlation between the number of adult mosquitoes found in houses and the distance from larval breeding sites (Minakawa et al., 2002; Minakawa et al., 2004). On investigating the distribution of mosquitoes in a peri-;urban area outside of Maputo, Mozambique, Mendis et al. (2000) found that further than 350 m away from breeding sites the number of infective bites per person per year declined sharply. The same author cites various references from different parts of Africa and notes an apparent steep gradient in vector potential over distances as short as 250 to 300 m. Thus whilst human habitation should ideally be situated away from wetlands (Pont, 2004), the distances required appear to be relatively short. This situation does need to be verified for South Africa, however.
It was noted earlier that An. arabiensis can breed in many different types of aquatic habitats (this is also true for An. gambiae s.s but An. arabiensis is the more important vector in this country). It is the habitat created by human activity that may be particularly important in terms of malaria transmission – giving rise to the apt term 'man made malaria' coined by Bruce-;Chwatt in 1980. For example, in a recently developed suburban area in the Kenyan highlands, Khaemba et al. (1994 cited in Walker and Lynch, 2007) found temporary pools created through construction activities to be the main breeding sites during the rainy season, whereas permanent dams and, to a lesser extent, natural swamps were important during the dry season. Since this species may breed during the rainy season in pools as small as an inundated hoof-;print, increases in vector density may occur independently of wetlands. Increasing the extent of permanent water bodies is likely to provide additional habitat for over-;wintering larvae, however. Community education programmes to encourage people to eliminate 'backyard breeding sites' in containers holding stagnant water are important (Pont, 2004). Lindsay et al. (2004) advocate the filling in of abandoned ditches, borrow pits, seepage areas and ponds to reduce mosquito habitat. They also suggest excluding people and livestock from proximity to irrigation dams and canals in order to prevent hoof-; and footprints being made. This recommendation is for mosquito control in Asia, but is also likely to be effective in South Africa.
The proximity of human habitation to a wetland is also an important consideration in the transmission of schistosomiasis since Schistosoma requires faeces-; or urine-;polluted water (and a human host) to complete its life-;cycle. The closer a wetland is to human settlements, especially if sanitation is poor, the more likely that the snail hosts in the water will become infected with larval schistosomes. Similar anti-;schistosomiasis measures for wetlands are applicable to those developed for irrigation schemes in the 1970s (Pitchford, 1970; Gear and Pitchford, 1977). Thus, where it is unavoidable that people live near wetlands, they should be provided with anti-;schistosomiasis measures designed to prevent contact with the water – and thus prevent contamination. These can include alternative facilities for washing clothes, swimming, etc., as well as providing simple bridges over streams and fencing contact points, but this will obviously require a safe, piped water supply as well.
Conclusions
The objective of this review was to investigate linkages between wetland degradation, rehabilitation and construction and invertebrate disease hosts, and to evaluate the risk to human communities living nearby. A further objective was to stimulate much needed, multi-;disciplinary research into this field by reviewing the literature and indicating some of the gaps in our knowledge. We conclude that, in the regions of the country where the diseases are prevalent, there is the potential for wetland rehabilitation or construction (and possibly environmental degradation) to inadvertently encourage the IDHs involved in the transmission of malaria and schistosomiasis. Furthermore, the construction of wetlands for ameliorating water quality, or for any other objective, is irresponsible unless possible deleterious effects on the health of surrounding human populations are taken into account. At the same time, wetlands undoubtedly provide a wealth of benefits, many of which are under-;valued or are only recognised once the wetland has been lost. Unfortunately, it would seem that the very characteristics (shallow, slowly-;moving water, dense emergent vegetation) required in a wetland to promote, for example, water quality amelioration are the antithesis of the characteristics required for minimising mosquito populations (Russell, 1999; Walton, 2003). Furthermore, increases in disease vectors are often an unforeseen consequence of degradation of ecosystems and naturally-;functioning, unimpacted wetlands often provide habitat for fewer pest mosquitoes (Ault, 1994). Thus it is essential that both the potential risks and benefits of wetland modification (in the sense of rehabilitation and conversion or destruction) are considered.
In this review, potential risks of wetland modification to human health were examined by linking the environmental conditions required by IDHs with those likely to occur after wetland modification. Such an approach inevitably involves generalisations in terms of habitat requirement and the abiotic and biotic changes likely to arise from different activities in wetlands. Nevertheless, this is considered to be a useful initial assessment to inform further research. General methods have been presented for minimising IDHs (and, in the case of snails, their infection by schistosomes) by limiting suitable habitat. There is an urgent need for these (and any other techniques that may be identified) to be tested in the South African context. Furthermore, relationships between environmental parameters and individual IDH species are likely to be highly site-;specific and detailed case studies are required. The initial research focus should be on the IDHs involved in the transmission of malaria and schistosomiasis. Links between wetlands and the less well-;studied diseases (e.g. fascioliasis and arbovirus infections) in humans and stock animals then need to be explored. For instance, whether or not there is any risk of Fasiola infection in people harvesting and eating the fruits of the water chestnut Trapa natans on the Pongolo floodplain, and the breeding biology of the wetland culicine mosquitoes that transmit arboviruses. Examples of arboviruses that are pathogenic to people and/or domestic stock are Rift Valley fever transmitted by Culex theileri and West Nile virus transmitted by C. univittatus (Jupp, 2005). Similarly the biology of the biting midges (Ceratopogonidae), which are widely distributed in South Africa and which are responsible for the transmission of blue tongue disease in sheep and African horse sickness, is poorly known (Picker, 2008). The larvae of many species of biting midge develop in water bodies, and yet virtually nothing is known about the larval habits of the South African species of this group. Both diseases have important economic implications. Finally, the mosquito Mansonia uniformis, which is particularly common in the Richards Bay area (Appleton and Sharp, 1985), is well known as a nuisance species and is probably the most bloodthirsty mosquito in Africa. Its biology is important since the larvae obtain their oxygen from the tissues of submerged plants. This makes them more difficult to control (and find) than those which use atmospheric oxygen.
In the case of malaria in South Africa, it has been claimed that there is too much reliance on interior spraying of houses with DDT (Wells and Leonard, 2006). The use of DDT for malaria control in South Africa was terminated in 1996 but reintroduced on a limited scale in 2000 (Attaran and Maharaj, 2000). Little DDT is being sprayed today and this use is temporary, in accordance with an agreement between the Ministry of Health and WHO (Liroff, 2000). This is both to minimise the impacts of insecticides, including DDT, on the environment and to avoid the very serious problem of increasing resistance of mosquitoes to insecticides (Hargreaves et al., 2000; Hargreaves et al., 2003; Gericke et al., 2003; Mouatcho et al., 2009). Methods of environmental control to minimise IDHs should be encouraged (Ramsar, 2008b) and a focused research programme carried out to support this approach. Attaran and Maharaj (2000) drew attention to the fact that what is called 'integrated vector management' has so far enjoyed little practical support in South Africa and remains experimental. This needs to change.
At the same time there has been a marked lack of communication between resource development engineers, health officials and freshwater ecologists (Ramsar, 2008b), which has led in some cases to unacceptable social burdens of schistosomiasis resulting from water resource development (Davies and Day, 1998; Ofoezie, 2002). Lessons have been painfully learnt, but it is vital that these lessons be remembered and implemented in each wetland intervention that takes place in this country. Ault (1994) stresses the need for social scientists to be involved in integrated vector control strategies and Dale and Knight (2008) call for better communication between wetland managers and those involved in managing mosquitoes. We support that call (indeed attention to this need was noted by one of these authors (Appleton, 1983) as far back as the earlier 1980s).
Thus, assessment of the potential risks and benefits of a proposed wetland modification needs to be undertaken in a holistic manner using an adaptive framework that recognises the critical need to balance health, both human and environmental (Dale and Knight, 2008). The adaptive framework should be site-;specific, multidisciplinary and take into account the variability: of the habitat requirements of the IDHs, of the presence of disease in human populations and of the ecological functioning of wetlands. It is essential that the full range of social, ecological and hydrological benefits and costs of wetlands are considered, rather than focusing on any one in isolation from the others. There will frequently be trade-;offs in maximising one beneficial ecosystem service or minimising a social cost of a particular wetland, and these all need to be taken into account in decision-;making processes. For example, while draining wetlands or leaving them in degraded condition might initially appear to be the easiest solution to localised public health threats posed by IDHs, the loss of beneficial ecosystem services provided by these wetlands, such as water purification, flood control, or provision of food and fibre, and their contributions to human health and well-;being, also need to be considered. This aspect was emphasised by the 2008 Conference of the Contracting Parties to the Ramsar Convention on Wetlands, which called upon countries to 'ensure that any disease eradication measures in or around wetlands are undertaken in ways that do not unnecessarily jeopardise the maintenance of the ecological character of the wetlands and their ecosystem services' (Ramsar, 2008b). Whilst wetlands can be associated with an increased incidence of globally significant and locally important infectious diseases (such as malaria and schistosomiasis), the removal of wetlands or alteration of their water regimes is not the only disease management option that should be considered. The incidence of many of these diseases can instead be reduced through provision of clean water, improved sanitation, and – importantly – good management of wetlands. In order to assess the potential risks and benefits holistically a multi-;disciplinary approach will be required engaging entomologists, health care officials, wetland scientists, sociologists and economists. Whilst this approach is likely to increase the complexity and cost of wetland rehabilitation or construction in the short-;term, this is likely to be far outweighed by the long-;term savings in public-;health costs and the economic benefits provided by wetlands.
Acknowledgements
This study falls under Phase II of the National Wetlands Research programme. The authors would like to thank the Water Research Commission for funding this study. Especial thanks to Leo Quayle and Chris Dickens (Institute of Natural Resources) for letting us make use of their unpublished work.
References
APPLETON CC (1975) The influence of stream geology on the distribution of the bilharzia host snails, Biomphalaria pfeifferi and Bulinus (Physopsis) sp. Ann. Trop. Med. Parasitol. 69 241-;255. [ Links ]
APPLETON CC (1978) Review of literature on abiotic factors influencing the distribution and life cycles of Bilharzia's intermediate host snails. Malacol. Rev. 11 1-;25. [ Links ]
APPLETON CC (1983) Wetlands and public health. J. Limnol. Soc. S. Afr. 9 117-;122. [ Links ]
APPLETON CC (2006) Do rice paddies provide a route for the introduction of intestinal schistosomiasis into north-;eastern KwaZulu-;Natal, South Africa? In: Madsen H and Appleton CC (eds.) Proc. Workshop on African Freshwater Malacology. 9-;12 September 2003, Kampala, Uganda, DBL Institute for Health Research & Development. 79-;104. [ Links ]
APPLETON CC and SHARP BL (1985) A preliminary study on the emergence of Mansonia uniformis (Diptera: Culicidae) from swamps at Richards Bay, Natal, South Africa. J. Entomol. Soc. S. Afr. 48 179-;184. [ Links ]
APPLETON CC, SHARP BL and LE SUEUR D (1995) Wetlands and water-;related parasitic diseases of man in Southern Africa. In: Cowan GI (ed.) Wetlands of South Africa. Department of Environmental Affairs and Tourism, Pretoria, South Africa. 227-;246. [ Links ]
APPLETON CC and STILES G (1976) Geology and geomorphology in relation to the distribution of snail intermediate hosts of bilharzia in South Africa. Ann. Trop. Med. Parasitol. 70 189-;198. [ Links ]
ATTARAN A and MAHARAJ R (2000) DDT for malaria control should not be banned. Br. Med. J. 321 1403-;1404. [ Links ]
AWOLOLA TS, ODUOLA AO, OBANSA JB, CHUKWURAR NJ and UNYIMADU JP (2007) Anopheles gambiae s.s. breeding in polluted water bodies in urban Lagos, southwestern Nigeria. J. Vector Dis. 44 241-;244. [ Links ]
AULT SK (1994) Environmental management: a re-;emerging vector control strategy. Am. J. Trop. Med. Hyg. 50 35-;49. [ Links ]
BATZER DP and RESH VH (1994) Wetland management strategies, waterfowl habitat management, and mosquito control. In: Mitsch WJ (ed.) Global Wetlands: Old World and New. Elsevier Science, The Netherlands. 825-;832. [ Links ]
BLABER SJM, HAY DG, CYRUS DP and MARTIN TJ (1984) The ecology of two degraded estuaries on the north coast of Natal, South Africa. S. Afr. J. Zool. 19 224-;240. [ Links ]
BOELEE E and LAAMRANI H (2004) Environmental control of schistosomiasis through community participation in a Moroccan oasis. Trop. Med. Int. Health 9 (9) 997-;1004. [ Links ]
BROWN DS (1966) On certain morphological features of Bulinus africanus and B. globosus (Mollusca: Pulmonata) and the distribution of these species in south-;eastern Africa. Ann. Natal Mus. 18 401-;415. [ Links ]
BROWN DS (1994) Freshwater Snails of Africa and their Medical Importance. Taylor and Francis, London, UK. 609 pp. [ Links ]
BRUCE-;CHWATT L (1980) Essential Malariology. William Heinemann Medical Books, London, UK. 354 pp. [ Links ]
CDC (2007) Yellow fever fact sheet. Department of Health and Human Services, Centers for Disease Control and Prevention. URL: www.cdc.gov/ncidod/dvbid/yellowfever/YF_FactSheet.html (Accessed January 2009). [ Links ]
CDC (2008a) Paragonimiasis. Department of Health and Human Services, Centers for Disease Control and Prevention. Available from: www.dpd.cdc.gov/dpdx/HTML/paragonimiasis (Accessed January 2009). [ Links ]
CDC (2008b) Dengue fever fact sheet. Department of Health and Human Services, Centers for Disease Control and Prevention. URL: www.cdc.gov/ncidod/dvbid/dengue (Accessed January 2009). [ Links ]
CHITSULO L, ENGELS D, MONTRESOR A and SAVIOLI A (2000) The global status of schistosomiasis and its control. Acta Trop. 77 41-;51. [ Links ]
COOPPAN RM, NAIDOO K and ISHWARLALL J (1987) Renal function in urinary schistosomiasis in the Natal province of South Africa. Am. J. Trop. Med. Hyg. 37 556-;561. [ Links ]
CULLER LE and LAMP WO (2009) Selective predation by larval Agabus (Coleoptera: Dytiscidae) on mosquitoes: support for conservation-;based mosquito suppression in constructed wetlands. Freshwater Biol. 54 2003-;2014. [ Links ]
DALE PER (2007) Assessing impacts of habitat modification on a subtropical salt marsh: 20 years of monitoring. Wetlands Ecol. Manage. 16 (1) 77-;87. [ Links ]
DALE PER and KNIGHT JM (2008) Wetlands and mosquitoes: a review. Wetlands Ecol. Manage. 16 (4) 255-;276. [ Links ]
DAVIES B and DAY J (1998) Vanishing Waters. University of Cape Town Press, Cape Town, South Africa. 487 pp. [ Links ]
DEAT (2006) South Africa Environment Outlook: A report on the State of the Environment. Department of Environmental Affairs and Tourism, Pretoria, South Africa. 371 pp. [ Links ]
DE KOCK KN and WOLMARANS CT (2005) Distribution and habitats of the Bulinus africanus species group, snail intermediate hosts of Schistosoma haematobium and S. mattheei in South Africa. Water SA 31 (1) 117-;125. [ Links ]
DOH (2008) The prevalence and distribution of malaria in South Africa. Statistical Notes, March 2008, Department of Health. URL: http://www.doh.gov.za/docs/stats_malaria-;f.html (Accessed January 2009). [ Links ]
DONNELLY FA and APPLETON CC (1985) Observations on the field transmission dynamics of Schistosoma mansoni and S. mattheei in southern Natal, South Africa. Parasitol. 91 281-;290. [ Links ]
DUFFIELD R and HILL B (2002) Swamp management guidelines for the Fleurieu Peninsula. Conservation Council of South Australia, Adelaide. URL: www.wetlandcare.com.au (Accessed August 2007). [ Links ]
DUGAN PJ (1990) Wetland Conservation: A Review of Current Issues and Required Action. IUCN, Gland, Switzerland. [ Links ]
DURRHEIM DN, GOVERE JM, BRAACK LEO, GERICKE, J and SPEARE R (2001) Malahlapanga -; exploiting nature's bounty for malaria control. In: Canyon DV and Speare RS (eds.) Rural and Remote Environmental Health. The Australasian College of Tropical Medicine, Townsville. URL: http://www.tropmed.org/rreh/vol1_12.htm (Accessed October 2008). [ Links ]
FOUCHÉ A, CREWE RM, WINDSOR IM and KARIM SS (1990) Persistence of hepatitis B antigen in Culex quinquefasciatus (Diptera: Culicidae). J. Med. Entomol. 27 697-;700. [ Links ]
GEAR JHS and PITCHFORD RJ (1977) Bilharzia in South Africa. Department of Health, Pretoria. 36 pp. [ Links ]
GEAR JHS, PITCHFORD RJ and VAN EEDEN JA (1980) Atlas of Bilharzia in South Africa. Joint publication of the South African Institute for Medical Research, South African Medical Research Council and Department of Health. Johannesburg. [ Links ]
GERICKE A, GOVERE JM and DURRHEIM DN (2003) Insecticide susceptibility in the South African malaria mosquito Anopheles arabiensis (Diptera: Culicidae). S. Afr. J. Sci. 98 205-;208. [ Links ]
GILLIES MT and DE MEILLON B (1968) The Anophelinae of Africa south of the Sahara. Pub. S. Afr. Inst. Med. Res. 54 1-;343. [ Links ]
GIMNIG JE, OMBOK M, KAMAU L and HAWLEY WA (2001) Characteristics of larval Anopheline (Diptera: Culicidae) habitats in Western Kenya. J. Med. Entomol. 38 (2) 282-;288. [ Links ]
GRUNEBERG JA (1999) Environmental management for snail control: a perspective from the City of Durban. Presentation to the Parasite Control Task Group, Durban City Council, March 1999. 6 pp. [ Links ]
HAMER ML and APPLETON CC (1991) Physical and chemical characteristics and phyllopod fauna of temporary pools in north-;eastern Natal, Republic of South Africa. Hydrobiol. 212 95-;104. [ Links ]
HARGREAVES K, HUNT RH, BROOKE BD, MTHEMBU J, WEETO MM, AWOLOLA TS and COETZEE M (2003) Anopheles arabiensis and An. quadriannulatus resistance to DDT in South Africa. Med. Vet. Entomol. 17 417-;422. [ Links ]
HARGREAVES K, KOEKEMOER LL, BROOKE BD, HUNT RH, MTHEMBU J and COETZEE M. (2000) Anopheles funestus resistant to pyrethroid insecticides in South Africa. Med. Vet. Entomol. 14 181-;189. [ Links ]
HEEG J (1975) A note on the effects of drastic changes in total dissolved solids on the aquatic snail Bulinus (Physopsis) africanus Krauss. J. Limnol. Soc. S. Afr. 1 29-;32. [ Links ]
IDNR (INDIANA DEPARTMENT OF NATURAL RESOURCES, USA) (2008) Indiana Wetlands Conservation Plan. Did you know ... healthy wetlands devour mosquitoes? Indiana Department of National Resources. URL: http://www.nae.usace.army.mil/reg/mosquitoes.pdf (Accessed December 2008). [ Links ]
IMPOINVIL DE, KEATING J, MBOGO CM, POTTS MD, CHOWDHURY RR and BEIER JC (2008) Abundance of immature Anopheles and culicines (Diptera: Culicidae) in different water body types in the urban environment of Malindi, Kenya. J. Vector Ecol. 33 (1) 107-;116. [ Links ]
JOUBERT PH, PRETORIUS SJ, DE KOCK KN and VAN EEDEN JA (1984) The effect of constant low temperatures on the survival of Bulinus africanus (Krauss), Bulinus globosus (Morelet) and Biomphalaria pfeifferi (Krauss). S. Afr. J. Zool. 19 314-;316. [ Links ]
JOUBERT PH, PRETORIUS SJ, DE KOCK KN and VAN EEDEN JA (1986) Survival of Bulinus africanus (Krauss), Bulinus globosus (Morelet) and Biomphalaria pfeifferi (Krauss) at constant high temperatures. S. Afr. J. Zool. 21 85-;88. [ Links ]
JUPP PG (2005) Mosquitoes as vectors of human disease in South Africa. S. Afr. Fam. Pract. 47 (9) 68-;72. [ Links ]
KADLEC RH and KNIGHT RL (1996) Treatment Wetlands. CRC Lewis Publishers, Boca Raton, Florida, USA, 893 pp. [ Links ]
KARPISCAK MM, KINGSLEY KJ, WASS RD, AMALFI FA, FRIEL J, STEWART AM, TABOR J and ZAUDERER J (2004) Constructed wetland technology and mosquito populations in Arizona. J. Arid Environ. 56 681-;707. [ Links ]
KEATING K, MACINTYRE K, MBOGO C, GITHEKO A, REGENS JL, SWALM C, NDENGA B, STEINBERG LJ, KIBE L, GITHURE JI and BEIER J (2003) A geographic sampling strategy for studying relationships between human activity and malaria vectors in urban Africa. Am. J. Trop. Med. Hyg. 68 (3) 357-;365. [ Links ]
KEISER J, SINGER BH and UTZINGER J (2005) Reducing the burden of malaria in different eco-;epidemiological settings with environmental management: a systematic review. Lancet Infect. Dis. 5 695-;708. [ Links ]
KENGNE ID, BRISSAUD F, AKOA A, ETEME RA, NYA J, NDIKEFOR A and FONKOU T (2003) Mosquito development in a macrophyte-;based wastewater treatment plant in Cameroon (Central Africa). Ecol. Eng. 21 (1) 53-;61. [ Links ]
KHAEMBA BM, MUTANI A and BETT MK (1994) Studies of anopheline mosquitoes transmitting malaria in a newly developed highland urban area: a case study of Moi University and its environs. East Afr. Med. J. 71 (3) 159-;164. [ Links ]
KNIGHT RL, WALTON WE, O'MEARA GF, REISEN WK and WASS R (2003) Strategies for effective mosquito control in constructed treatment wetlands. Ecol. Eng. 21 211-;232. [ Links ]
KOENRAADT CJM, GITHEKO AK and TAKKEN W (2004) The effects of rainfall and evapotranspiration on the temporal dynamics of Anopheles gambiae s.s and Anopheles arabiensis in a Kenyan village. Acta Trop. 90 141-;153. [ Links ]
KOTZE DC, BREEN CM and QUINN N (1995) Wetland losses in South Africa. In: Cowan GI (ed.) Wetlands of South Africa. Department of Environment Affairs and Tourism, Pretoria, South Africa. 263-;272. [ Links ]
KOTZE D, MARNEWECK G, BATCHELOR A, LINDLEY D and COLLINS N (2008a) WET-;Ecoservices: A Technique for Rapidly Assessing Ecosystem Services Supplied by Wetlands. WET-;Management Series. WRC Report No. TT 339/08, Water Research Commission, Pretoria, South Africa. 80 pp. [ Links ]
KOTZE DC, ELLERY WN, ROUNTREE M, GRENFELL MC, MARNEWECK GC, NXELE SI, BREEN C, DINI J, BATCHELOR AL and SIEBEN, E (2008b) WET-;RehabPlan: Guidelines for Planning Wetland Rehabilitation in South Africa. WET-;Management Series. WRC Report No. TT 336/08. Water Research Commission, Pretoria, South Africa. 61 pp. [ Links ]
KVALSVIG JD (2003) Parasites, nutrition, child development and public policy. In: Crompton DWT, Montresor A, Nesheim MC and Savioli L (eds.) Controlling Disease Due to Helminth Infections. World Health Organization, Geneva. 55-;65. [ Links ]
KVALSVIG JD and SCHUTTE CHJ (1986) The role of human water contact patterns in the transmission of schistosomiasis in an informal settlement near a major industrial area. Ann. Trop. Med. Parasitol. 80 13-;26. [ Links ]
LANGONE J (2008) Protecting yourself against malaria is imperative on a trip to southern Africa. Here's what you should know. Third-;World traveller. URL: http://www.thirdworldtraveler.com/Disease/malaria_SouthernAfrica (Accessed August 2008). [ Links ]
LE SUEUR D (1993) Personal communication. Medical Research Council, Durban, South Africa. [ Links ]
LE SUEUR D and SHARP BL (1988) The breeding requirements of three members of the Anopheles gambiae Giles complex (Diptera: Culicidae) in the endemic malaria area of Natal, South Africa. Bull. Entomol. Res. 78 549-;560. [ Links ]
LINDBLADE KA, WALKER ED, ONAPA AW, KATUNGU J AND WILSON M (2000) Land use change alters malaria transmission parameters by modifying temperature in a highland area of Uganda. Trop. Med. Int. Health 5 (4) 263-;274. [ Links ]
LINDSAY SW, PARSON L and THOMAS CJ (1998) Mapping the ranges and relative abundance of the two principal African malaria vectors, Anopheles gambiae sensu stricto and An. arabiensis, using climate data. Proc. R. Soc. Lond., Ser. B: Biol. Sci. 265 847-;854. [ Links ]
LINDSAY S, KIRBY M, BARIS E and BOS R (2004) Environmental management for malaria control in East Asia and Pacific region. The World Bank health, nutrition and population (HNP) discussion paper. Washington DC 20433, USA. 46 pp. [ Links ]
LIROFF R (2000) Reduction and elimination of DDT should proceed slowly. Br. Med. J. 321 1404-;1405. [ Links ]
MAHARAJ R (2003) Life table characteristics of Anopheles arabiensis (Diptera: Culicidae) under simulated seasonal conditions. J. Med. Entomol. 40 (6) 737-;742. [ Links ]
MAHARAJ R, MTHEMBU DJ and SHARP BL (2005) Impact of DDT re-;introduction on malaria transmission in KwaZulu-;Natal. S. Afr. Med. J. 95 871-;874. [ Links ]
MALAN HL and DAY JA (2002) Linking Discharge, Water Quality and Biotic Response in Rivers: A Literature Review. WRC Report No. 956/2/02, Water Research Commission, Pretoria, South Africa. pp. 132. [ Links ]
MALAN HL and DAY JA (2005) Wetland Water Quality and The Ecological Reserve. WRC Report No. 1311/1/05. Water Research Commission, Pretoria, South Africa. pp. 214. [ Links ]
MALTBY E, HOGAN DV, IMMIRZI CP, TELLAM JH and VAN DER PEIJL MJ (1994) Building a new approach to the investigation and assessment of wetland ecosystem functioning. In: Mitsch WJ (ed.) Global Wetlands, Old World and New. Elsevier Press, The Netherlands. pp. 637-;658. [ Links ]
MATTHEWS S and BRAND K (2004) Africa Invaded: The Growing Danger of Invasive Alien Species. Global Invasive Species Programme, Cape Town, 79 pp. [ Links ]
MCINTOSH BM, RUSSELL D, DOS SANTOS E and GEAR JL (1980) Rift Valley fever in humans in South Africa. S. Afr. Med. J. 58 803-;806. [ Links ]
MENDIS C, JACOBSEN JL, GAMAGE-;MENDIS A, BULLE E, DGEDGE M, THOMPSON R, CUAMBA N, BARRETO J, BEGTRUP K, SINDEN RE and HOGH B (2000) Anopheles arabiensis and An. funestus are equally important vectors of malaria in Matola coastal suburb of Maputo, southern Mozambique. Med. Vet. Entomol. 14 171-;180. [ Links ]
MILLENNIUM ECOSYSTEM ASSESSMENT (2005) Ecosystems and Human Well-;being: Synthesis. Island Press, Washington DC. 137 pp. [ Links ]
MILLER JR, HUANG J, VULULE J and WALKER ED (2007) Life on the edge: African malaria mosquito (Anopheles gambiae s.l.) larvae are amphibious. Naturwissenschaften 94 (3) 195-;199. [ Links ]
MINAKAWA N, SEDA P and YAN G (2002) Influence of host and larval habitat distribution on the abundance of African malaria vectors in Western Kenya. Am. J. Trop. Med. Hyg. 67 (1) 32-;38. [ Links ]
MINAKAWA N, SONYE G, MOGI M AND YAN G (2004) Habitat characteristics of Anopheles gambiae s.s. larvae in a Kenyan highland. Med. Vet. Entomol. 18 301-;305. [ Links ]
MOODLEY I, KLEINSCHMIDT I, SHARP B, CRAIG M and APPLETON C (2003) Temperature-;suitability maps for schistosomiasis in South Africa. Ann. Trop. Med. Parasitol. 97 617-;627. [ Links ]
MOUATCHO JC, MUNHENGA G, HARGREAVES K, BROOKE BD, COETZEE M and KOEKEMOER LL (2009) Pyrethroid resistance in a major African malaria vector Anopheles arabiensis from Mamfene, northern KwaZulu-;Natal, South Africa. S. Afr. J. Sci. 105 127-;131. [ Links ]
MRC (2007) Malaria in Southern Africa. Malaria Research Programme, Medical Research Council, South Africa. URL: www.malaria.org.za (Accessed July 2009). [ Links ]
MUTERO CM, BLANK H, KONRADSEN F and VAN DER HOEK W (2000) Water management for controlling the breeding of Anopheles mosquitoes in rice irrigation schemes in Kenya. Acta Trop. 76 253-;263. [ Links ]
MUTERO CM, NG'ANG'A PN, WEKOYELA P, GITHURE J and KONRADSEN F (2004). Ammonium sulphate fertiliser increases larval populations of Anopheles arabiensis and culicine mosquitoes in rice fields. Acta Trop. 89 187-;192. [ Links ]
MWANGANGI JM, MUTURI EJ, SHILILU J, MURIU JS, JACOB B, KABIRU EW, MBOGO CM, GITHURE J and NOVAK R (2008) Contribution of different aquatic habitats to adult Anopheles arabiensis and Culex quinquefasciatus (Diptera: Culicidae) production in a rice agroecosystem in Mwea, Kenya. J. Vector Ecol. 33 (1) 129-;138. [ Links ]
OFOEZIE IE (2002) Human health and sustainable water resources development in Nigeria: Schistosomiasis in artificial lakes. Nat. Resour. Forum, UN 26 (2) 150-;160. [ Links ]
PEPALL J (2003) Case study – health, an ecosystem approach: Malaria and agriculture in Kenya – a new perspective on the links between health and ecosystems. Ecosystem Approaches to Human Health Program Initiative, International Development Research Centre, Canada. URL: www.idrc.ca/ecohealth (Accessed July 2008). [ Links ]
PICKER M (2008) Personal communication, 3 July 2008. Department of Zoology, University of Cape Town, Cape Town, South Africa. [ Links ]
PITCHFORD RJ. (1970) Control of bilharziasis by rural management. Central Afr. J. Med. 16 31-;33. [ Links ]
POFF NL, BRINSON MM and DAY JW (2002) Aquatic Ecosystems and Global Climate Change: Potential Impacts on Inland Freshwater and Coastal Wetland Ecosystems in the United States. Prepared for the Pew Center on Global Climate Change. [ Links ]
PONT D (2004) Mosquitoes and wetlands on the NSW North Coast. Short discussion paper by a wetland designer. URL: http://www.ecotechgroup.com/downloads/Mosquitos%20and%20Wetlands.doc (Accessed January 2008). [ Links ]
PRETORIUS SJ, JOUBERT PH and DE KOCK KN (1989) A review of the schistosomiasis risk in South African dams. Water SA 15 133-;136. [ Links ]
QUAYLE LM and APPLETON CC (2008) The effects of stream flow manipulation on the intermediate hosts and vector populations of disease and the transmission of the associated parasites. 31 March 2008. Final report presented to the Steering Committee for WRC Project No. K5/1589 on 11 June 2008. [ Links ]
RAMSAR (1971) Convention on wetlands of international importance especially as waterfowl habitat. UN Treaty Series No. 14583. [ Links ]
RAMSAR (2008a) Healthy wetlands, healthy people – a review of wetlands and human health interactions. URL: http://www.ramsar.org/cop10/cop10_doc28_e.pdf (Accessed July 2009). [ Links ]
RAMSAR (2008b) Resolution X.23. Wetlands and human health and well-;being. 10th Meeting of the Conference of the Parties to the Convention on Wetlands (Ramsar, Iran 1971). URL: http://www.ramsar.org/res/key_res_x_23_e.pdf (Accessed July 2009). [ Links ]
RAPPOLE JH, DERRICKSON SR and HUBÁLEK Z (2000) Migratory birds and spread of West Nile Virus in the Western Hemisphere. Emerging Infect. Dis. 6 (4) 319-;328. [ Links ]
RUSSELL RC (1993) Mosquitoes and Mosquito-;borne Disease in Southeastern Australia. (Revised edn). Department of Medical Entomology, Westmead Hospital, Westmead, Australia. 320 pp. [ Links ]
RUSSELL RC (1998) Mosquito-;borne arboviruses in Australia: the current scene and implications of climate change for human health. Int. J. Parasitol. 28 955-;969. [ Links ]
RUSSELL RC (1999) Constructed wetlands and mosquitoes: health hazards and management options – an Australian perspective. Ecol. Eng. 12 107-;124. [ Links ]
SERVICE MW (1993) Mosquito Ecology: Field Sampling Methods (2nd edn.) Elsevier, New York. 988 pp. [ Links ]
SERVICE MW and TOWNSEND H (2002) The Anopheles vector. In: Warrell DA and Gilles HM (eds.) Essential Malariology (4th edn.). Arnold Publishers, U.K. pp. 85-;106. [ Links ]
SHEARER H (1997) Rennies Wetland Project: Western Cape region – Stage 1. Prepared for Wildlife and Environment Society, Western Cape, PO Box 90145, Tokai. [ Links ]
SHIFF CJ (1964) Studies on Bulinus (Physopsis) globosus in Rhodesia. I. The influence of temperature on the intrinsic rate of natural increase. Ann.Trop. Med. Parasitol. 58 94-;105. [ Links ]
SHIFF CJ and GARNETT B (1967) The influence of temperature on the intrinsic rate of natural increase of the freshwater snail Biomphalaria pfeifferi (Krauss). Arch. Hydrobiol. 62 429-;438. [ Links ]
SHIFF CJ and HUSTING EL (1966) An application of the concept of intrinsic rate of natural increase to studies on the ecology of freshwater snails of the genera Biomphalaria and Bulinus (Physopsis) in southern Africa. Proc. Trans. Rhodesian Sci. Assoc. 51 1-;8. [ Links ]
SWANEPOEL R and KEMP A (2005) Personal communication. National Institute for Communicable Diseases, Johannesburg, South Africa. [ Links ]
TANSER FC, SHARP B and LE SUEUR D (2003) Potential effect of climate change on malaria transmission in Africa. Lancet 362 1792-;1798. [ Links ]
THOMAS JD and DALDORPH PWG (1991) Evaluation of bioengineering approaches aimed at controlling pulmonate snails: the effects of light attenuation and mechanical removal of macrophytes. J. Appl. Ecol. 28 (2) 532-;546. [ Links ]
THOMAS JD and TAIT AI (1984) Control of the snail hosts of schistosomiasis by environmental manipulation: a field and laboratory appraisal in the Ibadan area, Nigeria. Philos. Trans. R. Soc. Lond., Ser. B: Biol. Sci. 305 (1123) 201-;253. [ Links ]
THULLEN JS, SARTORIS JJ and WALTON WE (2002) Effects of vegetation management in constructed wetland treatment cells on water quality and mosquito production. Ecol. Eng. 18 441-;457. [ Links ]
TIRADOS I, CONSTANTINI C, GIBSON G and TORR SJ (2006) Blood-;feeding behaviour of the malarial mosquito Anopheles arabiensis: implications for vector control. Med. Vet. Entomol. 20 425-;437. [ Links ]
TREN R and BATE R (2004) South Africa's war against malaria: lessons for the developing world. Policy Analysis No. 513. Cato Institute, Washington DC [ Links ]
WALKER K and LYNCH M (2007) Contributions of Anopheles larval control to malaria suppression in tropical Africa: review of achievements and potential. Med. Vet. Entomol. 21 2-;21. [ Links ]
WALTON WE (2003) Managing mosquitoes in surface-;flow constructed treatment wetlands. Division of Agriculture and Natural Resources, University of California, Publication 8117. URL: http://anrcatalog.ucdavis.edu (Accessed July 2008). [ Links ]
WANER S (1999) Health risks of travellers in South Africa. J. Travel Med. 6 199-;203. [ Links ]
WELLS M and LEONARD L (2006) DDT contamination in South Africa. The International POPs Elimination Project (IPEP): fostering active and effective civil society participation in preparations for implementation of the Stockholm Convention. Prepared by Groundwork, Pietermaritzburg, South Africa. URL: www.Ipen.org (Accessed July 2008). [ Links ]
WHO (2001) Yellow fever factsheet. URL: http://www.who.int/mediacentre/factsheets/fs100/en/ (Accessed Jan 2009). [ Links ]
WHO (2002) Prevention and Control of Schistosomiasis and Soil-;transmitted Helminthiasis, Report of a WHO Expert Committee. WHO Technical Report Series 912, Geneva. [ Links ]
WHO (2007) Rift Valley Fever factsheet. URL: http://www.who.int/mediacentre/factsheets/fs207/en/ (Accessed September 2008). [ Links ]
WHO (2008a) Dengue and dengue haemorrhagic fever factsheet. URL: http://www.who.int/mediacentre/factsheets/fs117/en/ (Accessed September 2008). [ Links ]
WHO (2008b) Chikungunya factsheet. URL: http://www.who.int/mediacentre/factsheets/fs117/en/ (Accessed January 2009). [ Links ]
WHO and UNICEF (2003) Africa malaria report. World Health Organisation/UNICEF, Geneva, Switzerland. 43 pp. URL: http://www.who.int/malaria/amd2003/ amr2003 (Accessed July 2008). [ Links ]
WHO and UNICEF (2006) Chapter 6: Protecting and Promoting Human Health. In: Water: a shared responsibility. The United Nations World Water Development Report 2. 202-;240. [ Links ]
WILLOTT E (2004) Restoring nature, without mosquitoes? Restor. Ecol. 12 (2) 147-;153. [ Links ]
WOLMARANS CT, BREMOND P and DE KOCK KN (2005) The occurrence and distribution of schistosome intermediate hosts in relation to the prevalence of schistosome infections in humans in a highly endemic area in the Limpopo Province, South Africa. S. Afr. J. Epidemiol. Infect. 20 (1) 18-;22. [ Links ]
WOLMARANS CT, DE KOCK KN, POTGIETER A and POSTMA S (2006) Occurrence of urinary schistosomiasis in the greater Rustenburg area, North West province, an area not typical for endemic bilharzia. S. Afr. J. Sci. 102 246-; 249. [ Links ]
ZIMMERMAN R (2001) Wetlands and infectious diseases. Cad. Saúde Pública, Rio de Janeiro 17 (Supplemento) 127-;131. [ Links ]
Received 6 February 2009; accepted in revised form 25 August 2009.
* To whom all correspondence should be addressed.
+2721 650 3872; fax: +2721 650 3301;
e-;mail: heather.malan@uct.ac.za
Comparison of GRACE with in situ hydrological measurement data shows storage depletion in Hai River basin, Northern China
Juana Paul MoiwoI; Yonghui YangI, *; Huilong LiI; Shumin HanI; Yukun HuI, II
IKey Laboratory for Agricultural Water Resources, Agricultural Resources Research Centre, Institute of Genetics and Developmental Biology, Chinese Academy of Sciences, 286 Huaizhong Road, Shijiazhuang 050021, China
IIHebei Provincial Academy of Water Resources, 310 Taihua Road, Shijiazhuang 050051, China
ABSTRACT
Water storage change has implications not only for the hydrological cycle, but also for sustainable water resource management in especially semi-arid river basins. Satellite/remote sensing techniques have gained increasing application in monitoring basin and regional hydrological processes in recent decades. In this study, the latest version of GRACE (Gravity Recovery and Climate Experiment) is used to estimate total water storage change in the Hai River basin (HRB) of Northern China for the period January 2003 to December 2006. Time-series comparisons show a good agreement between the estimated storage change from the GRACE satellite data and in situ hydrological measurement data at especially the seasonal cycle with R = 0.82 and RMSE = 17.25 mm. The good agreement suggests that GRACE detects storage change in the 318 866 km2 HRB study area. It also implies that the in situ hydrological measurements of soil moisture and groundwater sufficiently characterise storage change in the semi-arid river basin. Change in soil moisture storage is less than that in saturated storage, suggesting that storage depletion in the basin is mainly in the saturated zone. Both the GRACE and hydrological measurement data indicate storage loss in the range of 12.72 to 23.76 mm/yr – a phenomenon that has been detected in previous studies in the basin. GRACE hydrology data could therefore be handy in monitoring storage dynamics and water availability in the study area. As GRACE data are available for virtually every region of the world, their application in conjunction with hydrological models could improve hydrological studies. This may lead not only to water balance closures, but also to sustainable water resource management at basin to regional scale.
Keywords: Hai River basin, GRACE, saturated storage, soil moisture storage, hydrological measurement data, total water storage change
Introduction
Water shortage on North China Plain (NCP), the largest wheat/maize production zone in China, is a limiting factor to socio-economic development in the region (Guobin et al., 2004; Yang et al., 2006). Per-capita water availability on the plain is amongst the lowest globally (Nakayama et al., 2006). Since the founding of the People's Republic of China in 1949, flow has dropped to insignificant levels in almost all the rivers on the plain due largely to repeated dam construction for hydroelectric power generation, and urban/industrial water supply (Brown et al., 2005). Hence agriculture, the main stay of the larger rural population, relies heavily on groundwater irrigation to ensure sufficient food production for the staggering population. Agricultural irrigation has induced severe groundwater drawdown in the region, which is occurring at an estimated rate of 1.5 to 2.0 m/yr. It is feared that water shortage on the plain would develop into a major social crisis if sustainable countermeasures are not implemented in time (Fei, 1998; Brown et al., 2005; Yang et al., 2006; Blanke et al., 2007).
Before the satellite age, monitoring of storage availability and exploitation relied largely on piezometric data and ad hoc model simulations. Such measures were often limited by elaborate input requirements and parameterisation, data inconsistency and complicated data formatting, spatial and temporal data gaps, and instrumental and human oversights (Rodell et al., 2007). In recent decades, however, more direct and efficient methods have been developed to monitor storage dynamics and availability in especially (semi)-arid river basins. One such method is GRACE (Gravity Recovery and Climate Experiment).
GRACE has been proven reliable, and it offers a great potential for water storage closure on basin to regional scale (Swenson et al., 2006; Yeh et al., 2006). GRACE data are available for virtually all river basins and can be inverted for water storage change in the thin layer of the earth (Brunner et al., 2006; Swenson et al., 2006) with unprecedented accuracy (Tapley et al., 2005; Flamsteed, 2007). GRACE is promising because no global network exists of hydrological observations with temporal and spatial resolutions necessary to characterise storage on regional to continental scale (Swenson et al., 2006; Klees et al., 2006; Chen et al., 2007).
GRACE mission was jointly launched by NASA (National Aeronautics and Space Administration) and DLR (Zentrum für Luft-und Raumfahrt) in March 2002. The mission was due to expire in April 2007, but has been approved to continue through early 2010 (Rodell et al., 2007). GRACE consists of 2 satellites (trailing each other at a distance of ≈220 km) in identical earth orbits. The satellite-to-satellite separation distance is monitored by highly sensitive onboard microwaves as they move over gravity highs and lows (at an initial altitude of 485 km).
Gravity fields are generally influenced by non-gravitational forces, glacier isostatic adjustments, mass transports in the atmosphere and oceans, and redistribution of water, snow and ice on the land surface. Hence after corrections for the non-gravitational forces, GRACE gravity field solutions reflect water storage change on the earth's surface. This includes storage change in groundwater, soil moisture, and in surface water bodies like rivers, lakes and snow/ice packs (Klees et al., 2006). GRACE data, after de-striping for the so-called north-south trending errors, can be applied at a spatial resolution of ≈200 000 km2 (Yeh et al., 2006). A spatial resolution of this magnitude is commensurate with most river basins for which in situ hydrological measurements are available (Swenson et al., 2006).
Previous studies have shown that groundwater and root-zone soil moisture storage do not only exhibit significant variability, but also adequately reflect total storage change in river basins at monthly to seasonal scale (e.g. Eltahir and Yeh, 1999; Seneviratne et al., 2004; Syed et al., 2005; Garcia et al., 2006; Hinderer et al., 2006; Swenson et al., 2006; Rodell et al., 2007; Rietbroek, 2007). In this paper therefore, GRACE and the combined hydrological measurement data of soil moisture and groundwater were used to analyze total water storage change in the 318 866 km2 Hai River basin (HRB). We spatially averaged and compared the GRACE data with the hydrological measurement data and showed that GRACE detects storage loss in the semi-arid HRB study area.
Data and method
Location and hydrology of the study area
Hai River basin is one of the most important grain-production regions in Northern China. Lying between 35.01 and 42.72 ºN and 111.95 and 119.84 ºE (Fig. 1), it has an area of ≈318 866 km2 and a population of 112 m. (Wu et al., 2008). In the basin, land surface elevation is higher than 2 832 m in the Taihang Mountains and below 5 m in the littorals of the Sea of Bohai. As nearly all the rivers in the basin are repeatedly dammed, river flow is severely limited. The climate is typically semi-arid with cold winters and hot summers. In the basin, precipitation is uneven both in space and time and with an annual average of ≈550 mm/yr. Over 70% of the precipitation falls in the summer months of June, July and August (Yang et al., 2006). Designations like commercial, industrial, residential and urban land-use form a small, but vital part of the landscape. However, agriculture is the largest land-use type accounting for over 90% of the arable lands. Over 69% of the cultivated lands are under a continuous wheat-maize rotation cropping system (Yang et al., 2002; Yang and Tian, 2009).
In the study area, groundwater is predominantly a bicarbonate type (Fei, 1998). Hydrogeologically, quaternary-aged aquifers of inter-fingering gravel, sand and silt deposits extend to a depth of 400 m below surface alluvial fans (Zhu et al., 1995; Chen et al., 2007). While the potential for groundwater storage is highest in the plains, significant recharge largely occurs in the gravelly piedmont regions (Yang et al., 2002; Nakayama et al., 2006). Land productivity has been enhanced since the early 1950s due to extensive water conservancies, afforestation, soil improvement measures and farmland development. To further facilitate agricultural production, thousands of tube-wells and pumping stations have been developed. While this has enhanced land productivity, it has at the same time led to drastic groundwater drawdown and the development of widespread groundwater depression cones in the basin (Brown et al., 2005; Xu and Cai, 2005; Yang et al., 2006).
GRACE data acquisition and processing
GRACE data release-04 (RL04) spanning from January 2003 to December 2006 was used in the study. This set of data constitutes a significant improvement over earlier releases because of improvements in the background processing models (Chambers, 2007; Kusche et al., 2008). The GRACE data used in this study were obtained from http://geoid.colorado.edu/grace/grace.php – developed by Sean Swenson under the auspices of NASA Research, Education and Applications Solution Network (NASA-REASON). The site provides online interfaces for a series of GRACE data analysis. GRACE gravity data, when filtered or de-stripped for the so-called correlated north-south trending errors can be applied at a spatial resolution of ≈200 000 km2, which is commensurate with the ≈318 866 km2 study area. De-stripped GRACE data are widely used in the estimation of terrestrial water storage change (e.g. Swenson et al., 2006; Rodell et al., 2007; Slobbe et al., 2009).
In this study, GRACE monthly water storage anomalies were computed at a Gaussian half-width of 200 km. This smoothing radius sufficiently constrained the data on the 318 866 km2 study area. To minimise the effect of geographical truncation on the analysis, a maximum of 1º was maintained around the basin (see also Mayer-Guerr et al., 2007). The monthly storage anomalies (which are regularly spaced 1º x 1º point data) were projected to WGS 1984 UTM Zone 51N coordinate system. The projected data were then interpolated at a grid-cell size of 1 000 m x 1 000 m via the IDW (inverse distance weighted) interpolation method on GIS platform. The basin-averaged monthly storage anomaly was afterwards derived from the raster maps after re-truncation to the study area. This processing technique was necessary because the spatial extent of HRB defined in our study (see Fig. 1) is essentially different from that on the GRACE website – where the basin definitions are based on TRIP (Total Runoff Integrating Pathways; see Oki and Sud (1998)). Furthermore, this technique supports sufficient spatial display of the water storage components.
Uncertainty and bias estimates of GRACE data are beyond the scope of this paper. However, this aspect of the data is well reported in several other studies, especially those concerning GRACE hydrological applications (e.g., Klees et al., 2006; also visit http://grace.jpl.nasa.gov/publications/ for related studies). Furthermore, the increasing and wide application of GRACE data in hydrological studies is, in itself, a good manifestation of the degree of accuracy and reliability associated with this source of data.
Hydrological measurement data acquisition and processing
The hydrological measurement data used in this study basically comprise of in situ soil moisture and groundwater measurement data. Data from a total of 129 soil moisture and 87 water table measurement stations (see Fig. 1) were collected for January 2003 to December 2006.
The water table data were obtained from the Hydrological and Water Resources Bureau of Hebei Province, and consisted of 2 water-table measurements per month (the 6th and 26th of each month). Only monitoring wells in the unconfined aquifer and with reasonable distance from production wells were considered for the groundwater measurement data. Additional hydrogeological data including specific yield were obtained from Geological Memoirs (1992). Because the confined and phreatic aquifer systems are hydraulically interconnected via outcrops, the data were considered representative of saturated storage in the basin.
The soil moisture data, on the other hand, were obtained from the Meteorological Bureau of Hebei Province. The bureau maintains measurements of soil moisture at every 10 cm depth for the first 50 cm soil depth. The data consist of gravimetric soil moisture measurements taken on the 8th, 18th and 28th of each month. The data were converted into equivalent soil moisture via the bulk density factor.
Because the hydrological measurement data are spatially not evenly distributed, they were analyzed for temporal stability. The concept of temporal stability was introduced by Vachaud et al. (1985) and defines the time-invariant association between spatial locations and classical statistical parametric values of given properties. Temporal stability analysis reduces the number of measurements needed to establish the general behaviour of a data set by identifying those locations that are representative of a given area with regard to that data property (Martínez-Fernández and Ceballos, 2003). The relative difference parametric test (Vachaud et al., 1985) was used to determine temporal consistency among the measurement sites. In relative difference parametric tests, time-stable locations are those locations with minimal deviation from the mean relative difference (Martínez-Fernández and Ceballos, 2003). For the purpose of this study, all measurement sites with standard mean relative difference deviation above the average mean (5.20 mm for the soil moisture and 5.07 m for the water table data) were considered outliers and were therefore rejected. Based on the analysis and the selection criteria, data from 77 stations (out of 129 soil- moisture measurement stations) and 65 wells (out of 87 water-table monitoring wells) were eventually used. The results of the temporal stability analysis are plotted in Fig. 2.
The statistically tested data (for both the soil moisture and groundwater) were then projected on the same coordinate system as that for the GRACE data and interpolated in more or less the same way at a grid-cell size of 1 000 m x 1 000 m. As most of the basin is under wheat/maize (shallow-rooted crops with root penetration hardly exceeding 50 cm) rotational cultivation system, soil moisture storage in the 50 to 200 cm soil depth should be fairly stable (Han et al., 2008). Hence storage change in the top 50 cm soil depth was assumed to be representative of unsaturated storage change in the study area (Yang et al., 2006). To also convert change in water-table depth into saturated storage change, the well data were multiplied by the basin-averaged specific yield – taken as 0.066 (see Geological Memoirs, 1992).
Auxiliary data
Auxiliary data in this study refer to the set of data not directly factored into the water balance model, but are used to explain the behaviour of water storage change in the basin study area. The set of auxiliary data used for the above purpose includes precipitation, evapotranspiration, irrigation and temperature data. The temperature and precipitation data were collected from 67 meteorological stations that are relatively evenly distributed over the study area – see Wu et al. (2008) for the location of the meteorological stations in the HRB study area. The stations are owned and operated by China National Meteorological Bureau (CNMB) and are equipped with automatic data-loggers. Those of irrigation and evapotranspiration were collected at the Luancheng Comprehensive Agricultural Eco-systems Experimental Station (LCAEES). The station is owned and run by the Chinese Academy of Sciences (CAS). LCAEES (located at latitude 37º53' N and longitude 114º41' E) maintains a large weighing lysimeter for measuring evapotranspiration on well-irrigated maize/wheat fields. Over 69% of the basin is under irrigated wheat/maize rotation farming (Yang et al., 2002; Yang and Tian, 2009) hence the lysimeter data should be representative of the study area.
Hai River basin water balance model
In Hai River basin, over 80% of the plains are under wheat and maize crops (both of which are shallow-rooted and heavily irrigated crops). In the plains therefore, significant soil moisture variation is limited mainly to the first 50 cm root-zone (Yang et al., 2006). Storage in the intermediate zone (which is unusually thick due to drastic groundwater drawdown) is relatively stable (Han et al., 2008). Furthermore, surface water is highly limited in the basin due to repeated damming for hydroelectric power generation, and urban and industrial water supply (Yang and Tian, 2009). Hence the most important sources of storage change in the basin are soil moisture and groundwater. In the terrestrial-based water balance approach, these sources of storage change are equated to GRACE total water storage change (Swenson et al., 2006; Yeh et al., 2006; Rodell et al., 2006) as:

where:
TWSC is total water storage change
SMSC is storage change in soil moisture
GWSC is storage change in groundwater
The term on the left-hand side of Eq. (1) was derived from GRACE data whereas those on the right-hand side were computed from in situ hydrological measurements of soil moisture and groundwater. The terms on the opposite sides of the equation should be commensurate and therefore comparable.
Results and discussion
Groundwater depth and total water storage anomaly
Figure 3 (top plate) depicts the dynamics of the basin-averaged monthly and seasonal groundwater depth anomaly plotted from the monitoring well data. Also depicted on Fig. 3 (bottom plate) is the basin-averaged monthly and seasonal total water storage anomaly plotted from GRACE data. The time-series plots do not only have striking similarities in especially the seasonal phases, but also indicate storage loss in the basin. Storage loss is readily noticeable from the slopes of the linear trend lines. The slopes further suggest that the magnitude of change in groundwater depth is higher than that in the GRACE-derived total water storage anomaly. The trend of change in especially the groundwater depth data suggests that storage change in the basin is predominantly in saturated storage.
As shown in the next sections, storage change obtained from the combined groundwater and soil moisture storage is commensurate with the GRACE-derived total water storage change. It then implies that saturated storage loss in the basin is somewhat counter-balanced by storage gain in especially root-zone soil moisture. This is because agricultural irrigation, which is almost exclusively dependent on groundwater pumping, augments root-zone soil moisture storage in the wheat-maize rotational cultivation system (also see Tong et al., 2009).
The seasonal curves in Fig. 3 show storage loss in spring (March to May) and storage gain in autumn (September to November). Wheat irrigation is the main cause of saturated storage loss in spring (Yang et al., 2006). Autumn is usually the harvest season, and a relatively high rainfall in the preceding summer (June to August) augments storage in the autumn season (see also Nakayama et al., 2006; Han et al., 2008).
Monthly storage change
Figure 4 (top plate) is a time-series of monthly storage change in soil moisture and in groundwater in the study area. In the middle plate of Fig. 4 is a comparison of the GRACE-derived total water storage change with storage change computed from the combined hydrological measurement data of soil moisture and groundwater. Groundwater storage is apparently high during the precipitation months of June to August. However, this is not always the case as saturated storage in the basin is also very much influenced by irrigation. Although irrigation is a form of internal water redistribution, its influence on the basin storage is very evident in the relatively minimal change in soil moisture storage on the one hand (bottom plate, Fig. 4), and the large aquifer head loss on the other (top plate, Fig. 3). Generally, however, soil moisture storage is influenced by several other factors including precipitation, irrigation, evapotranspiration, temperature, or even crop growth stage. Therefore its spatial and temporal dynamics and distribution are unusually complex. Irrespective of its complexity, minimal soil moisture storage change in the basin can largely be attributed to groundwater irrigation – the main drive of saturated storage loss in the basin (Figs. 4, 5 and 6). Furthermore, low temperatures in the cold and low-precipitation months of December to February limit evapotranspiration, thereby reducing soil moisture loss.
Table 1 details the statistical trends of the water storage components quantified in Eq. (1). At the monthly scale, soil moisture is insignificantly correlated with both total water storage (R = 0.15, RMSE = 36.49 mm) and groundwater storage (R = 0.08, RMSE = 35.84 mm). This is because farmland irrigation (which augments soil moisture storage) is predominantly from groundwater storage, which is the primary source of total water storage change in the basin. Thus in the basin study area, soil moisture storage tends to be inversely related with the water balance components of groundwater and total water storage. Though generally weak, the GRACE-derived total water storage change has the strongest correlation with groundwater storage change (R = 0.61, RMSE = 27.81 mm). Irrespective of the weak correlations, the amplitudes (and more so the phases) of the water balance components have considerable similarities. This is particularly so for the GRACE-derived total water storage change and storage change obtained from the combined hydrological measurement data (Fig. 4). Storage is generally high for the high-precipitation months of June to August (summer season) and low for the low-precipitation months of December to February (winter season). For the basin study area, average annual storage depletion (in terms of equivalent water thickness) is -12.72 mm/yr for the GRACE data, -23.76 mm/yr for the groundwater data, and -13.44 mm/yr for the combined hydrological measurements of soil moisture and groundwater. Based on the analysis, there is a storage increase of 10.32 mm/yr in soil moisture. In contrast, however, there is a storage loss in groundwater. Taking the basin-averaged specific yield as 0.066 (Geological Memoirs, 1992), an equivalent of 360 mm thickness of saturated storage is depleted per year. If we further assume that all storage loss in the basin comes from saturated storage, then the GRACE-estimated storage loss is an equivalent of 192.93 mm/yr of saturated storage thickness. By adjusting for the loss in saturated storage with the gain in root-zone soil moisture storage and again using the average specific yield of 0.066, the GRACE estimate is commensurate with that of the combined hydrological measurement data (which is the equivalent of 203.64 mm/yr of saturated storage thickness).
Despite the good similarities, however, some discrepancies exist at the monthly cycle. Hence the data were aggregated and compared at the seasonal scale. The results for the seasonal analysis are presented and discussed in the next sections.
Seasonal storage change
Averaging from lower to higher scale reduces data error as extrema and outliers are filtered out from the data (Wu et al., 2002). Hence at the seasonal cycle (Fig. 5, top plate), stronger correlations exist among the water balance components, except for soil moisture (see Table 1). For soil moisture, the lower correlation at the seasonal scale is due to its increasing inverse tendency with the other water balance components. Hence the SEE (standard error of the estimate) and RMSE are a better correlation measure for soil moisture at the seasonal scale (Table 1). In fact in the basin, saturated storage (but more so unsaturated storage) is influenced by both irrigation and precipitation (Yang et al., 2006; Han et al., 2008), which are in turn driven by temperature and evapotranspiration. Also because of the unusually thick unsaturated zone, groundwater recovery is mainly driven by lateral underflow from the neighbouring aquifer systems (Nakayama et al., 2006; Han et al., 2008). Although both the saturated and root-zone soil moisture storages are high in summer and low in winter, the amplitudes and phases are not so distinct for the root-zone soil moisture storage (Fig. 5, top plate). Change in soil moisture storage is particularly moderated by groundwater irrigation in especially spring, low temperature and evapotranspiration in winter, and high precipitation in summer (see bottom plate, Fig. 5). It could therefore be stated that saturated storage is by far the most important source of storage change in the study area.

The middle plate in Fig. 5 is a comparison between the GRACE-derived total water storage change and storage change computed from the combined hydrological measurement data of soil moisture and groundwater. Over the seasonal cycle, the agreements are much stronger in amplitudes and phases (see Table 1 and Fig. 5). Generally, the highest and lowest amplitudes are in summer and spring respectively. The amplitudes are highest for 2003 (the year with the highest annual precipitation; 605.37 mm) and lowest for 2006 (the year with the lowest annual precipitation; 446.62 mm) for the period 2003 to 2006. The stronger correlation (between the GRACE-derived total water storage and that from the hydrological measurement data) verifies that GRACE detects storage change in the basin study area. It also shows that storage change in the basin is sufficiently characterised by change in root-zone soil moisture storage and in groundwater storage.
Despite the good agreements, however, some discrepancies remain in the seasonal cycles. The discrepancies can be ascribed to a range of factors including differences in sensitivity and uncertainties in the hydrological data. For instance, while GRACE data are sensitive to virtually all sources of storage change, the hydrological measurement data are largely sensitive to changes in soil moisture storage and in groundwater storage. Differences in the time and frequency of sampling of the data sets constitute another source of discrepancy, e.g., whereas 3 soil moisture measurements are made per month, only 2 groundwater measurements are taken per month. Differences in spatial resolutions (1º x 1º for the GRACE data, whereas they are not only sparse, but also uneven for the soil moisture and groundwater measurement data) are further reasons for the discrepancies. Instrumentation and processing errors (especially in the soil moisture measurement) induce additional limits on the agreements among the data sets (Swenson et al., 2006). Geographical truncation of GRACE data (Mayer-Guerr et al., 2007) and sparse ground-based measurements (Swenson et al., 2006) are other sources of discrepancy. But as these uncertainties are generally assumed to be uncorrelated (Wahr and Molenaar, 1998), they should have a negligible effect on the results of the spatial averaging. Furthermore, temporal analysis of the hydrological measurement data should stabilise this set of data and are therefore representative of the study area.
Spatial trends of the water storage components
Figure 6 depicts the annual averages (2003 to 2006) of the water storage components of precipitation, soil moisture, groundwater and GRACE-derived total water storage anomaly for the HRB study area. Precipitation, the most significant hydrological input in the basin, is highest in the south (938.51 mm/yr) and lowest in the north-west (363.20 mm/yr). From the central floodplains down to the eastern coastal regions of Bohai Sea (where excessive groundwater irrigation occurs across the vast expanse of farmlands), precipitation is relatively moderate. The pattern of the hydrological input (mainly precipitation, but also the internal water redistribution of farm irrigation) and storage loss (mainly evapotranspiration), is more or less reflected in the overall storage pattern detected by GRACE. Based on GRACE data, the central plains are the worst storage-depletion zones in the basin. The storage pattern further suggests that GRACE responds more to regional storage change (also see Tapley et al., 2005; Swenson et al., 2006), hence GRACE data application in hydrological studies is for now limited to a minimum of ≈200 000 km2 (Yeh et al., 2006).
For the soil moisture and groundwater storage, the plots on Fig. 6 shows a form of general relation between the 2 data sets (also see Table 1). While the water-table depth is highest in the central plain regions (indicating high saturated storage loss), soil moisture storage is highest for the same zones (indicating soil moisture augmentation mainly via groundwater irrigation). It then suggests that storage depletion in the basin and the larger Northern China is generally driven by farmland irrigation. In fact several other studies have identified agricultural irrigation as the principal driving factor of storage loss in the region (Brown et al., 2005; Kendy et al., 2006; Nakayama et al., 2006; Yang et al., 2006).
Conclusion
In this paper, total water storage change in Hai River basin was successfully estimated for the period January 2003 to December 2006 using GRACE and in situ hydrological measurement data. Total water storage derived from GRACE data was compared with that computed from in situ hydrological measurement data of soil moisture and groundwater. There are good agreements between the GRACE and hydrological measurement data estimates of water storage change in the basin at especially the seasonal cycle. The favourable agreements imply that GRACE detects storage change in the 318 866 km2 HRB of Northern China. It also suggests that the hydrological measurement data of soil moisture and groundwater sufficiently characterise storage change in the basin study area.
Monthly and seasonal time-series of both the measured water-table depth and GRACE-derived water storage anomaly indicate storage loss in the basin. In the study area, storage loss is mainly driven by irrigation of the vast expanse of farmlands. Groundwater exploitation is therefore the main factor driving storage loss in the basin. Soil moisture storage change is the combined effect of precipitation, irrigation and evapotranspiration. As such, change in soil moisture storage is relatively minimal (0.86 mm/month), compared with that in saturated storage (-1.98 mm/month; see Table 1). Therefore, efforts at water management and utilisation in the basin should focus largely on limiting evapotranspiration – the highest storage depleter in the study area (Kendy et al., 2004; Yang et al., 2002; Nakayama et al., 2006).
As storage depletion is an increasingly limiting factor to socio-economic development and crop production, GRACE data could be handy in monitoring not only the dynamics but also the availability of storage in the basin, the larger Northern China, and other regions with similar hydro-climatic conditions. Furthermore, hydrological models generally do not account for all basin storage components or are limited by elaborate input requirements and data pre-processing (Yeh et al., 2006). GRACE data could therefore provide a critical constraint on hydrological models for the accurate estimation of storage change and other hydrological processes in river basins or hydrologic regions.
It should, however, be noted that though GRACE takes into account virtually all sources of storage change, it performs relatively poorly at lower temporal and spatial scales (Tapley et al., 2005; Swenson et al., 2006). Furthermore, spatial smoothing of GRACE data for applications at smaller spatial scales induces a significant bias in GRACE estimates of mean monthly storage amplitudes (Klees et al., 2006). This makes bias corrections with a priori data almost inevitable in GRACE data applications. Despite the limitations, however, the potential of GRACE data in hydrological studies is huge. This is because unlike in situ hydrological measurements, GRACE data cover virtually every region of the world. Hence the combination of GRACE storage estimates with in situ hydrological measurement data allows not only the closing of basin/regional water balance, but the verification and improvement of hydrological models. This could culminate into more accurate modelling of land and atmospheric hydrological processes.
Acknowledgements
This study was funded by Innovation Project No. KZCX1-YW-08-03-04, International Collaborative Project of the Ministry of Science and Technology (2009DFA21690), and the Hundred Talent Program of Chinese Academy of Sciences. Hydro-meteorological data were provided by the Hydrogeological and Meteorological Bureaus of Hebei Province. GRACE data were obtained from http://geoid.colorado.edu/grace/grace.php – which site is maintained by the University of Colorado at Texas, USA.
References
BLANKE A, ROZELLE S, LOHMAR B, WANG J and HUANG J (2007) Water saving technology and saving water in China. Agric. Water Manage. 87 139-150. [ Links ]
BROWN AE, ZHANG L, MCMAHON TA, WESTERN AW and VERTESSY RA (2005) A Review of paired catchment studies for determining changes in water yield resulting from alterations in vegetation. J. Hydrol. 310 28-61. [ Links ]
BRUNNER P, FRANSSEN H-JH, KGOTLHANG L, BAUER-GOTTWEIN P and KINZELBACH W (2006) How can remote sensing contribute in groundwater modeling? Hydrogeol. J. 15 5-18. [ Links ]
CHAMBERS DP (2007) Evaluation of new GRACE time-variable gravity data over the ocean. Geophys. Res. Lett. 34 (14) 14402-1−14402-5. [ Links ]
CHEN Y, DEL-GENIO AD and CHEN J (2007) The tropical atmospheric El Niño signal in satellite precipitation data and a global climate model. J. Clim. 20 3580-3601. DOI:10.1175/JCLI4208.1. [ Links ]
FEI J (1998) Groundwater Resources in the North China Plain. Environ. Geol. & Water Sci. 12 (1) 63-67. [ Links ]
FLAMSTEED S (2007) GRACE in Space: A Pair of Satellites Map Subtle Variations In Earth's Gravitational Field, Revealing Secret Craters, Undersea Mountains, and the Impact of Climate Change. Geodesy of the University of Texas at Austin Center for Space Research NASA/JPL. http://discovermagazine.com/2007/mar/grace-in-space/article_view?b_start:int=2&-C. [ Links ]
GARCIA D, VIGO I, CHAO BF and DEL-RIO J (2006) Interannual and annual variations in the Mediterranean Sea from satellite altimetry and GRACE data. [ Links ]
GEOLOGICAL MEMOIRS (1998) Comprehensive hydrogeologic evaluation of the Huang- Huai-Hai Plain. Ministry of Geology and Mineral Resources, People's Republic of China. Geological Publishing House, Beijing, Series 8 No. 11. [ Links ]
GUOBIN F, CHEN S, LIU C and SHEPARD D (2004) Hydro-climatic trends of the Yellow River basin for the last 50 years. Clim. Change 65 (12) 149-178. [ Links ]
HAN S, YANG Y, LEI Y, TANG C and MOIWO JP (2008) Seasonal groundwater storage anomaly and vadose zone soil moisture as indicators for precipitation recharge in the piedmont region of Taihang Mountain, North China Plain. Hydrol. Res. 39 (5-6) 479-495. [ Links ]
HINDERER J, ANDERSEN O, LEMOINE F, CROSSLEY D and BOY J-P (2006) Seasonal changes in the European gravity field from GRACE: A comparison with superconducting gravimeters and hydrology model predictions. J. Geod. 41 59-68. [ Links ]
KENDY E, ZHANG Y, LIU C, WANG J and STEENHUIS T (2004) Groundwater recharge from irrigated cropland in the North China Plain: case study of Luancheng County, Hebei Province, 1949-2000. Hydrol. Process 18 2289-2302. [ Links ]
KLEES R, ZAPREEVA EA, WINSEMIUS HC and SAVENIJE HHG (2006) The bias in RACE estimates of continental water storage variations. Hydrol. Earth Syst. Sci. Discuss. 3 3557-3594. www.hydrol-earth-syst-sci-discuss.net/3/3557/ . [ Links ]
KUSCHE J, SCHMIDT R, PETROVIC S, and RIETBROEK R (2008) Decorrelated GRACE time-variable gravity solutions by GFZ, and their validation using a ydrological model. J. Geod. 1432-1394. DOI: 10.1007/s00190-009-0308-3. [ Links ]
MARTINEZ-FERNANDEZ J and CEBALLOS A (2003) Temporal stability of soil moisture in a large-field experiment in Spain. Soil Sci. Soc. Am. J. 67 1647-1656. [ Links ]
MAYER-GUERR T, ILK K-H, FEUCHTINGER M and EICKER A (2007) Global and Regional Gravity Field Solutions from GRACE Observations, CHAMP/GRACE Science Team Meet. 2004. Published online, www.gfzpotsdam.de/pb1/JCG, 2005. [ Links ]
NAKAYAMA T, YANG Y, WATANABE M and ZHANG X (2006) Simulation of groundwater dynamics in the North China Plain by coupled hydrology and agricultural models. Hydrol. Process 20 3441-3466. [ Links ]
RIETBROEK R (2007) Validation of Oceanic Mass Changes derived from GRACE Gravimetry. A Comparison with Independent Data from Bottom Pressure Recorders in the Southern Ocean. Ph.D. thesis (unpublished), Delft University of Technology, Delft, The Netherlands. [ Links ]
RODELL M, CHEN J, KATO H, FAMIGLIETTI J, NIGRO J and WILSON C (2007) Estimating ground water storage changes in the Mississippi River basin (USA) using GRACE. Hydrogeol. J. 15 159-166. DOI: 10.1007/s10040-006-0103-7. [ Links ]
SENEVIRATNE S, VITERBO P, LÜTHI D and SCHAR C (2004) Inferring changes to terrestrial water storage using ERA-40 reanalysis data: the Mississippi River basin. J. Clim. 17 2039-2057. [ Links ]
SWENSON SC, YEH PJ-F, WAHR J and FAMIGLIETTI JS (2006) A comparison of Terrestrial water storage variations from GRACE with in situ measurements from Illinois. Geophys. Res. Lett. 33 L16401. DOI: 10.1029/2006GL026962. [ Links ]
SYED TH, FAMIGLIETTI JS, CHEN J, RODELL M, SENEVIRATNE SI, VITERBO P and WILSON CR (2005) Total basin discharge for the Amazon and Mississippi river basins from GRACE and a land-atmosphere water balance. Geophys. Res. Lett. 32 L24404. DOI: 10.1029/2005GL024851. [ Links ]
TONG S-J, LI J, YU Q and QIN Z (2009) Ecosystem water use efficiency in an irrigated cropland in the North China Plain. J. Hydrol. 374 (2009) 329-337. DOI: 10.1016/j.jhydrol.2009.06.030. [ Links ]
TAPLEY B, RIES J, BETTADPUR S, CHANBERS D, CHENG M, CONDI F, GUNTER B, KANG Z, NAGEL P, PASTOR R, PEKKER T, POOLE S and WANG F (2005) GGM02 – An improved Earth gravity field model from GRACE. J. Geod. 79 (8) 467-478. [ Links ]
WU B, JUN X, YAN N and YANG L (2008) ETWatch: An Operational ET Monitoring System with Remote Sensing. The ISPRS workshop on Geo-Information and Decision Support Systems, Iran. [ Links ]
WU W, GELLER MA and DICKINSON RE (2002) Time response of soil moisture to long-term variability of precipitation. J. Hydrometeorol. 3 604-613. [ Links ]
VACHAUD G, PASSERAT DE SILANS A, BALABANIS P and VAUCLIN M (1985) Temporal stability of spatially measured soil water probability density function. Soil Sci. Soc. Am. J. 49 822-828. [ Links ]
WAHR J and MOLENAAR M (1998) Time variability of the Earth's gravity field Hydrological and oceanic effects and their possible detection using GRACE. J. Geophys. Res. 103 (B12) 30,205-30,229. [ Links ]
XU Y and CAI Y (2005) GIS-based analysis on spatial-temporal change of groundwater level in the Hebei Plain. Acta Scientiarum Naturalium Universitatis Pekinensis 41 (2) 265-272. [ Links ]
YANG Y and TIAN F (2009) Abrupt change of runoff and its major driving factors in Haihe River Catchment, China. J. Hydrol. 374 373-383. Doi:10. 1016 /j.jhydrol.2009.06.040. [ Links ]
YANG Y, WATANABE M, TANG C, SAKURA Y and HAYASHI S (2002) Groundwater table and recharge changes in the piedmont region of Taihang Mountain in Gaocheng City and its relation to agricultural water use. Water SA 28 171-178. [ Links ]
YANG Y, WATANABE M, ZHANG X, ZHANG J, WANG Q and HAYASHI S (2006) Optimizing irrigation management for wheat to reduce groundwater depletion in the piedmont region of the Taihang Mountains in the North China Plain. Agric. Water Manage. 82 25-44. [ Links ]
YEH PJ-F, SWENSON SC, FAMIGLIETTI JS and RODELL M (2006) Remote sensing of groundwater storage changes in Illinois using the Gravity Recovery and Climate Experiment (GRACE). Water Resour. Res. 42 W12203. DOI: 10.1029/2006WR005374. [ Links ]
Received 15 May 2009; accepted in revised form 14 September 2009.
* To whom all correspondence should be addressed.
+86-311-85814368; fax: +86-311-85815093;
e-mail: yonghui.yang@ms.sjziam.ac.cn
The simple modelling method for storm- and grey-water quality management applied to Alexandra settlement
Yaw Owusu-Asante*; John Ndiritu
School of Civil and Environmental Engineering, University of the Witwatersrand, Private Bag 3, WITS 2050, South Africa
ABSTRACT
Discharges from informal settlements cause numerous adverse water quality impacts on urban areas and on receiving waters. These problems reflect local conditions with respect to economic development, level of environmental protection (including the associated infrastructure), institutional arrangements and public awareness. Development of comprehensive tools for selection of drainage management interventions, even at planning levels, is still at its early stages in South Africa. Municipalities in South Africa face many challenges in identifying, assessing and selecting the right interventions and/or strategies to address the impacts of land use on receiving waters. A spreadsheet-based model was developed in this study specifically to assist in identifying, selecting and evaluating interventions to manage storm- and grey-water quality. The model also consists of modules: to quantify water quality management objectives (load reduction targets) of pollutants of concern, to formulate implementation strategies by combining different mixes of interventions at different levels of implementation, and to cost and select the optimum management strategy. In the Alexandra settlement investigated, the identified interventions to achieve management objectives optimally consist of educational programmes, erosion and sediment control, street sweeping, removal of sanitation system overflows, impervious cover reduction, downspout disconnections, removal of illicit connections to storm drains, establishment of riparian buffers, use of rainwater tanks and exfiltration systems.
Keywords: stormwater quality, non-structural control, structural control, management interventions
Introduction
Discharges from informal settlements cause numerous adverse water quality impacts on urban areas and on receiving waters, including erosion, sedimentation, dissolved oxygen depletion, nutrient enrichment and eutrophication, toxicity, reduced biodiversity, high drinking water purification costs, and the associated impacts on beneficial water uses. These problems reflect local conditions with respect to economic development, level of environmental protection practice (including the associated infrastructures), institutional arrangements and public awareness.
Development of comprehensive tools for evaluation of drainage management interventions even at planning levels is still at an early stage in South Africa. Municipalities therefore face many challenges in assessing interventions put in place (or yet to be implemented) to address the impacts of land use on receiving waters. As a result, stormwater management strategies have often been based on ad hoc, single measure-focus approaches (usually end-of-pipe measures). In informal settlements, storm- and grey-water quality management is not planned in advance; the need arises when conditions are extremely deplorable and are adversely impacting on human health. In formal settlements, single measure-focus approaches such as ponds are usually employed. The nature of pollutants emanating from different land uses is different and, as a consequence, management interventions to improve stormwater quality would necessarily involve a number of measures as their effectiveness is variable for different pollutants. The pollution controls and management strategies investigated under this study were based on the following principles:
- Sustainability, which recognises the necessity to balance the economic, social and environmental needs and to protect resources for future generations, when planning, constructing and operating infrastructure
- Hierarchical management approach which requires stormwater quality management to be carried out firstly at source, thereafter proceeding down to the end-of-pipe, and in each case employing firstly non-structural technologies and thereafter proceeding to structural technologies if necessary
- Public consultation which assumes that all affected stakeholders are consulted and given the opportunity to provide input to decisions
- Adaptive management which recognises that we are dealing with very complex natural and man-made systems whose responses are not fully predictable with the currently available science-based tools. Best practice therefore requires selecting and designing technologies on the basis of best available data, ongoing monitoring and data collection, and revisiting decisions to produce improved technology selections and designs.
Settlement stormwater and greywater quality management requires community-level involvement and often includes the use of both structural and non-structural control interventions to protect or restore catchments exposed to chemical, physical, or biological stressors.
A number of studies on stormwater quality from Alexandra catchment and its pollution threat to the receiving environment have been undertaken by the Water Research Commission of South Africa (e.g. Ashton and Bhagwan, 2001; Campbell, 2001), the Water System Research Group of the University of the Witwatersrand (e.g. Owusu-Asante and Stephenson, 2006) and by Stephenson and Associates (2002). Those studies mostly identified the pollutants of concern, sources and causes of pollution, and threats of the pollution to the aquatic environment and health of the residents of Alexandra as well as other users of water from the Jukskei River. This study uses mostly the information from these previous studies to:
- Identify water quality management issues and their causes
- Quantify water quality management objectives (load reduction targets) for Alexandra catchment
- Identify water quality management interventions to control the pollution
- Formulate and evaluate strategies involving different mixes of interventions
- Recommend different mixes of interventions with quantified benefits to achieve the desired objectives
Description of the study area
The Alexandra township is located 12 km north-east of central Johannesburg and 4 km east of Sandton central business district. The township is split into a west and east bank by the Jukskei River; the west bank is completely developed whereas the east bank is undeveloped. The west bank, which is the principal focus of this study, covers a total surface area of about 350 ha. The official population of Alexandra is estimated at 166 971 according to the 2001 population census of South Africa. This translates to a population density of 477 persons/ha and 80 dwelling units/ha (assuming 6 persons/dwelling unit). Land-use characteristics are dominated by a high-density residential development. The township is serviced by stormwater drains which mostly consist of culverts and an underground pipe network. The main drainage channels are 3 rectangular box culverts that drain to the Jukskei River. A water-borne sewage system services the formal settlements whereas in the informal settlements sewage is removed in buckets and taken to the Alexandra Sewage Works. The area slopes steeply in a west-east direction towards the Jukskei River, with slopes varying from 12.5% in the western sections to 3.3% in the sections closer to the Jukskei River. The area is underlain by highly weathered and decomposed rocks of the Achaean granite forming the Johannesburg/Pretoria dome. The rock has decomposed to form a residual soil layer of loamy sand which varies in depth from 0.5 to 6.0 m. Overlying these residual soils are various transported soils, as well as unconsolidated fill material in some areas. Alluvial wash material occurs in the gully and floodplain of the Jukskei River. Other catchment physical and water quality parameters are summarised in Table 1.
Pollution loads discharged from Alexandra sub-catchment are due to overcrowding, poor living conditions and inadequate sanitation and drainage services. The backlog in sanitation and drainage includes solid waste, sewage, grey-water and severely contaminated stormwater runoff. The paths of these waste streams are to a large extent merged; solid waste, sewage, greywater and contaminated runoff enter surface drains and eventually discharge into the Jukskei River. Studies by Owusu-Asante and Stephenson (2006) and Campbell (2001) have indicated elevated concentrations of nitrogen, phosphorus, COD, lead, suspended solids, and faecal coliforms in stormwater which are well in excess of the resource water quality objectives of the Jukskei River.
Analysis of some management issues and identification of management interventions
This section of the study involved identifying factors that result in pollution to the receiving Jukskei River, to provide an understanding of the cause-effect relationships of pollution issues in the settlement. The significance of this analysis was to ensure that the right intervention, that takes account of the identified problems and their root causes, was identified, selected and implemented. The analysis was undertaken by a combination of:
- Desk-top study, involving a review of existing information contained in reports, studies and monitoring programmes
- Field-work, involving an inspection of the settlement and undertaking an approximate settlement audit through flow and quality monitoring
- Interviews conducted with community representatives to obtain information on pollution issues
The analysis of water quality issues in Alexandra settlement is summarised in Fig. 1 and is described as follows. The causes of pollution for the 4 waste streams (i.e. solid waste, sewage, greywater and stormwater) are situated within the institutional and social environment of the settlement. A large proportion of the settlement is not formalised and this is seen as a major root cause of pollution. A formal settlement is one that has been planned with laid-out stands, a defined road network, water reticulation system (into houses or at least a standpipe per stand), solid waste disposal systems, wastewater disposal system (either waterborne system, septic tanks and soak-aways or pit latrines), and space for runoff treatment facilities.
Other important institutional concerns include a lack of funds within the local authority to address the problems and lack of capacity to operate and maintain the services. Social issues include poor living standards, non-payment or illegal use of services, vandalism and lack of awareness and involvement with respect to the proper use of the services and water quality issues. A linkage exists between institutional and social causes of pollution; for example, the non-payment of services adds to the local authority's inability to provide funds and capacity to operate and maintain the services. Similarly, the neglect or inability of the local authority to formalise the settlement attracts non-payment and overloading of services and also lack of community awareness and involvement in water quality issues. The institutional and social issues are manifested in the 4 waste streams. The inadequate services for sanitation, solid waste, greywater and stormwater result in significant build-up of pollutants on the catchment surfaces which are eventually washed by storm runoff into the Jukskei River.
Management interventions needed to be selected to deal with the issues/causes of pollution outlined in Fig. 1. The social issues, such as non-payment and vandalism of services and lack of awareness and community involvement in water quality issues, can be managed through combinations of education and awareness programmes, economic empowerment, service delivery and improvements in maintenance. The local authority is formalising the settlement through relocation of many households. This will involve: provision of a public spatial structure to provide relief from overcrowding; creation of public gathering places and riparian buffers (RB); catchment erosion and sediment controls (CESC); and improvement in engineering services. Although this intervention is currently underway, the value of effective capacity building of the local authority to operate and maintain the services cannot be overemphasised. Formalisation of the settlement will in turn open up opportunities for other specific interventions to deal with issues resulting from the 4 waste streams.
Street sweeping (SS) and domestic animal waste education (DAWE) programmes are interventions to control pollution from the solid waste stream in addition to the provision and frequent emptying of skip bins. Sewer or sanitation overflow repairs (SSOR) intervention may be employed to arrest pollution from the sewage waste stream. After formalisation of the settlement (with improved engineering services), illicit connections (ILL) to storm drains can be removed to deal with pollution from the grey-water waste stream. A number of specific interventions are required for the stormwater waste stream and they can be incorporated in the formalisation process or afterwards. They include impervious cover reduction (ICR), downspout disconnection (DD), exfiltration systems (ExS), use of rainwater tanks (RT) and riparian buffers (RB). These interventions are described below.
Domestic animal waste education intervention: A common problem in low-income settlements in developing countries, in terms of pollution to the receiving water environment, is defecation from domestic animals such as dogs, sheep, goats, cattle, pigs, chickens, ducks, turkeys, donkeys, horses and others. Many of these animals roam about in the settlements while some of them are kept in smallholdings in backyards. Loads from domestic animal waste are estimated based on 'typical' average daily mass production of waste and concentrations of pollutants in a unit mass of waste. The loads reduced are estimated based on the fraction of owners who clean up or properly dispose of their domestic animals' waste.
Street sweeping (SS) intervention: The efficiency of street sweeping depends on the type of sweeper used (e.g. broom, brush-type mechanical, vacuum-assisted) and frequency of sweeping. The loads reduced per sweep are the product of load accumulated in the street and efficiency of street sweeping.
Downspout disconnection intervention: This involves disconnection of downspout and redirection of roof runoff to lawn or pervious areas. By returning the roof runoff to soils through infiltration, this intervention reduces runoff volume and pollutant loadings to surface water resources. Groundwater is protected by infiltration and percolation through the soils by processes such as filtration, adsorption and biodegradation. Downspout disconnection load reduction is estimated based on the proportion of rooftop area to the total impervious cover.
Riparian buffers (RB) intervention: Riparian vegetation reduces pollutant load through treatment mechanisms of vegetative filtration, adsorption, biological uptake of nutrients, and sometimes infiltration. The load reduction is obtained by direct application of removal efficiency of RB intervention to the total urban annual storm load.
Impervious cover reduction (ICR) intervention: ICR involves better site design techniques such as permeable pavements, narrowing street widths and reducing the number and size of parking spaces to reduce the total impervious cover in urban catchments. Formalisation of low-income and high-density settlements through relocation of households to create space (converted to pervious areas) for stormwater management options is also a technique to reduce impervious cover. Reduction of impervious cover reduces the amount of runoff, which in turn reduces the catchment pollutant loads delivered to streams. Load reduction is estimated based on the proportion of impervious cover reduced.
Illicit connection removal (ILLC) intervention (Brown et. al, 2004): Non-storm flows discharging from storm drainage systems can contribute significant pollutant loadings to receiving waters. If these flows are ignored (by only considering storm flow, for example), little improvement in receiving water conditions may occur. Illicit non-storm flows originate from residential, commercial and industrial land uses and they typically include grey-water and sewage. This intervention requires municipalities to identify and locate sources of non-storm flow discharges into storm drains and institute appropriate actions to eliminate them. Load reduction is estimated based on the proportion of non-storm flow removed.
Sanitary sewer overflow repair/abatement (SSOR) intervention: Sanitary sewer overflows (SSOs) occur both during and between storms; that is, they contribute to both storm and non-storm loads. Non-storm loads are caused by breakages and blockages while the storm loads are caused by lack of capacity due to infiltration of rainfall into the sewer pipes (Stephenson and Barta, 2005). SSO loads are extrapolated from data about the sewer system; for example, flow is estimated as a product of number of overflows per unit length (No), total sewer length (l), and a typical overflow volume (V).
Catchment surface erosion and sediment control (CatchESC) intervention: This intervention emphasises erosion control measures, including grassing, tree planting and other practices that limit clearing and grading, to reduce the concentration of sediment in runoff leaving the settlement. The modified Universal Soil Loss Equation (USLE) is used to calculate sediment load from settlement pervious surfaces. The product of the sediment load and the efficiency of control measures yields the loads reduced.
Rainwater tanks (RT) intervention: Use of rainwater tanks allows for stormwater harvesting and reuse strategies, which may have benefits both for potable water conservation and also for reduction of runoff volume. Stormwater stored in tanks can be used for non-potable household water use, watering of gardens (trees, flowers, grass, vegetables). The reduction in runoff volume in turn reduces pollutant loads washed off from the catchment surface. The RT intervention is suitable especially in high-density residential settlements where downspout disconnection is not feasible. It can also be used in conjunction with downspout disconnection in medium- and low-density settlements. Rainwater tanks intervention load reduction is estimated based on the proportion of rooftop area captured to the total impervious cover.
Stormwater exfiltration systems (ExS): ExS were developed to improve the stormwater quality from fully urbanised areas (Li et al., 1997). The system consists of 2 x 200 mm perforated pipes, plugged at the downstream end, which are laid below the storm sewer at the upstream section of the sewer system. The sewer and the perforated pipes are encased in a granular stone trench wrapped with filter fabric. Figure 2 shows a typical cross-section of an exfiltration system. The first flush of runoff will be directed to the perforated pipes with plugged ends. Together with the surrounding granular bedding, this pipe-trench system can store the runoff of a 15 mm rainfall event and allow exfiltration within a certain period of time depending on the permeability of the host soil. Excess runoff will bypass the perforated pipe system and travel through the storm sewer. The perforated pipes can be cleaned with a hydraulic nozzle. Pre-treatment of storm runoff using screening at the perforated pipe inlet can also reduce the maintenance requirements. The stormwater exfiltration system can be constructed within the right-of-way and integrated with storm sewer replacement or road rehabilitation projects. Load reductions are estimated by applying the interventions efficiency to the fraction of storm load from the contributing areas.
River assimilative capacity (RAC): Natural water bodies are able to serve many uses, including the transport and assimilation of waterborne wastes. But as natural water bodies assimilate these wastes, their quality changes. If the quality drops to the extent that other beneficial uses are adversely affected, the assimilative capacities of those water bodies have been exceeded with respect to those affected uses. Water quality management interventions are actions taken to ensure that the total pollutant loads discharged into receiving water bodies do not exceed the ability of those water bodies to assimilate those loads, while maintaining the levels of quality specified by resource water quality objectives for those waters. RAC intervention depends on natural instream processes, such as sedimentation, adsorption, aeration and biological degradation, as its removal mechanisms. Providing opportunities for turbulent flow may enhance aeration. Cascades and small weirs can help to increase physical entrainment of oxygen into the water column, and the inclusion of riverine habitats with significant roughness will also promote turbulence and aeration.
Goals and objectives of the water quality management
Management objectives (Table 2) were developed by Owusu-Asante (2008) to protect the water quality in the Jukskei River and its catchment, with regards to Jukskei River water quality guidelines and objectives (BKS, 1996). The management objectives, based on the principle of sustainability, include both long-term and short-term objectives. The long-term objectives represent the goal for the catchment and short-term objectives represent quantifiable load reduction targets that form the basis of actions or interventions to be implemented in order to achieve the goals. The goal is to achieve the resource water quality objectives of Jukskei River by minimising the impacts of pollution from Alexandra settlement on the aquatic ecosystem and other water users.
The load reduction targets for storm and non-storm flows were determined as given by Eq. 1 and Eq. 2 respectively, by comparing the load estimated from monitored data (less the load reduced by existing interventions) with the load estimated from the set water quality objectives of the Jukskei River.
where:
Lred = Pollutant storm load reduction target
Lsl = Pollutant storm load estimated using monitored concentrations
L'sl = Pollutant storm load estimated using resource water quality objective concentrations
Lslext = Pollutant storm load reduced by existing interventions. If monitoring was undertaken downstream of interventions (or outfall) then Lslext = 0
L'red = Pollutant non-storm load reduction target
Lnsl = Pollutant non-storm load estimated using monitored concentrations
L'nsl = Pollutant non-storm load estimated using resource water quality objective concentrations
Lnslext = Pollutant non-storm load reduced by existing interventions. If monitoring was undertaken downstream of interventions then Lnslext = 0
Formulation of alternative water quality management strategies
Alternative strategies for Alexandra settlement were developed by combining different mixes of the interventions identified above. The strategies were formulated with respect to:
- Two implementation phases, i.e., short-term (up to 5 years), and medium to long-term (more than 5 years)
- Different magnitudes of implementation of each intervention.
Different strategies were formulated by altering the implementation magnitude (factor) and timeframe of some or all of the interventions identified. The process of formulating the strategies in the model and the search for the 'best' management strategy in this study were achieved through 'trial and error' but, in principle, a strategy formulated has to meet the local authority's budget (or cash flow) and development plans.
- For example, the 2nd strategy (S-2 in Table 5) evaluated in this study was formulated as follows:
- 50% of the households will be reached with an education and awareness programme, in particular, to deal with domestic animal waste issues in the first 5 years
- Daily street sweeping (including refuse removal) will be accomplished in 60% of all feasible streets in the settlements in the first 5 years
- 100% maintenance and repair of all broken, blocked, and overflow sewers and other sewage systems to be achieved within the next 5 years
- De-densification and formalisation of the settlement will be completed in the next 10 or more years with 30% of the feasible impervious cover reduced. De-densification and formalisation of the settlements were launched in a 7-year project (Alexandra Renewal Project) in 2001. Much has been done to date but there is still more to do to achieve the desired goal.
- 90% of feasible areas will have downspouts disconnected after formalisation of the settlement
- 83% of all illicit connections will be removed after formalisation of the settlement
- 40% of the riparian buffer zone will be available and established to treat storm flow or protect the Jukskei River after formalisation of the settlement
- 95% of the feasible households will be provided or equipped with rainwater tanks after formalisation of the settlement
- 80% of the feasible roads will be retrofitted with stormwater exfiltration system during the formalisation of the settlement.
Evaluation of alternative water quality management strategies
In order to facilitate the evaluation of alternative strategies with respect to pollutant load removal effectiveness, a model was developed (Owusu-Asante, 2008). The program can be used as a decision-support system for rapid assessment of various catchment water quality management interventions at planning level. The model was developed using macros in Visual Basic for Applications (VBA) and is interfaced with an EXCEL spreadsheet for data input and output of results. The program applies the Simple Modelling Method – an approach whose data requirements and level of accuracy are appropriate for preliminary planning of water quality management interventions. Continuous simulation models such as SWMM5 (Rossman, 2004) are more versatile and can model complex processes in detail and test the system response to different types of inputs and system configurations on a continuous basis. However, they do not incorporate non-structural interventions and other sources of pollution such as illicit connections and overflows from sewage systems, and are unduly sophisticated and time-consuming for preliminary planning purposes.
The model application flowchart is presented in Fig. 3 and the sequential steps involved are described herein. The 1st step in the model application is catchment data (Table 1) input. The 2nd step involves input of resource water quality objectives for pollutants of concern. At this point, it is assumed that the resource water quality objectives for the catchment have been established and pollutants of concern have been defined. The methods to establish resource water quality objectives and identify pollutants of concern are described elsewhere, e.g. DWAF (2006). The 3rd step involves input of data (shown in Table 3) on existing management interventions. Due to financial constraints, many of the data in this study could not be obtained and as such they were assumed in the model based on professional judgement. To estimate the load reduction target, the load from monitored data (less the load reduced from existing interventions) is compared with the load from the set resource water quality objectives. Hence the 3rd step is not required if the monitoring point is downstream of the existing interventions, as the load estimated from the monitoring data would have already accounted for the load reduced by the existing interventions. The 4th step is to run the model to evaluate the existing interventions and determine the catchment load reduction targets. Computational methods to estimate load reductions for each intervention are described comprehensively in Owusu-Asante (2008) and the main factors involved are summarised in Table 4. Steps 5 and 6 are about identifying future management interventions and formulating alternative management strategies, respectively, as described above. Step 7 consists of input of data (shown in Table 3) of the identified strategies. In step 8 the model is run to: evaluate each strategy, estimate residual load reduction targets, and estimate the strategy cost. If the objective is met optimally, that is, the residual load reduction targets are zero or close to zero, the strategy (implementation factors and cost) is recorded in the 10th step. If the water quality objectives are not met optimally, the implementation factors are successively adjusted/improved in Step 9, before repeating Step 8. The process of meeting the objectives optimally (Steps 7 to 10) is based on best judgement or trial and error. Steps 7 to 10 are repeated for different independent strategies formulated. In the last step, the strategy with the minimum cost is selected.
Average annual runoff volume and pollutant loading is estimated in the model by The Simple Modelling Method, which is a modified version of The Simple Method (Schueler, 1987). This method estimates the average annual pollution load of stormwater and grey-water, commonly expressed in kilograms of pollutant exported per year. It is a relatively simple modelling technique, which relates land use, mean annual precipitation, catchment runoff characteristics and average pollutant concentrations to estimate the annual pollutant load. In the Simple Modelling Method, the runoff volume and pollution load is obtained from pervious and impervious areas, in contrast to The Simple Method applied in CWP (2001), which estimates runoff volume and load from impervious areas only. Pervious areas in developing areas contribute substantial loads to the receiving environments (due to intense thundershower activity with inherent high rainfall erosivity, shallow erodible soils, limited vegetation cover and/or poor conservation management techniques); hence the application of The Simple Method in South African conditions would most likely underestimate runoff volume and pollutant loads.
The Simple Modelling Method estimates storm loads as a product of annual runoff volume and pollutant concentration, as given in Eq. 3.

where:
L = Annual storm load (kg/yr)
R = Annual runoff (mm)
Co = Pollutant event mean concentration (mg/ℓ).
A = Area (km2)
For bacteria, the conversion factor is modified, so that the loading is defined by Eq. 4:

where:
L = Annual load (m. count/yr)
R = Annual runoff (mm/yr)
Cb = Bacteria concentration (m. count/100 mℓ).
A = Area (km2)
10 = A conversion factor
Annual runoff is estimated as a product of annual runoff volume and runoff coefficient, as given in Eq. 5.

where:
R = Annual runoff (mm)
P = Mean annual precipitation (mm)
Pf = Fraction of annual precipitation events that produce runoff (assume 0.9)
C = Runoff coefficient (weighted average of pervious and impervious areas)
Percentage impervious area is used to compute a weighted runoff coefficient for the catchment. Non-storm loads (i.e. loads derived from dry-weather flows) are also estimated as a product of flow and concentration using the same basic methodology of the Simple Modelling Method. Because non-storm flows are location-specific, the accuracy of estimates depends on monitored information about the system being studied.
Results and discussion
Twenty strategies were evaluated and those which achieved the management objectives (Table 2) are shown in Table 5 indicating the costs, implementation factor and timeframe of each intervention. The 5th strategy (S-5) came out with the minimum cost and hence represents the 'best' strategy out of those considered (Table 5). Most of the unit treatment costs were assumed in the analysis; hence the cost figures must be taken as indicative only. Table 6 shows estimates of storm and non-storm loads from Alexandra settlement compared with the target loads. The comparison yielded loads to be retained which were set as management objectives in Table 2. Only evaluation results of the 5th strategy are presented in this paper and are shown in Table 7. The Jukskei River system has enormous capacity to treat pollution from Alexandra catchment. In all the strategies evaluated, the river assimilative capacity is more effective than any of the interventions modelled, except illicit connection removal intervention (Table 7). For storm loads, interventions found to be most effective were: use of rainwater tanks, impervious cover reduction, downspout disconnection, exfiltration systems, and catchment erosion and sediment control. Non-storm loads from Alexandra result mostly from illicit connections to the drainage system and hence are reduced effectively by illicit connection removal intervention. The evaluation also indicated that for non-storm flows a threshold of 83% implementation of illicit connection removal intervention was required to meet management objectives for bacteria. The critical pollutants to reduce in storm and non-storm flows were suspended solids (SS) and bacteria (FC), respectively. In Table 7, comparison of Row 11 with Row 17 and Row 15 with Row 18 shows that the loads reduced by the interventions exceed the load reductions required to meet management objectives. This was due to the assumption made in the model conceptualisation that non-structural interventions do not act in series (because the points of their applications are very diffuse), and it reflects a shortcoming of the model which requires attention in future refinements.
Conclusions and recommendations
There have been a number of studies on stormwater quality from Alexandra catchment (Johannesburg, South Africa) and its pollution threat to the receiving environment. These studies mostly identified the pollutants of concern, source and causes of pollution, and threats of the pollution to the aquatic environment and health of the residents of Alexandra as well as other users of water from the Jukskei River. The case study presented in this paper uses mostly the information from the previous studies to:
- Estimate storm and non-storm loads for Alexandra catchment
- Quantify water quality management objectives (load reduction targets) for Alexandra catchment
- Formulate alternative management strategies involving different mixes of identified interventions
- Evaluate the strategies by quantifying their load reductions
- By using a trial-and-error approach, select the best strategy from those considered based on least cost analysis
The analysis was carried out using a spreadsheet-based model specifically designed for the task. A sequence of actions (Strategy 5) that the municipality may implement to improve and manage stormwater quality as part of capital and operational projects includes:
- 100% of feasible pervious surface area (i.e. after formalisation of the settlement) will be managed with erosion and sediment control techniques in the first 5 years
- Daily street-sweeping (including refuse removal) will be accomplished in 75% of all feasible streets in the settlements in the first 5 years
- Formalisation of the settlement will be completed in the next 10 or more years with 15% of the feasible impervious cover reduced
- 50% of feasible areas will have their downspouts disconnected after formalisation of the settlement
- 83% of all illicit connections will be removed after formalisation of the settlement
- 100% of the feasible households will be provided or equipped with rainwater tanks after formalisation of the settlement
- 100% of the feasible roads will be retrofitted with stormwater exfiltration system during the formalisation of the settlement
Non-structural and operational controls such as educational programmes, erosion and sediment control, frequent street sweeping and refuse removal, and maintenance operations should be ongoing procedures since they are preventive measures, cost-effective and constitute good house-keeping. As part of a de-densification and relocation of dwellings project, feasible residential and commercial areas should gradually have impervious cover areas reduced (converted to pervious areas) and downspouts disconnected. Ways to achieve higher per cent coverage of impervious cover reduction, downspout disconnection, illicit connection removal, and rainwater tanks should also be further investigated as well as the use of subsidies, regulatory measures and soak-away pits to enhance the implementation of these interventions. It will take time to de-densify and formalise Alexandra settlement and also to confirm the cost and effectiveness, under local conditions, of emerging interventions such as exfiltration systems, impervious cover reduction, downspout disconnection, illicit connection removal, and riparian buffer interventions. Thus they should be implemented gradually over a long period of time.
The main limitations of the model are:
- The model is analytically based on lumped parameters which are subject to many assumptions and limitations as opposed to continuous modelling
- The model provides estimates of many source loads and load reductions for which reliable monitoring or performance data is not yet available especially in developing areas. It must be recognised, however, that the model defaults are nothing more than informed judgments or heuristics based on literature review. They have been included in the framework to help stormwater managers, who would otherwise not have access to these data, to evaluate as many sources and treatment/management options as possible.
- The model makes simplified assumptions and employs analytical methods for the calculation of loads and load reductions (Owusu-Asante, 2008) for which much more complicated analyses may be conducted. The simplifications in the model lead to 'uncertainty' in the results. Hence output values are subject to imprecision.
- The model tracks only 6 pollutants: nitrogen, phosphorus, chemical oxygen demand, lead, suspended solids and faecal coliforms
The following recommendations are made towards enhancement of the model developed under this research:
- The general scarcity of appropriate quantitative information on urban water quality characteristics and management interventions (including design parameters, costs, and removal effectiveness) hampers the selection of suitable management interventions that can be deployed to manage the impacts of urban water quality pollution. Consequently, it is essential that carefully targeted research should be conducted to fill these information gaps. The input parameters into the model can be used to guide the type of information needs.
- Development of a database to capture all monitored information is crucial to water quality management in settlements. This should include a database on structural treatment measures' performance to help establish their important design parameters and elucidate the parameter effects on the structural treatment measures' performance. A database on non-structural programmes will help to establish the factors that are critical to their effectiveness and sustainability. Any developed database should be readily available to the public or at least all stakeholders and should be a driving force for knowledge sharing.
- The original research proposal included an undertaking of field treatability tests of some interventions as a case study. This action was initiated in Kliptown, a township in Johannesburg, but could not be completed due to financial constraints. Hence all the interventions identified and included in the model have not been tested locally to ascertain their applicability and suitability. It is therefore recommended that the model be tested using actual monitored data from a selected settlement. This will require a long-term data collection programme.
- The extent to which geographic information systems (GIS) can be locally used as appropriate management and communications technologies to quantify urban runoff, identify and select appropriate management interventions and communicate choices to decision-makers needs further research
- The model will be greatly enhanced if it can be re-designed to run continuous simulation to accommodate temporal and spatial variation of input parameters
- Selection of least-cost strategy with the model is presently achieved by a process of trial and error. The selection process can be improved if the model can be linked to an optimiser, and research into this aspect is recommended.
- The model has enormous input data requirements, each of which have their own uncertainties. Classical uncertainty analysis may not be feasible for this type of model but further elucidation of how uncertainty can be accounted for remains an important research gap.
A methodology for evaluating the benefits of the interventions to the Jukskei River, health and wellbeing of the people of Alexandra should be developed. This would also require continuous performance monitoring to assess the actual performance of the interventions relative to their expected performance. Most of the information used in the model was assumed and sourced from other international studies. It is recommended that future data capture should be encouraged and this data substituted in the model to enhance the accuracy in the parameter estimations. Thus the study's recommendations are only preliminary and should be examined rigorously before adoption, and reviewed and updated periodically as part of the capital and operational budget process.
References
ASHTON PJ and BHAGWAN J N (2001) Guidelines for the Appropriate Management of Urban Runoff in South Africa. Integrated Report. WRC Report No. TT/155/01. Water Research Commission, Pretoria, South Africa. [ Links ]
BKS INC. (1996) Jukskei River Water Quality Management: Development of Water Quality Management Objectives. Final Report to the Department of Water Affairs and Forestry, Directorate of Water Quality Management, South Africa. [ Links ]
BROWN E, CARACO D, CENTER FOR WATERSHED PROTECTION and PITT R (2004) Illicit Discharge Detection and Elimination. A Guidance Manual for Program Development and Technical Assessments. Centre for Watershed Protection, Ellicott City, M.D. USA. [ Links ]
CAMPBELL LA (2001) A Study on the Fate of Urban/Stormwater Runoff from Alexandra Township in the Jukskei River. WRC Report No. 598/3/01. Water Research Commission, Pretoria, South Africa. [ Links ]
CANDARAS AM, CARVALHO MJ and MAN-KIT KOO (1995) City of Etobicoke Exfiltration and Filtration Systems Pilot/Demonstration Project. In: James W (ed.) Modern Methods for Modeling the Management of Stormwater Impacts. Computational Hydraulics International, Guelph, Ontario. [ Links ]
CWP (CENTRE FOR WATERSHED PROTECTION) (2001) Watershed Treatment Model. Centre for Watershed Protection, Ellicott City, M.D. USA. [ Links ]
DEHD (DEPARTMENT OF ECONOMIC AND HUMAN DEVELOPMENT, SOUTH AFRICA (2007) The Economic Imperatives of Environmental Sustainability. City of Cape Town, South Africa. December 2007. URL: www.capetown.gov.za/en/ehd/Documents/ EHD_-_The_Economic_Imperatives_of_Environmental_Sustainability_161200813435_.pdf (Accessed January 2008). [ Links ]
DWAF (DEPARTMENT OF WATER AFFAIRS AND FORESTRY, SOUTH AFRICA) (2006) Resource Directed Management of Water Quality: Management Instruments. Volume 4.2. Guideline for Determining Resource Water Quality Objectives (RWQOs), Allocatable Water Quality and the Stress of the Water Resource. (2nd edn.). Water Resource Planning Systems Series, Sub-Series No. WQP 1.7.2. Department of Water Affairs and Forestry, Pretoria, South Africa. [ Links ]
LI J and KOO M (1994) Development of stormwater percolation technology. Proc. Environmental Engineering Conf. 1994. Winnipeg, Manitoba, Canada. 278-288. [ Links ]
LI J, TRAN J, HENRY D, and LIANG W (1997) Development and evaluation of the City of Etobicoke Exfiltration System. Proc. The Operational Water Management Conf. 1997. Copenhagen, Denmark. 407-413. [ Links ]
MTSHELWANE Z (2002) Thousand new houses in Alex upgrades. City of Johannesburg website. URL: www.joburg.org.za/Thousand New Houses in Alex Upgrades.htm (Accessed June 2007). [ Links ]
OWUSU-ASANTE Y (2008) Decision Support System for Managing Stormwater and Greywater Quality in Informal Settlements in South Africa. Ph.D. Thesis. School of Civil and Environmental Engineering, University of the Witwatersrand, South Africa. [ Links ]
OWUSU-ASANTE Y and STEPHENSON D (2006) Estimation of storm runoff loads based on rainfall-related variables and power law models – case study in Alexandra. Water SA 32 (2) 137-143. http://www.wrc.org.za/downloads/watersa/2006/April%2006/1818.pdf. [ Links ]
ROSSMAN LA (2004) Stormwater Management Model, Version 5, User Manual. United States EPA, Cincinnati. [ Links ]
SCHUELER TR (1987) Controlling Urban Runoff – A Practical Manual for Planning and Designing Urban BMPs. Metropolitan Washington Council of Governments, Washington DC. [ Links ]
STEPHENSON and ASSOCIATES (2002) Investigation of stormwater culverts on the tributaries of the Jukskei River in the Alexandra Township. Consolidated report to City of Johannesburg, South Africa. Final report. [ Links ]
STEPHENSON D and BARTA B (2005) Impacts of Stormwater and Groundwater Ingress on Municipal Sanitation Services. WRC Report No. 1386/1/05. Water Research Commission, Pretoria, South Africa. [ Links ]
WALSH G (2001) quoted in TAYLOR A and WONG THF (2002) Non-structural Stormwater Quality Best Management Practices – A Literature Review of Their Value and Life cycle Costs. Technical Report 02/13, Cooperative Research Centre for Catchment Hydrology. Melbourne, Australia. [ Links ]
Received 6 February 2009; accepted in revised form 4 June 2009.
* To whom all correspondence should be addressed.
+2772 1707610; fax: +2711 7177045;
e-mail: Owusuy@hotmail.com


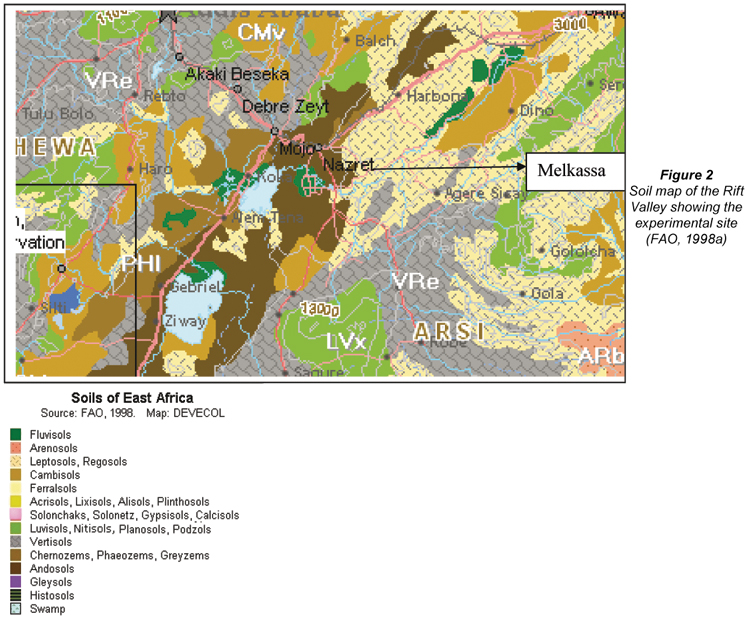
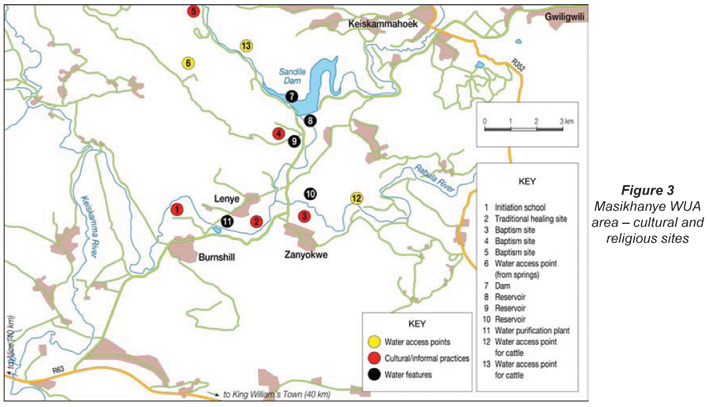