


Services on Demand
Article
 English (pdf)
 Article in xml format
 Article references
Indicators

Related links
-
 Cited by Google
 -
 Similars in Google
Share

 Permalink
Water SA
On-line version ISSN 1816-7950
Print version ISSN 0378-4738
Water SA vol.35 n.5 Pretoria Oct. 2009
Biological sulphate reduction with primary sewage sludge in an upflow anaerobic sludge bed (UASB) reactor –Part 4: Bed settling characteristics
J Poinapen; GA Ekama*; MC Wentzel
Water Research Group, Dept. of Civil Engineering, University of Cape Town, Rondebosch 7701, South Africa
ABSTRACT
The success of the UASB reactor depends largely on the settling properties and stability of the sludge bed which comprises the anaerobic active biomass. The solid-liquid separation behaviour of the sludge bed in 2 UASB reactors (R1 at 35ºC and R2 at 20ºC) fed with primary sewage sludge and sulphate was investigated because this appeared to be a retention time-defining feature of the system. Consequently, the settling rate of the various solids fractions in the sludge was measured in a settleometer to determine if bed expansion or sludge settleability was the capacity-limiting process. It was found that both sludges settled well and at an upflow velocity of up to 1.16 m/h 99% of the total sludge mass was retained. This upflow velocity was 9.1 and 13.7 times higher than the maximum operating upflow velocity of UASB reactors R1 (0.127 m/h) and R2 (0.085 m/h) respectively that caused system failure. Tests were also done to demonstrate the effect of upflow velocity (Vup) on the sludge bed expansion. Relative to the settled sludge volume at zero upflow, the R1 sludge expanded 1.8 times at a Vup of 0.127 m/h while R2 sludge expanded 2.0 times at a Vup 0.085 m/h. From the tests, R1 (35ºC) sludge had a better settleability and expanded less compared to R2 (20ºC) sludge for the same applied upflow velocity. Because in operating R1 and R2, the bed volume was kept constant, the mass of sludge removed from the system correspondingly increased as upflow increased and the bed expanded, causing a reduced sludge age and sludge bed mass to mediate the bioprocesses. It was concluded that the system failure was caused by bed expansion rather than by the sludge settleability.
Keywords: biological sulphate reduction, upflow unaerobic sludge bed reactor, sludge settleability, bed expansion
Nomenclature
| BER | bed expansion ratio |
| BSR | biological sulphate reduction |
| COD | chemical oxygen demand |
| Dia | diameter |
| HAc | acetic acid |
| HRT | hydraulic retention time |
| ID | inside diameter |
| OD | outside diameter |
| PSS | primary sewage sludge |
| PVC | polyvinylchloride |
| Q | hydraulic flow |
| R1 | UASB Reactor 1 |
| R2 | UASB Reactor 2 |
| TSS | total suspended solids |
| UASB | upflow anaerobic sludge bed reactor |
| VFA | volatile fatty acids |
| Vup | upflow velocity |
Introduction
The application of the upflow anaerobic sludge bed (UASB) reactor in high-rate anaerobic wastewater treatment systems (mainly from industrial sources) has gained considerable attention over the past 3 decades. The success of the UASB reactor depends largely on the settling properties and stability of the sludge bed which contains the active biomass. A stable sludge bed provides a long sludge retention time and a high sludge mass, and these are key features to ensure process stability and high substrate loading rates, thereby maximising the UASB system performance.
From the operation of 2 lab-scale UASB reactors (R1 and R2 operated at 35 oC and 20ºC respectively) fed sulphate and PSS, the HRT was decreased (by increasing the feed flow rate) to determine the minimum HRT (giving the smallest reactor volume) at which the effluent meets the quality criteria (i.e. SO42-<250 mgSO42-/ℓ and VFA<100 mgHAc/ℓ) (Poinapen et al., 2009). For instance, reactor R1 had a minimum HRT of 13.5 h when fed 1 500 mgSO42-/ℓ. A further reduction in HRT (< 13 h) resulted in unstable bed conditions and progressive system failure, indicated by poor effluent quality, that is, high effluent VFA, SO42- and particulate COD. This prompted an investigation into the solid-liquid separation behaviour of the sludge bed because this appeared to be a retention time-defining feature of the system. Consequently, the settling rate of the various solids fractions in the sludge was measured to determine whether bed expansion or sludge settleability was the capacity-limiting process.
Accordingly, a sludge settleability device, called a settleometer, was built and operated to test the 2 UASB sulphidogenic sludges (R1 and R2 sludges) at different flow through rates. This settleometer was designed based on the method developed by Moosbrugger (1994).
Materials end methods
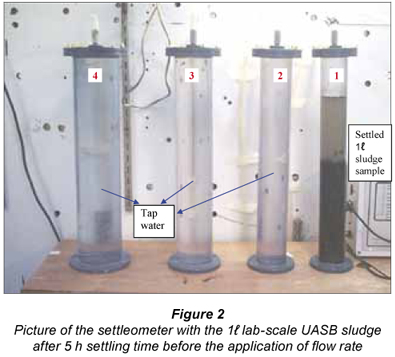
A series of 4 vertical transparent PVC columns of outer diameters (OD) 63, 75, 90 and 110 mm and internal diameters (ID) 57, 67.8, 86.4, 105.6 mm respectively, was interconnected by plastic tubing (20 mm inner diameter). Each PVC column was 500 mm tall and was capped on both top and bottom ends with solid PVC lids with an outlet in the centre to attach the interconnecting plastic tubing. Stainless steel clamps were fitted to the bottom tubing for drainage. A collection vessel (20 ℓ) was connected to the last (largest) column (OD 110 mm) which was then fitted to a peristaltic pump. The pump was in turn connected to the first (smallest) PVC column (OD 63 mm) to close the water circuit. The 3rd and 4th columns were the ones representing the UASB column since their IDs were close to the UASB reactor ID (93 mm). A schematic flow diagram and a photograph of the settling device are shown in Figs. 1 and 2.
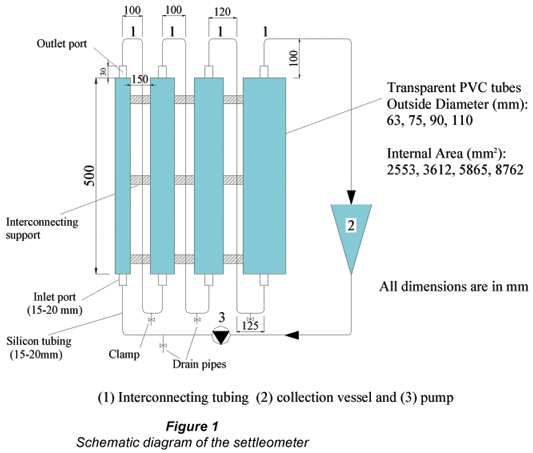
The principle of the settleometer is relatively simple: A pre-determined volume (say 1 ℓ) of sludge is taken from a UASB reactor and placed in Column 1 (smallest). A constant flow rate (Q) is applied in an upflow mode similar to the UASB reactor (Fig. 2). Since the upflow velocity (Vup) decreases incrementally in the subsequent columns (from smallest to largest), the sludge sample is fractionated according to particle size and density. The percentage sludge mass retained in each column is determined by dividing the mass of sludge retained in each column by the mass of sludge of the original sample. The sludge concentration in each column is determined by dividing the mass of sludge retained in each column by the initial sludge sample volume. Both the percentage sludge masses and the sludge concentrations are plotted against their respective upflow velocities, resulting in a graph describing the settling profile of the sludge at different hydraulic upflow velocities.
Operating and testing procedures
At the start of the experiment, it is necessary to fill the system with tap water and expel all air bubbles from the system – air bubbles, if not removed, impacts negatively on the results because they attach to sludge particles and create turbulence inside the columns when the pump is running. First, all 4 columns are filled to the top with tap water before closing with the top lids (Fig. 2). Then, tap water is added to the collection vessel and pumped through the system to fill all the interconnecting tubes and allow a smooth flow of water through the whole settleometer. This is necessary in order to expel all air bubbles. Each column interconnecting tube has at its uppermost section a tee-piece (normally clamped shut) from which air can be vented. When all the air bubbles have been expelled from the system, Column 1 (smallest) is emptied while the other 3 are left full. Then a UASB sludge sample is prepared in such a way that it represents the UASB reactor sludge bed and added carefully (to minimise sludge break-up) through a funnel to Column 1, ensuring that there are no air bubbles in the system before closing the column with its lid.
Both R1 and R2 sludges were tested separately in the settleometer. The entire sludge bed was drained from either R1 or R2 and gently mixed before a 1 ℓ sample was collected. A further 50 mℓ sample was taken to measure its TSS concentration. Column 1, which had volume of 1.276 ℓ, was filled with the 1 ℓ mixed sludge sample. Before starting the pump, the sludge was allowed to settle for a few hours (usually 5 h was sufficient) so as to imitate the same condition as the UASB reactor bed. The collection vessel was filled with slightly more than the remaining Column 1 volume (> 0.276 ℓ) to prevent the pump from drawing air into the system. The peristaltic pump, pre-calibrated to the desired flow rate, was then switched on. The tee-piece on the interconnecting tube between Columns 1 and 2 was opened to vent all the air above the sludge sample. The flow rate was set such that more than 90% of the sludge mass was retained within the columns. Two different pre-determined pumping flow rates (7.08 and 10.17 ℓ/h respectively) were applied such that the upflow velocities in the last column (largest pipe) were 0.81 and 1.16 m/h respectively. These upflow velocities were 6.4 and 9.1 times higher than the maximum upflow velocity (0.127 m/h) at which the R1 system (when fed 1 500 mgSO42-/ℓ) was operated to prevent failure. The same Vup values (i.e. 0.81 and 1.16 m/h) were applied to the R2 sludge sample and these were 9.5 and 13.7 times higher than the maximum upflow velocity (0.085 m/h) at which the R2 system was operated to prevent failure - R2 was operated at a longer HRT than R1 (20.5 h against 13.5 h) for the same feed sulphate concentration (1 500 mgSO42-/ℓ) due to the slower biological activity at the lower (20ºC) temperature.
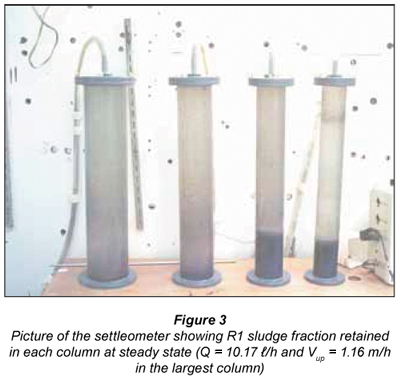
The settleometer was run for 15 h to ensure steady state was established between the settling velocities of the sludge particles and the upflow velocities in the columns. At steady state, the expanded bed height in each column was measured. The pump was then switched off. The sludge fractions present in each column were then allowed to settle for 1 to 2 h and the bed height measured before drawing all the mixed liquor from the bottom of each column via its respective drain pipe (Fig. 3). The sludge fraction, collected from each column was then mixed thoroughly and a representative sample of 50 mℓ was taken and analysed for its TSS concentration. The TSS was measured using the same analytical procedure described in Standard Methods (1985). The mass of TSS (volume x concentration) in each column and in the collection vessel was calculated. This mass was compared with the initial sludge mass added to Column 1 to check the accuracy of the results. Better than 96% mass balances was achieved in the tests.
The R1 and R2 sludges were tested on two occasions on Day 540 and Day 545. The first R1 and R2 tests were done at a flow rate of 7.08 ℓ/h through the settleometer and the second at 10.17 ℓ/h. The expanded bed heights at steady were measured only in the second test after it was concluded from the first test that bed expansion was the reactor size-governing criterion. The results for R1 and R2 sludges are listed in Tables 1 and 2 respectively.
Results
R1 sludge sample
The sludge settleability profile depicted in Fig. 4 shows the % mass of TSS retained in each column vs. upflow velocity (m/h) of that column at the 2 different flow rates applied to the settleometer.
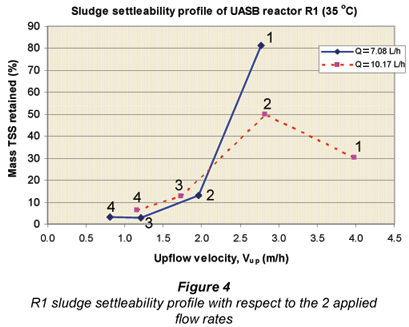
At 7.08 ℓ/h, ~ 81% of the total sludge mass settled fast enough at a Vup as high as 2.8 m/h to be retained in Column 1. At Q = 10.17 ℓ/h, only 30.5% was retained in Column 1 due to the higher Vup in the first column (smallest diameter, thus highest Vup) and sludge transfer to the subsequent columns increased with 50% being retained in Column 2. From the 10.17 ℓ/h profile curve, it is observed that ~ 80.5% (30.5% in Column 1 plus 50% in Column 2) of the total sludge mass settled fast enough at a Vup of 2.8 m/h to be retained in Columns 1 and 2, which is the same as that retained in Column 1 (81%) at 7.08 ℓ/h, giving confidence in the results obtained.
From the above, a cumulative sludge mass retained vs. settling velocity gives greater insight into the settling behaviour of the sludge (Table 1 and Fig. 5).
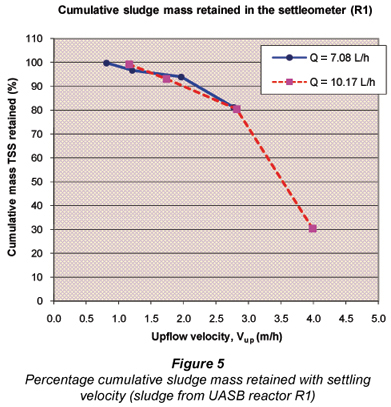
It can be seen from Table 1 (or Fig. 5) that more than 99% of the total sludge mass was retained in the settleometer at a Vup in Column 4 of 1.16 m/h implying that almost all the solids in the sludge had a very good settleability. Since the maximum Vup at which R1 was operated was 0.127 m/h, it can be deduced that the cause for sludge bed instability when the reactor was operated at a Vup > 0.127 m/h was not due to poor sludge settleability.
R2 sludge sample
Similarly, the sludge settleability profile for R2 sludge with respect to Vup was plotted (Fig. 6). At Q = 7.08 ℓ/h, only 22% of the total sludge mass settled fast enough at a Vup as high as 2.8 m/h while at Q = 10.17 ℓ/h an even smaller fraction (~9.7%) of the total sludge mass could settle at a Vup as high as 4.0 m/h. From the 10.17 ℓ/h profile, it is observed that 31% of the total sludge mass settled fast enough at a Vup of 2.8 m/h to be retained in Column 1 (10%) and Column 2 (21%) which is 10% more than retained in Column 1 at the same Vup of 2.8 m/h at 7.08 ℓ/h.
From Table 2 or Fig. 7, ~ 99% of the total sludge mass was retained in the settleometer at a Vup > 1.16 m/h indicating that R2 sludge had good settling properties similar to the R1 sludge. The maximum Vup at which R2 was operated was 0.085 m/h, which is 13 times lower than 1.16 m/h. Accordingly, it was concluded also for the R2 sludge that sludge settleability was not the cause of unstable conditions and therefore not the capacity- limiting process when both UASB reactors were operated at their respective minimum hydraulic retention times.
Bed expansion ratio
The HRT was reduced by increasing the feed flow rate: the higher the feed (and recycle) flow rate the greater the sludge bed expansion. When the reactors were operated at an HRT of lower than the minimum value (i.e. 13.5 h and 18 h for R1 when fed 1 500 and 1 800 mgSO42-/ℓ respectively, and 20.5 h for R2), the reactor sludge bed expanded above the pre-established bed height (corresponding to 6.7 ℓ for R1 fed 1 500 mgSO42-/ℓ, 7.1 ℓ for R1 fed 1 800 mgSO42-/ℓ and 7.4 ℓ for R2). Since the bed volume was maintained at a constant volume, the mass of sludge removed from the system correspondingly increased, causing a reduced sludge bed mass (and biomass sludge age) and concomitantly a reduced biomass available to mediate the BSR reactions. As a result, sulphate and VFA concentrations accumulated in the reactor until such time that the system failed, indicated by a bed separation, sludge losses in the effluent and significant increase in the effluent TSS and organic COD concentrations.
Based on the above, the effect of bed expansion on the UASB reactor performance was investigated, both in the UASB reactor itself and in the second settleometer test at 10.17 l/ℓ.
The bed expansion ratio is the bed volume (or height) at some upflow velocity over the bed volume (or height) when the upflow rate is zero.
A typical example of sludge bed expansion when R1 was fed 1 500 mgSO42-/ℓ at an HRT of 13.5 h is illustrated in Fig. 8. The BERs were 1.8 for R1 when fed both 1 500 and 1 800 mgSO42-/ℓ and 2.0 for R2.
The sludge content in each column of the settleometer for both R1 and R2 sludges was measured at their respective operating upflow velocity (Tables 1 and 2). In addition, the bed height for both Vup=0 and the operating Vup were measured in the second test on the R1 and R2 sludges at the 10.17 ℓ/h flow rate. Table 3 lists the BER results. The concentrations listed in Table 3 are the expanded bed TSS concentrations. If this concentration is multiplied by the upflow velocity, the flux in kgTSS/(m2·h) of the solids in the column is obtained, which are also listed in Table 3, as well as the corresponding results for R1 and R2 at the minimum HRT for stable operation. In Fig. 9 the BER vs. Vup for the R1 and R2 sludges in the settleometer test and the 2 UASB reactors are shown. Also shown in Fig. 9 are the expanded bed concentrations and fluxes at the different Vup.
From Fig. 9, it can be seen that the BERs for the R2 sludge (20ºC) are higher than those of the R1 sludge (35ºC) at all operating Vup values from 3.98 (Column 1) to 1.16 m/h (Column 4). The BER of the R2 sludge is arund 2.0 in Columns 1 to 3 as the expanded bed concentration increases from 2.43 to 5.91 gTSS/ℓ and Vup decreases from 3.98 to 1.73 m/h in Columns 1, 2 and 3 respectively. Interestingly, the flux, or product of the expanded bed concentration and settling velocity, of the solids retained in Columns 1 to 3 remains approximately constant at around 10 kgTSS/(m2·h) at the BER of 2.0. Only in Column 4 at the lowest Vup (1.16 m/h) is the concentration and flux very low at 0.46 gTSS/ℓ and 1.14 kgTSS/(m2·h) respectively. For the R1 sludge, the BERs are somewhat lower (1.8). However, the concentrations and fluxes are much higher in the first two columns (1 and 2) than those of the first two columns of the R2 sludge – the concentrations are 7.70 and 8.97 gTSS/ℓ and the fluxes 30.6 and 25.3 kgTSS/(m2·h), more than two times those in the first two columns of the R2 sludge. For the R1 sludge retained in Columns 3 and 4 at Vup of 1.73 and 1.16 m/h, the BER, expanded bed concentrations and fluxes decrease sharply to 1.08, 1.39 gTSS/ℓ and 2.4 kgTSS/(m2·h) in Column 3 and 1.05, 0.46 gTSS/ℓ and 0.53 kgTSS/(m2·h) in Column 4.
The hydraulic conditions in the R1 and R2 UASB reactors are also given in Table 3 and shown in Fig. 9. While the BERs are similar (~1.7) in the R1 UASB reactor and Columns 1 and 2 of the R1 settleometer test, the UASB R1 expanded bed concentration is much higher (about double, ~15.1 vs ~8 gTSS/ℓ) and the fluxes much lower (~2 vs ~30 kgTSS/(m2·h)) than Columns 1 and 2. This is probably due to the much lower upflow velocity in the R1 UASB reactor compared with those in the settleometer test – less than 1/10th of Vup in Column 4 (slowest) and 1/30th of Vup in Column 1 (fastest). Similarly, the BERs in the R2 UASB reactor and Columns 1, 2 and 3 of the R2 settleometer test are closely the same (~2), but the UASB R2 expanded bed concentration is much higher (about double, ~12.61 vs ~6 gTSS/ℓ) and the fluxes much lower (~1 vs ~10 kgTSS/(m2·h)) than Columns 1, 2 an 3. As for the R1 UASB reactor, the upflow velocity in the R2 UASB reactor also is much lower compared with those in the settleometer test – less than 1/10th of Vup in Column 4 (slowest) and 1/30th of Vup in Column 1 (fastest).
The settleometer test fractionated the R1 sludge into four parts with different settling velocities, expanded bed concentrations and fluxes, i.e. Column 1 solids with a settling velocity > 4.0 m/h, concentration = 7.70 gTSS/ℓ and flux 30.6 > kgTSS/(m2·h), Column 2 solids with a settling velocity > 2.8 m/h, concentration = 8.97 gTSS/ℓ and flux > 25.3 kgTSS/(m2·h), Column 3 solids with a settling velocity > 1.73 m/h concentration = 1.39 gTSS/ℓ and flux > 2.4 kgTSS/(m2·h) and Column 4 solids with a settling velocity > 1.16 m/h concentration = 0.46 gTSS/ℓ and flux > 0.53 kgTSS/(m2·h). This fractionation did not appear to take place in the R1 and R2 UASB reactors. The concentration depth profiles indicated that apart from a high concentration at the bottom of the reactor, the expanded bed concentration was quite uniform with depth (Part 3, Poinapen et al., 2009). The sludge bed in the UASB reactor was therefore quite uniform, probably due to the very low upflow velocity compared with the settling velocity of all the solids. The uniform sludge bed concentration in the UASB reactor was also contributed by the sludge recycle from the top to the bottom of the reactor bed to enhance sulphate reduction as soon as the feed enters the UASB reactor.
None of the expanded bed concentrations in the settleometer were as high as in the UASB reactors, but also none of the upflow velocities in the UASB reactors were as high as the slowest in the settleometer tests (only 1/10th). This means that all the solids in the UASB reactor settled faster than the slowest Vup in the settleometer test (1.16 m/h). Clearly bed expansion fixes the reactor height rather than the settling velocity of the sludge.
For maximum reactor substrate loading rates (with a fixed feed PSS and sulphate concentration), the feed flow rate was increased to its maximum value for stable bed operation and effluent quality (VFA<50 mgHAc/ℓ and sulphate < 250 mgSO42-/ℓ). This increase in feed flow rate increases the upflow velocity (Vup), which causes the sludge bed to expand. Additionally, the reactor was operated with a recycle at half the feed flow rate from the top to the bottom of the sludge bed, which further expanded the bed. While the results obtained from the laboratory UASB reactors and settleometer tests give some insight into the sludge settling velocity, bed expansion ratio, expanded bed solids concentration, flux and sludge age, the relationship between bed expansion, solids concentration, upflow velocity and sludge age may be different for different primary sludges and will need to be determined on site. It is therefore important to build sufficient flexibility into the design to deal with different bed expansion ratios, upflow velocities and sludge ages.
Conclusions
A settling device (settleometer) was designed and built to test the settleability of two sludges taken from two UASB reactors (R1 and R2) operated at 35ºC and 20ºC respectively to investigate whether sludge settleability or bed expansion in a UASB BSR reactor (fed PSS as carbon source) is the capacity limiting process of the system
It was concluded that both R1 and R2 sludges settled well. At upflow velocities below 1.16 m/h, 99% of the total sludge mass was retained. This upflow velocity was 9.1 and 13.7 times higher than the maximum operating upflow velocity of R1 (0.127 m/h) and R2 (0.085 m/h) that caused system failure (high effluent volatile fatty acids and sulphate). Because the sludge settling velocity was more than 10 times faster than the maximum upflow velocity, tests were also done to demonstrate the effect of upflow velocity on the sludge bed expansion. It was found that R1 and R2 sludges had bed expansion ratios of 1.8 at Vup of 0.127 m/h and 2.0 at Vup 0.085 m/h respectively. Since the UASB systems were operated with a constant bed volume, the mass of sludge removed from the system increases with increasing upflow rate, causing a reduced sludge bed mass and concomitantly a reduced biomass available to mediate the reactions. The cause for the progressive system failure at an upflow velocity higher than the maximum was therefore due to the sludge bed expansion rather than the sludge settleability problems. In addition, from the sludge settleability and bed expansion tests, it was deduced that R1 sludge (35ºC) had a better settleability and expanded less compared to R2 sludge (20ºC) at the same upflow velocity. Hence, this explains the shorter minimum HRT (13.5 h) obtained in R1 compared with that (20.5 h) of R2 for the same feed sulphate of 1 500 mgSO42-/ℓ.
Acknowledgements
This research was supported financially by the Water Research Commission, the National Research Foundation and the University of Cape Town and is published with their permission.
References
MOOSBRUGGER RE (1994) Settleability assessment of granular biomass from upflow anaerobic sludge bed reactors. AD94, Proc. 7th Int. Symp. on Anaerobic Digestion. 23-27 January, Cape Town, South Africa. Poster reprints. 215-218. [ Links ]
POINAPEN J, EKAMA GA and WENTZEL MC (2009) Biological sulphate reduction with primary sewage sludge in an upflow anaerobic sludge bed (UASB) reactor – Part 3: Performance at 20ºC and 35ºC. Water SA 35 (5) 543-552. [ Links ]
STANDARD METHODS (1985) Standard Methods for the Examination of Water and Wastewater (19th edn.). American Public Health Association/American Water Works Association/Water Environment Federation (APHA/AWWA/WEF), Washington DC, USA. [ Links ]
Received 13 January 2009;
accepted in revised form 31 July 2009.
*To whom all correspondence should be addressed.
+2721 650 2585; fax: +2721 689 7471;
e-mail: George.Ekama@uct.ac.za

