


Services on Demand
Article
 English (pdf)
 Article in xml format
 Article references
Indicators

Related links
-
 Cited by Google
 -
 Similars in Google
Share

 Permalink
Water SA
On-line version ISSN 1816-7950
Print version ISSN 0378-4738
Water SA vol.35 n.5 Pretoria Oct. 2009
J Poinapen, GA Ekama*; MC Wentzel
Water Research Group, Dept. of Civil Engineering, University of Cape Town, Rondebosch 7701, South Africa
ABSTRACT
The use of the conventional COD method to measure sulphide proved to be problematic due to the loss of hydrogen sulphide (H2S) during sample handling. For calibration of models based on mass balances, and operation of full-;scale systems, it was imperative to develop simple wet chemistry analytical procedures for the accurate measurement of parameters like sulphide, COD, alkalinities and VFA in order to monitor BSR systems and achieve 100% COD and S mass balances. Three different analytical methods were investigated to minimise the loss of un-;dissociated H2S. Method 1, which is the recommended Standard Methods COD test method, resulted in poor S mass balance (64-;75%) due to loss of H2S during sample handling, mainly vacuum filtration. Method 2, in which 3 drops of 10 M NaOH are added immediately upon effluent sample collection to raise the pH to > 10 and converting un-;dissociated H2S species into the HS-; species resulted in minimal sulphide loss during sample vacuum filtration, dilution, mixing and standing. Method 3, in which a polyelectrolyte is added to the effluent sample to coagulate the organic particles with centrifugation for solid-;liquid separation instead of vacuum filtration. Results from Method 3 showed an improvement in the S mass balance with respect to Method 1 -; 91% against 75% without a long sample standing period and 88% against 65% with a long sample standing period. However, S mass balance with Method 3 was still relatively low when compared with Method 2 (86 to 91% against 92 to 95%). Therefore, Method 2 was the best simple wet chemistry analytical procedure to accurately measure ST (= H2S + HS-;) and achieve close to 100% COD and S mass balances. The effects of ST loss were also investigated on the total and subsystem alkalinities as determined with the 5-;pH point titration method. By testing standard solutions with known carbonate, acetate and sulphide species and upflow anaerobic sludge bed (UASB) reactor effluent samples, it was found that the total alkalinity concentration is not affected by H2S (and CO2) loss as the subsystem alkalinities re-;speciate due to a change in pH; and to obtain accurate H2CO3* alk and volatile fatty acid (VFA) concentrations, accurate sulphide concentrations are required, i.e. those obtained from Method 2.
Keywords: biological sulphate reduction, mixed weak acid/base chemistry, titration methods, sulphide, chemical oxygen demand, volatile fatty acids, alkalinity
Nomenclature
| Alk HAc | alkalinity with respect to the HAc reference species of the acetic acid weak acid/base system excluding the water species |
| Alk H2S | alkalinity with respect to the H2S reference species of the sulphide weak acid/base system excluding the water species |
| AMD | acid mine drainage |
| AT | total acetic acid species concentration |
| BSR | biological sulphate reduction |
| C | carbon |
| CT | total inorganic carbon species concentration |
| COD | chemical oxygen demand |
| H2CO3* alk | alkalinity with respect to the H2CO3 reference species including the water species. |
| HAc | acetic acid |
| MM | molecular mass in grams |
| M | strength of reagent in moles/ℓ |
| pK'S1 | 1st dissociation constant for the sulphide weak acid base system corrected for ionic strength effects |
| PT | total ortho-;phosphate species concentration |
| PSS | primary sewage sludge |
| R1 | UASB Reactor 1 |
| R2 | UASB Reactor 2 |
| r/min | revolutions per minute |
| ST | total sulphide species concentration |
| UASB | upflow anaerobic sludge bed reactor |
| VFA | volatile fatty acids |
Introduction
In the anaerobic digestion of sulphate-;rich waters such as AMD, the accurate measurement of residual sulphate and sulphides produced is of utmost importance in order to close the sulphur loop and correct the sulphur mass balance over the system. The measurement of both sulphate and total aqueous hydrogen sulphide (ST) can be problematic. The issue of sulphate measurement in the presence of elevated concentrations of organic materials has been addressed by Ristow et al. (2005). They developed the carbonate fusion method in which the effluent sample is pretreated to remove the dissolved organic matter present thereby eliminating its interference with the spectrometer absorbance reading.
Quantifying the sulphide species in the sulphide system is fundamental in the biological reduction of sulphate-;rich waters. Firstly, with ST known, the COD and sulphur mass balances can be completed on the system. Secondly, with ST and pH measured, the un-;dissociated and dissociated sulphide species can be calculated and used to assess the effect of un-;dissociated H2S inhibition (both in growth and activity) on the system. Thirdly, the alkalinity associated with the dissociated hydrogen sulphide (HS-;) can also be determined. Fourthly, for feed organics that are carbon limited for biological sulphate reduction (BSR) the organics can donate more electrons than supply carbon for the alkalinity requirement. This applies to practically all organics (COD/TOC ratio ≥ 2.67 gCOD/gC) and the HS-;/H2S system supplies the alkalinity deficit and establishes the reactor pH. In these systems, the substrate carbon utilised can be measured via the H2CO3* alk for which accurate sulphide concentration measurements are required (Part 5 of this series currently under preparation by Poinapen and Ekama) .
The measurement of aqueous ST is based on the COD measurement as outlined in Standard Methods (1985). This method proved to be problematic due to the loss of hydrogen sulphide during sample preparation and vacuum filtration. Thus, the objective of this research was to investigate modifications to this method in order to minimise hydrogen sulphide loss during sample preparation. In addition, the effect of pH changes due to the loss of ST on system alkalinities and VFA and species distribution is explained in terms of mixed weak acid/base chemistry to give insight into the effect of analytical errors in the wet chemistry procedures. Three methods were investigated and they are described and evaluated below.
Methodology
Two similar UASB reactors designated R1 (T=35ºC) and R2 (T=20ºC) were fed sulphate-;rich water blended with primary sewage sludge (PSS) to investigate BSR under various operating conditions (see Parts 1 and 3, Poinapen et al., 2009a; b). For the purpose of this paper, only results of R1 are illustrated since the same principles apply also to R2.
Three different methods for ST measurement were investigated:
Method 1: The conventional COD method as outlined in Standard Methods (1985).
Method 2: Addition of 3 drops of 10 M NaOH to the effluent sample immediately after sample collection.
Method 3: Addition of an organic polyelectrolyte to the effluent sample to coagulate the organic particles followed by centrifugation for solid-;liquid separation.
Effluent samples (approx. 100 mℓ) were taken from the top clear water zone of the R1 UASB reactor and analysed for total COD (soluble and particulate), total soluble COD constituents and organic soluble COD, sulphate, H2CO3* alkalinity and VFA concentrations, the last 2 measurements with the 5-;pt titration method of Moosbrugger et al. (1992).
Method 1: Conventional COD method
Using the appropriate dilution, the effluent total COD was determined by the COD method outlined in Standard Methods (1985). The total soluble COD (soluble organic COD + sulphide COD) was determined on 0.45 µm vacuum filtered samples. To determine the total organic COD (sulphide removed), excess zinc sulphate (ZnSO4) was added to a 50 mℓ sample to precipitate the aqueous sulphide as zinc sulphide (ZnS). Thereafter, 3 drops of 10 M NaOH were added to increase the pH to precipitate residual Zn2+ as Zn(OH)2. The solution was then centrifuged for 5 minutes at 3500 r/min and vacuum filtered through a 0.45 µm membrane filter paper and the resulting filtrate was tested for COD to measure its organic soluble concentration. The difference between the total soluble COD and the organic soluble COD was therefore the total aqueous sulphide COD.
Method 2: Addition of 3 drops of 10 M NaOH to the effluent sample
It was suspected that sulphide gas was lost during vacuum filtration, swirling or mixing (when conducting sample dilution) and also when samples were left standing for some time (longer than 15 min). In order to prevent un-;dissociated H2S from escaping the sample, 3 drops of 10 M NaOH were added immediately after sample collection from the liquid phase of the UASB reactor. The NaOH increased the pH to greater than 10 and allowed the sulphide to be retained in the sample. The H2S changes to HS-; with the addition of NaOH. The H2S/HS-; system has a pKs1 value of 7.05 at 25ºC (Bjerrum et al., 1985) and at a pH of 10 almost all the sulphide is in the form of HS-; species with a very small proportion in the form of S2-; species (pKs2 = 12.92 at 25ºC, Lide, 2001) (Fig. 1). Neither HS-; nor S2-; species can escape from the sample since they are dissociated. After the addition of the 10 M NaOH, the same analytical and experimental procedures were carried out as outlined in Method 1 above. The total COD as well as the different soluble COD fractions of the effluent were likewise determined.

Method 3: Addition of polyelectrolyte to the effluent sample
This 3rd approach consisted of adding an organic polyelectrolyte coagulant to the effluent sample. This approach was undertaken in order to avoid vacuum filtering of the samples and to improve solid-;liquid separation in centrifugation before measuring the effluent soluble COD fractions. While the polyelectrolyte is organic it would not add to the soluble COD due to its removal with the particulate organics. A solution of the coagulant was prepared from 0.5 g of the organic polyelectrolyte in 100 mℓ of distilled water. The mixture was thoroughly mixed until a coagulant solution was obtained. Thereafter, 2 drops of this polyelectrolyte coagulant were added to a 50 mℓ effluent sample and centrifuged for 10 min at 3 500 r/min. After centrifugation, all the particulates/solids were coagulated onto the inner wall of the centrifugation tube leaving a quasi-;clear effluent solution. This clear effluent was assumed to contain no suspended solids and was thus used to determine the various soluble COD fractions as described in Method 1.
Results
Effluent soluble COD constituents
The total soluble (organic + sulphide) and sulphide COD concentrations on 3 different R1 experimental days for each of the 3 methods under study are shown below.
From Table 1, it can be seen that the total soluble COD concentration (and thus the sulphide COD) determined from Method 2 is higher than those from Methods 1 and 3. The difference between Methods 2 and 3 was not large on reactor operation Day 421 while it was more pronounced on Days 473 and 498. This is because on these latter 2 d the effluent samples treated with polyelectrolyte (Method 3) were left standing for more than 20 min before being tested for COD. Solutions containing un-;dissociated H2S at pH < 9.0 (reactor and effluent pH being ~ 7.1) are prone to H2S losses on standing and mixing during analysis steps. This explains the lower sulphide concentrations recorded for Method 3 where no vacuum filtration was conducted prior to the effluent soluble COD measurement compared with Method 2.
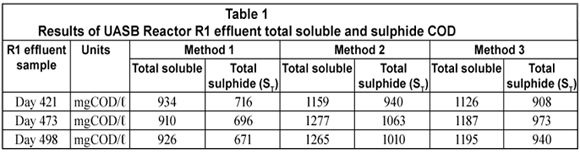
The total soluble and sulphide COD were the lowest with Method 1. These low values were due to H2S losses during sample preparation, namely dilution, mixing and standing over (as experienced in Method 3) but more importantly during vacuum filtration to separate the particulate from the soluble organics. Vacuum filtration expelled almost all the H2S present in the effluent sample because at a pH of ~ 7.1 a considerable fraction of the total sulphide (ST) is in the H2S form. Following these results, the mass of sulphur and COD leaving the reactor from each method was calculated to determine the sulphur and COD mass balances.
Mass balances
In the S balance, the H2S gas concentrations from the headspace of the reactor measured with the phenanthroline method were found to be negligible with concentrations ranging from 0.4 to 1.0 mgS/ℓ of influent (mean = 0.7 mgS/ℓ) and masses of between 0.003 and 0.01 mgS/d (mean 0.007 mgS/d). Moreover, from waste sludge analysis, elemental sulphur concentration in the sludge mass wasted per day was about 2% of the total sulphur mass passing through the system per day. Using the ST measurements shown in Table 1 and the H2S gas masses, the COD mass balance was conducted while for the S mass balance, the mass of the elemental sulphur was also considered. These mass balances are listed in Table 2.
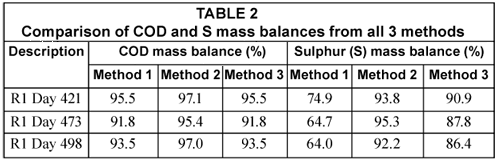
Table 2 shows the COD mass balance based on the total effluent COD of the UASB reactor R1 determined from all 3 methods under investigation. For Methods 1 and 3, the same effluent sample is used in the COD test (after the appropriate dilution) to determine the total effluent COD. As expected, both methods resulted in the same total effluent COD and therefore the same COD mass balances. In Method 2, in which 3 drops of NaOH are immediately added to the sample to prevent H2S loss, the COD mass balance is better (97.1%). The difference in COD mass balance between Method 2 and the others is due to the H2S loss during dilution, mixing and standing of the effluent samples before testing. This is also reflected and confirmed in the sulphur mass balance. The S mass balance in Method 2 is higher than that in Methods 1 and 3. These differences were a direct consequence of reducing H2S losses in the analytical steps of the methods. It can be seen that the loss of H2S during vacuum filtration is particularly significant. Moreover, the 92 to 95% S mass balance obtained in Method 2 shows that Method 2 is reliable in fixing the S mass balance close to 100%. It can therefore be concluded that Method 2 (i.e. the addition of drops of NaOH immediately after effluent sample collection) is a better analytical method when vacuum filtering samples and also avoids H2S loss with samples standing over. The close to 100% S balance shows that the loss of H2S takes place only during vacuum filtration and sample preparation (swirling, mixing and standing over) and not in the COD test itself. The COD test immediately oxidises all sulphide to sulphate upon addition of the sulphuric acid. This was tested with sulphide standard solutions.
To further validate Method 2 (raising the sample pH with NaOH before vacuum filtration), 2 standard hydrogen sulphide ST solutions with known concentrations were made up using sodium sulphide (Na2S.9H2O). The 2 standard solutions were made up by dissolving in 1 ℓ distilled water 3.030 g and 4.503 g of Na2S.9H2O (MW = 240 g) respectively. These standard solutions were checked with independent Na analysis and found to conform within 1%. The solutions were gently mixed until the entire compound dissolved. These solutions had therefore a total sulphide (ST) concentration of 404 mgS/ℓ and 600 mgS/ℓ respectively. The pHs of the solutions were as high as 11.93 and 12.16 respectively. At these high pH values, the sulphide species were in the HS-; and S2-; forms (H2S species ~ 0.003 mgS/ℓ). So there was no need to raise the pH with NaOH. A sample of each of the standard ST solution was vacuum filtered through 0.45 µm membrane filter paper and ST measured in the COD test. For these standard sulphide solution COD tests, it was not necessary to boil the samples – they could be titrated after cooling from the H2SO4 addiction and yield the standard COD concentration. This confirmed that the H2S oxidation in the COD test is very rapid upon addition of the H2SO4resulting in negligible H2S loss in the COD test itself.
In another sample of the ST standard solution (ST = 600 mgS/ℓ), relatively weak hydrochloric acid solution (Normality = 0.067) was added drop-;wise and very gently stirred until the pH was 7.13. The solution pH was therefore similar to that of the UASB effluent samples. This solution was then subjected to the same analytical procedures as for the UASB reactor and effluent COD samples, i.e. its COD was measured with standard COD test (Method 1) and Method 2 (addition of 3 drops of NaOH). The results of the COD tests done on various concentrations of Na2S.9H2O solution both at high and low pH values are tabulated in Table 3.
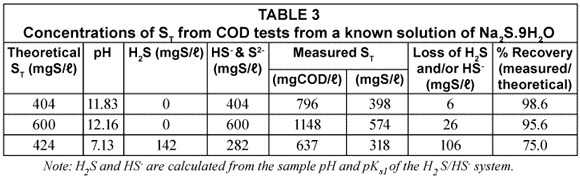
From Table 3, it can be seen that the measured ST at high pH is very close to the standard value (96 to 99% recovery) confirming that no sulphide species are lost in the COD test itself even at ST concentration as high as 600 mgS/ℓ. This was checked by placing tissue paper moistened with ferric chloride (FeCl3) solution over the COD flasks with sulphuric acid addition and over the outlets of the COD test condensers – if H2S gas escaped during these steps, black spots would have formed on the filter paper -; none were noted. The absence of H2S loss from the COD test is probably due to the very rapid reaction between the potassium dichromate and sulphide, complete virtually immediately after adding the sulphuric acid. For the standard solution at low pH, the measured ST is only 75% of the theoretical ST indicating a loss in vacuum filtration and during sample preparation. This shows the importance of increasing the sample pH with NaOH to change all the sulphide to the HS-; form.
From the above, it can be concluded that at high pH (≥10.0), there is negligible loss in ST during vacuum filtration while at low pH (7.13), there is considerable loss (~ 25%) in ST. Moreover, the 96 to 99% ST recovery at high pH proves there is negligible sulphide (≤ 4%) loss in the COD test itself.
Alkalinity and volatile fatty acids (VFA) measurement in a mixed weak acid/base system
The measurement of alkalinity and VFA in a mixed weak acid/base system with sulphide species present can also result in error if the usual methods are applied without due consideration. In this research, alkalinity (H2CO3* alk) and VFA were measured using the 5-;point titration (Moosbrugger et al., 1992). The 5 pH point titration programme calculates the inorganic carbon alkalinity (H2CO3* alk) and the VFA concentration as separate outputs. The calculation procedure caters for the presence of sulphide (ST as mgS/ℓ). Should the sample contain ST, this value needs to be entered into the calculation procedure in order to determine the H2CO3* alk (mg/ℓ as CaCO3) and the VFA concentration (mgHAc/ℓ) correctly. Since ST measurement was problematic and inaccurate (at the beginning of this investigation up to day 205), it was expected that the alkalinity and VFA measurements would also be affected and inaccurate. Accordingly, the effect of H2S loss in the vacuum filtration during sample handling on the total alkalinity, H2CO3* alk, Alk H2S and VFA (and Alk HAc) was investigated.
Some basic aquatic chemistry concepts on alkalinity in a mixed weak acid/base system
The effluent under investigation was made up of a mixture of weak acid/base subsystems, viz. carbonate (via the CO2 production), ammonium (via the NH4+ production from the N content of the PSS), phosphate (via the total phosphorus, PT present in the raw PSS), acetate (via the VFA generated from the hydrolysis of the PSS), sulphide (via the reduction of SO42-;) and water. Because the total phosphorus (PT) concentration of the feed and the effluent was very low (~ 10 mgP/ℓ) compared with the other weak acid/base species concentrations, its effect on the total alkalinity, H2CO3* alk and VFA was negligible. Hence zero was entered for PT in the 5-;pt titration programme – entering PT = 10 mgP/ℓ made negligible difference to the results. Because the pK value of ammonia (NT) at 9.1 is 2 pH units above the sample pH values, and the NT concentration very low compared with CT, ST and AT, the total inorganic nitrogen (ammonia) species concentration (NT) has no influence on the calculation of the H2CO3* alk and VFA concentrations, i.e. the NH4+ alkalinity at pH 7.1 is zero (0). Therefore, the carbonate, sulphide and acetate subsystems largely dominated the weak acid/base chemistry and pH of the system and for simplicity, the phosphate and ammonium systems were not considered further in this investigation. The total alkalinity was therefore the sum of the H2CO3* alk (including the water system), the Alk HAc and the Alk H2S (each excluding the water system). The theoretical alkalinity equation for the 3 above subsystem alkalinities can be formulated from a proton balance equation (Loewenthal et al., 1989; 1991). Each subsystem forms a reference state (or equivalent solution) from which a reference level alkalinity equation can be developed, namely:
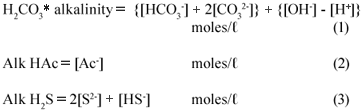
The total alkalinity is therefore the sum of the individual subsystem alkalinities.

Rearranging with the individual species gives:

In the equations above, the nomenclature of Loewenthal et al. (1989) has been followed where alkalinity preceding the reference species (Alk H2S) excludes the water system whereas alkalinity following the reference species (H2CO3* alk) includes the water system.
Effect of H2S loss on the total and subsystem alkalinities
Since by definition, Alk H2S = 2[S2-;] + [HS-;], the [H2S] does not affect the alkalinity. Therefore, H2S loss during vacuum filtration causes no effect on the Alk H2S. Similarly, the total alkalinity will not be affected. The same applies to the carbonate (inorganic carbon) system – CO2 loss does not affect the H2CO3* alkalinity). In order to demonstrate this, the UASB effluent samples and standard solutions were analysed for alkalinity concentrations of all 3 subsystems (H2CO3* alk, Alk HAc and Alk H2S). Analytical Methods 1 and 3 were conducted to investigate the effect of H2S loss during vacuum filtration and sample handling on the effluent VFA and alkalinity concentrations (total, H2CO3* alk and Alk H2S). Method 2 was not used because the NaOH added increases the alkalinity and this additional complexity was avoided for the alkalinity measurement part. Effluent samples were again taken from the liquid phase of the UASB reactor R1 and analysed for their alkalinities and VFA concentrations using Methods 1 (vacuum filtration with no NaOH addition for solid-;liquid separation) and 3 (centrifugation with polyelectrolyte addition for solid-;liquid separation). The results of these analyses are shown below in Tables 4 and 5. These tests were also done with standard ST, CT and AT solutions which are described later.
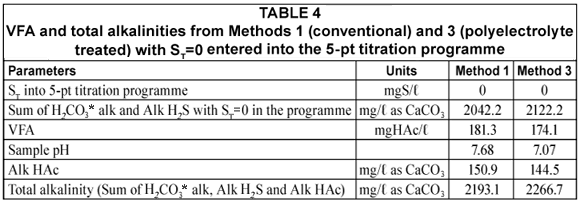
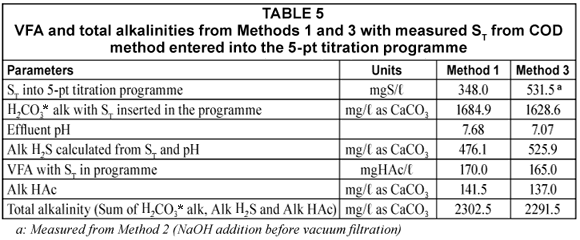
Table 4 shows that the total system alkalinity and VFA measured from samples prepared from either Method 1 or 3 are almost similar (3% difference). This confirms that H2S loss during sample preparation (namely vacuum filtration) does not affect the total system alkalinity. However, from Table 5, it can be seen that the subsystem alkalinities are affected by the loss of H2S. H2S loss causes a decrease in the total sulphide (ST) but increases the sample pH such that the loss of H2S would result in a lower H2S/HS-; ratio, as per the equations below.

where:

This increase in pH does not change the total system alkalinity (i.e. the sum of H2CO3* alk, Alk H2S and Alk HAc) but it does change the individual subsystems alkalinities, i.e., H2CO3* alk, Alk H2S and Alk HAc. This phenomenon is called 're-;speciation' of the individual subsystem species and alkalinities and is described below.
With the loss of H2S, the sample pH increases, for instance:
Before vacuum filtration, ST1 = [H2S](1) + [HS-;](1) and sample pH = 7.07
After vacuum filtration, ST2 = [H2S](2) + [HS-;](2) and sample pH = 7.68
ST2 < ST1 (ST1 -; ST2 = loss of H2S during vacuum filtration)
However, [HS-;](2) is lower than [HS-;](1), as illustrated in the log species-;pH diagram at the 2 pHs established (Table 6 and Fig. 1).

Table 6 shows the pH and sulphide species distribution before and after vacuum filtration. Particularly striking here is the decrease in [HS-;] concentration at the pH established after vacuum filtration. In other words, the [HS-;] concentration at pH 7.68 (after vacuum filtration) is slightly lower than that before vacuum filtration (at pH 7.07) (Fig. 2). For simplicity, only the H2S/HS-; system is illustrated in Fig. 2, since at a pH of 7.07 and 7.68, the HS-;/S2-; system is not relevant because the [S2-;] is negligible.

This decrease in Alk H2S in mixed weak acid/base systems is not obvious from the principle that H2S (the reference species) loss does not change Alk H2S. However, this principle holds only if H2S (or any other weak acid/base system) is the only weak acid/base system in water. For mixed weak acid/base systems, loss of one or more reference species does not change the total system alkalinity, but does change the individual subsystem alkalinities, including the alkalinities of the system(s) which have lost reference species. This is demonstrated below.
Considering a single weak acid/base system only such as the sulphide system in water, the total alkalinity is given by:

The loss of H2S gas from this system (sulphide system only in water) does not affect the H2S alk, which is equal to the total alkalinity of the system.
Similarly for the carbonate system (H2CO3/HCO3-;/CO32-;) only in water, the total alkalinity is the same as the H2CO3* alk, given by:

Accordingly, the loss of CO2 from the carbonate system does not affect the H2CO3* alk.
Now, considering the mixed weak acid/base system with all the subsystems (carbonate, sulphide, acetate and water) present in the UASB BSR system, the loss of H2S and CO2 should likewise not decrease the system total alkalinity since by definition, these species (i.e. [H2S] and [CO2] do not appear in the equation (Eq. (5)). However, the loss of H2S and CO2 does change the subsystem alkalinities making up the total, and the sample pH. This change in pH will in turn affect the relative proportion of the various species of the individual subsystems. For instance, the loss of H2S (and CO2) during vacuum filtration causes the pH to increase from 7.07 to 7.68 thereby re-;speciating the H2S/HS-; species of the sulphide subsystem, the H2CO3/HCO3-;/CO32-; species of the carbonate subsystem and the HAc/Ac-; species of the acetate subsystem. This re-;speciation of the individual subsystem species changes the individual subsystem alkalinities but the system total alkalinity remains unchanged.
Considering the sulphide subsystem and analysing the changes with loss of H2S (and consequent sample pH) gives more insight into the phenomenon of re-;speciation and its effect on subsystem alkalinity (Fig. 2).
At pH 7.07 and ST = 531.5 mgS/ℓ, the [HS-;] = 336.6 mgS/ℓ and [H2S] = 194.9 mgS/ℓ;
Alk H2S = [HS-;] = 525.9 mg/ℓ as CaCO3.
After vacuum filtration and sample handling, the pH increases to 7.68 due to the loss of H2S and ST = 348.0 mgS/ℓ. The new [HS-;] = 304.7 mgS/ℓ and [H2S] = 43.3 mgS/ℓ;
Alk H2S = 476.1 mg/ℓ as CaCO3.
From the above, there is a loss in Alk H2S when moving from pH 7.07 to 7.68 even though one expects the concentration [HS-;] to increase at a higher pH (7.68) to keep the total alkalinity constant. Had sulphide been the only system in the sample, this would have been the case. However, in a mixed weak acid/base system, the other subsystems present (in this case the carbonate and acetate subsystems) compensate for the loss of one subsystem alkalinity by re-;speciation of their individual species to maintain the system total alkalinity unchanged. Accordingly, both the H2CO3* alk and Alk HAc concentrations increase to compensate for the lower Alk H2S (Table 6). To illustrate these changes in subsystem alkalinities, the relevant alkalinity-;acidity-;pH equilibrium diagrams with the total species concentration are shown in Figs. 2 to 4.

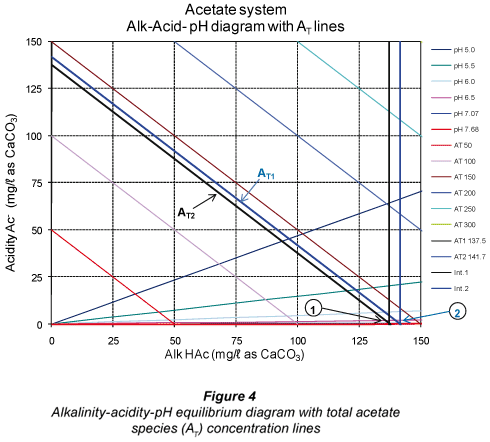
In Figs. 2 to 4, Point 1 indicates the concentrations of the subsystem alkalinity and acidity and the total subsystem species (all in mg/ℓ as CaCO3) for the pH 7.07, that is before vacuum filtration. Likewise, Point 2 indicates the new concentrations at the new pH 7.68 established after vacuum filtration. It can be seen that the subsystem alkalinities change with the change in pH after vacuum filtration, with H2CO3* alk and Alk HAc increasing and Alk H2S decreasing. However, the net effect of these changes keeps the sum of the 3 subsystem alkalinities (= total alkalinity) unchanged (Table 5). This phenomenon of re-;speciation of subsystem alkalinities takes place in mixed weak acid/base systems (Loewenthal et al., 1989). Therefore, interpretation of subsystem alkalinities should be made with the correct understanding of subsystem species redistribution with changes in pH. This is in fact what the 5-;pH point titration method is based on and shows the importance of entering the correct ST value into the 5-;pH point titration programme to obtain the correct H2CO3* alk and VFA concentrations. This underlines the importance of obtaining accurate ST values from the experimental systems in order to obtain accurate H2CO3* alk and VFA concentrations. The small change in AT (from 137.5 to 141.7 mg/ℓ as CaCO3 in Fig. 4) is due to experimental error in the titration procedure.
An observation from Fig. 3 is that CT (at Point 1 in Fig. 3) also decreases due to loss of CO2 during vacuum filtration. From the post filtration pH and H2CO3* alk, the new CT (CT line at Point 2 in Fig. 3) can be determined and the loss of CO2 due to vacuum filtration quantified.
Apart from validating that the total alkalinity remains constant when adding or losing a reference species to a mixed weak acid/base system, it also drew attention to specific points in the sample collection, handling and analyses procedures to obtain accurate results, namely:
- Accurate sulphide (ST) concentrations must be entered into the 5-;pH point titration programme to obtain accurate H2CO3* alk and VFA concentrations
- Sulphide loss in the sulphide determination with the COD test must be minimised by immediately raising the pH above 10 at sample collection. Then the sample can be vacuum membrane filtered.
- Once ST is accurately known, H2S and CO2 loss during sample standing, vacuum filtration and the 5-;point titration method does not affect the accuracy of the results.
From the above, it is only for the accuracy of the ST determination with the COD test that H2S loss has to be avoided. CO2 loss at any stage of the analysis procedure does not affect the results because the 5-;point titration is in fact conducted to characterise the carbonate system with the H2CO3* alk (which is not affected by CO2 loss) taking due consideration of the presence of the other weak acid/base systems.
Attempt to develop a 7-;pH point titration procedure for estimating ST
To possibly obviate measuring H2S with the COD test, an attempt was made to estimate ST from a 7-;pH point titration method using a standard solution of sulphide prepared from Na2S.9H2O. During the titration procedure, on addition of the HCl acid, H2S gas escaped from the sample even though maximum precaution was taken during gentle stirring of the sample and acid addition. It seems to be practically unfeasible to prevent the loss of H2S from the sample during titration, because the acid added will decrease the pH to lower than the first pK value of the sulphide system (pKs1 H2S/HS-; = 7.05 at 25ºC). Lowering the pH due to acid addition will increase the H2S concentration with respect to the HS-; concentration and inevitably result in H2S species escaping from the sample even with very gentle stirring. As a consequence, ST is decreased during the titration and so will be incorrectly estimated by the programme. The ST concentration was also measured using the COD test (with Method 2 approach) and was found to be about 40% less at a pH of 6.7 (after acid addition) than the original ST (ST in the standard solutions prepared with initial pH 12.1) giving additional evidence of H2S loss during the titration procedure. It was concluded that STt would have to be determined separately by the COD test as explained in Method 2 (NaOH treated) above. With 4 mixed weak/acid base systems (sulphide, carbonate, acetate and water), 4 measurements are required to speciate the water – usually ST for sulphide, pH for water, H2CO3* for carbonate and VFA for acetate, the last 2 measurements with the 5-;pt titration method. Because this approach (whether 5-; or 7-;pt) allows only one unknown system to change during the titration, this could be either the carbonate or the sulphide, but not both. The 5-;pt titration programme could be modified to determine the sulphide and VFA concentrations, but then the total inorganic carbon concentration would need to be known. This can be done by inorganic carbon analyser, but this defeats the objective of developing simple and inexpensive wet chemical methods for operation and control of anaerobic systems.
Conclusions
This paper describes the reasons for poor COD and sulphur mass balances due to sulphide loss during vacuum filtration of the UASB reactor effluent samples. Three analytical methods were investigated to minimise the loss of un-;dissociated H2S during sample preparation (viz. vacuum filtration, dilution, mixing and sample standing). Method 1 which is the Standard Methods (1985) COD test method resulted in poor S mass balance (64 to 75%) due to loss of H2S during sample preparation, mainly vacuum filtration. The total effluent COD concentration measured on unfiltered effluent samples (i.e. no vacuum filtration) also indicated a loss in H2S during sample dilution, mixing and standing as shown by the relatively lower COD mass balance (~ 92%). Method 2, in which 3 drops of 10 M NaOH are added immediately upon effluent sample collection to raise the pH to >10 retains all the sulphide by converting the un-;dissociated H2S into the HS-; species. In so doing, minimal sulphide is lost during sample handling including vacuum filtration. Results of the COD and S concentrations obtained from the COD test based on Method 2 showed a marked improvement in the COD and S mass balances (97% and 92 to 95% respectively). Method 3, in which a polyelectrolyte is added to the effluent sample to improve solid-;liquid separation with centrifugation and so avoid the vacuum filtration step did improve the S mass balance with respect to Method 1 (91% against 75% without long sample standing time and 88% against 65% with long sample standing time). However, S mass balance with Method 3 is still low when compared with Method 2 (86 to 91% against 92 to 95%). Method 2 (samples treated with NaOH to prevent loss of H2S) is therefore recommended to accurately measure ST and achieve close to 100% COD and S mass balances.
In addition, attempts were also made to investigate the effects of pH changes due to sulphide loss on system alkalinities and species distribution as determined with the 5-;pH point titration method. For this procedure, H2S (and CO2) loss does not influence the accuracy of the results provided accurate ST (from Method 2) concentration is entered into the titration calculation procedure. Entering inaccurate ST concentrations will not affect the accuracy of the total alkalinity but the subsystem alkalinities and VFA concentrations will be incorrect. With accurate H2CO3* alkalinity concentration measurement, the opportunity exists for measuring the carbon content of the biodegradable organics. Most organics are carbon deficient for biological sulphate reduction in the sense that they can donate more electrons than supply CO2 for the alkalinity change.
All the CO2 released from the utilisation of organics therefore remains in solution as HCO3-; and can be measured with the 5-;pt titration method allowing the C mass balance to be closed without the complexity of gas flow and composition measurement with methanogenic systems (results will be presented in Part 5, currently in preparation by Poinapen and Ekama).
To investigate measuring the sulphide also with the titration procedure, development of a 7-;pt titration method was explored. The titration principle requires that only one unknown subsystem total species concentration changes during the titration. Both H2S and CO2 loss were observed to be significant during titration so either the total inorganic carbon or the sulphide is required for accurate results from this approach. Because a simple wet chemical method exists for the total sulphide via the COD, the 5-;pt titration method (Moosbrugger et al., 1992) in its current form is best.
Acknowledgements
This research was supported financially by the Water Research Commission, National Research Foundation and University of Cape Town and is published with their permission.
References
BJERRUM J, SCHWARZENBACH G and SILLÉN LG (1985) Stability Constants. Chemical Society, London. [ Links ]
LIDE D (2001) CRC Handbook of Chemistry and Physics (82nd edn.) CRC Press, Boca Raton, FL. [ Links ]
LOEWENTHAL RE, EKAMA GA and MARAIS GVR (1989) Mixed weak acid/base systems, Part 1: Mixture characterisation. Water SA 15 (1) 3-;24. [ Links ]
LOEWENTHAL RE, WENTZEL MC, EKAMA GA and MARAIS GVR (1991) Mixed weak acid/base systems, Part II: Dosing estimation, aqueous phase. Water SA 17 (2) 107-;122. [ Links ]
MOOSBRUGGER RE, WENTZEL MC, EKAMA GA and MARAIS GvR (1992) Simple Titration Procedures to determine H2CO3* Alkalinity and Short Chain Fatty Acid Concentrations in Aqueous Solutions containing known Concentrations of Ammonium, Phosphate and Sulphide Weak Acids/Bases. WRC Report No. TT 57/92. Water Research Commission, Pretoria, South Africa. [ Links ]
POINAPEN J, WENTZEL MC and EKAMA GA (2009a) Biological sulphate reduction with primary sewage sludge in an upflow anaerobic sludge bed (UASB) reactor – Part 1: Feasibility study. Water SA 35 (5) 525-;534. [ Links ]
POINAPEN J, EKAMA GA and WENTZEL MC (2009b) Biological sulphate reduction with primary sewage sludge in an upflow anaerobic sludge bed (UASB) reactor – Part 3: Performance at 20ºC and 35ºC. Water SA 35 (5) 543-;552. [ Links ]
RISTOW NE, SÖTEMANN SW, WENTZEL MC, LOEWENTHAL RE and EKAMA GA (2005) Sulphate measurement in organic-;rich solutions: Carbonate fusion pretreatment to remove organic interference. Water SA 31 (2) 267-;270. [ Links ]
STANDARD METHODS (1985) Standard Methods for the Examination of Water and Wastewater (19th edn.) American Public Health Association/American Water Works Association/Water Environment Federation (APHA/AWWA/WEF), Washington DC, USA. [ Links ]
Received 13 January 2009; accepted in revised form 31 July 2009.
* To whom all correspondence should be addressed
+2721 650 2585; fax: +2721 689 7471
e-;mail: George.Ekama@uct.ac.za

