Services on Demand
Article
Indicators
Related links
-
 Cited by Google
 -
 Similars in Google
Share
Water SA
On-line version ISSN 1816-7950
Print version ISSN 0378-4738
Water SA vol.35 n.4 Pretoria Jul. 2009
Heterotrophic plate count vs. in situ bacterial 16S rRNA gene amplicon profiles from drinking water reveal completely different communities with distinct spatial and temporal allocations in a distribution net
MM BurtscherI, §; F ZibuschkaII; RL MachI; G LindnerII; AH FarnleitnerI, *
IInstitute of Chemical Engineering, Research Area of Applied Biochemistry and Gene Technology, Research Group Environmental Microbiology and Molecular Ecology, Vienna University of Technology, Getreidemarkt 9/166-5, A-1060 Vienna, Austria
IIInstitute for Water Provision, Water Ecology and Waste Management, Department for Sanitary Engineering and Water Pollution Control, University of Agricultural Sciences, Muthgasse 18, A-1190 Vienna, Austria
ABSTRACT
Heterotrophic plate count using ISO 6222 agar (HPC) vs. in situ bacterial (DF) community structure from corresponding samples of a drinking water distribution system were investigated by 16S rRNA gene-based polymerase chain reaction denaturing gradient gel electrophoresis (PCR DGGE) profiling. The investigation regime covered 10 different sampling locations and 2 points in time (t1, t2). In order to ensure accurate and reproducible 16S rRNA gene profile analysis, rigorous methodical evaluation and standardisation procedures were undertaken (DGGE optimisation, replication of PCR, multiple-lane standardisation, representative sampling volume determination, application of multiple similarity coefficients). The reproducibility level of the profile analysis was determined to be > 90% similarity. Two completely different communities were revealed from HPC vs. DF as indicated by DGGE analysis and sequencing. HPC populations could be identified as ubiquitously occurring cultivable copiotrophic microbes, whilst most DF sequences could be allocated to sequences from microorganisms found in oligotrophic aquatic environments. Spatial- and temporal-based 16S rRNA gene amplicon profile analysis from recovered communities further revealed contrasting results. As proven by Jackknife simulations, DF profiles remarkably corresponded to sampling time, whereas HPC profiles revealed spatial associations within the distribution system. Recovered data demonstrate that cultivation based HPC vs. direct cell-based investigations can result in completely different results if used for monitoring purposes in distribution systems.
Keywords: heterotrophic plate count (HPC), in situ bacterial 16S rRNA gene population screening, bacterial cultivation vs. direct detection, PCR DGGE, drinking water, distribution system
Introduction
The heterotrophic plate count (HPC), originally developed in 1881 by Robert Koch, was one of the first techniques for drinking water analysis (Koch, 1893). Since then, determination of HPC has been in use and recommended as a monitoring tool for a general microbial water quality assessment. In principle, HPC recovers all organisms which can grow and form visible colonies on complex nutrient-rich media (e.g. peptone and meat extract) at a given temperature and incubation time (e.g. 22°C and 72 h). In most cases, the number of colonies growing under these conditions constitutes only a small cultivable copiotrophic fraction of the microbial population in water. Recently, the significance of the cultivation-based HPC has been under discussion since new direct cell-targeting microbiological and molecular biological tools are capable to determine the in situ population of water. Studies comparing classical microbiological parameters with molecular biological techniques show that only a minute fraction (in many cases <1%) of the planktonic as well as biofilm microbial population can be cultivated by standard HPC procedures regardless of the method applied (McCoy and Olson 1986; Amann et al., 1995; Watkins and Xiangrong, 1997; Hammes et al., 2008). Nevertheless HPC is still considered a useful tool by national and international authorities to obtain information about:
• The efficiency of drinking water treatment processes (WHO, 2002)
• Microbial water quality changes in finished water during distribution and storage, such as contamination by impure water (Sartory, 2004; WHO, 2002)
• Microbial regrowth and after-growth events (WHO, 2002)
Some members of the HPC population are suspected opportunistic pathogens for immune-compromised individuals (Pavlov et al., 2004), possess regrowth potential or are plainly associated with nuisance activities (Payment et al., 1988; Rusin et al., 1997; Van der Kooij, 2002). Information about HPC population structure and taxon composition has mainly been recovered by pure culture-based procedures (e.g. Reasoner, 1990; Edberg et al., 1997; Farnleitner et al., 2004). Such an approach gives a high taxonomic resolution but often demands a practically unfeasible number of pure cultures to cover spatial and temporal distribution system variability (Edberg et al., 1997; Kalmbach et al., 1997; Norton and LeChevallier, 2000). Thus only very limited information about the HPC community structure dynamics in defined distribution systems is available to date (Berry et al., 2006), although knowledge on population composition in respect of the given system conditions is likely to contribute to a better understanding of the applicability of the HPC indicator concept. Molecular biological techniques offer new high-resolution and high-throughput tools to further investigate HPC populations and furthermore to compare them to the respective in situ bacterial communities (Vives-Rego et al., 2000; Dewettinck et al., 2001; Farnleitner et al., 2004; Hoefel et al., 2005; Martiny et al., 2005, Farnleitner et al 2005b). Preliminary investigations suggested that HPC population dynamics in a drinking water distribution system can be resolved by a polymerase chain reaction denaturing gradient gel electrophoresis (PCR DGGE) approach in respect of sampling location and sampling time. Moreover, 16S rRNA gene amplicon profiles recovered from HPC populations can easily be compared with corresponding profiles recovered from the in situ bacterial community (Farnleitner et al., 2004). However, it is of critical importance to consider the achievable methodical discrimination capacity and reproducibility of the PCR DGGE approach when higher numbers of samples are to be analysed (Farnleitner et al., 2004; Fromin et al., 2002).
The aim of this study was the detailed investigation of the HPC vs. the in situ bacterial community structure in water samples recovered from different sampling points in a drinking water distribution system by the above-mentioned 16S rRNA gene PCR DGGE profiling approach. Appropriate discrimination capacity for the spatial and temporal PCR DGGE profile analysis was assured by comprehensive standardisation and evaluation procedures.
Materials and methods
Sampling and sample processing
Sampling was performed during 2 consecutive months (7 August 2003; 18 September 2003) alongside a complex water distribution pipe at 10 different (S1 - S10) sampling stations. Distances between sampling locations varied from several hundred meters up to a few kilometres and sampling was carried out according to common standard procedures (Standard Methods, 1995). Chemo-physical parameters of the investigated drinking water, measured at both sampling dates at sampling locations S1, S6 and S10, showed only small variations (n = 6). In general, the chemo-physical quality revealed a soft water well saturated with oxygen; temperature was in the range of 14.5 to 15.7°C, pH 7.5 to 8.1, electric conductivity 253 to 295 µS/cm, ammonium <0.02 to 0.1 mg/ℓ, nitrite <0.01 to 0.02 mg/ℓ, nitrate 3.0 to 4.0 mg/ℓ, total hardness 5.2 to 6.4°dH, iron <0.03 to 0.05 mg/ℓ, manganese <0.01 to 0.03 mg/ℓ, chloride 25 to 26 mg/ℓ, sulphate 18 to 20 mg/ℓ and dissolved oxygen 9.2 to10.3 mg/ℓ. Immediately before sampling site S0 a ClO2 disinfection facility is located. Detectable ClO2 concentrations ranged from 0.06 mg/ℓ up to 0.10 mg/ℓ at sampling Site S0 but were not detectable at sampling Sites S10 and S6.
HPC cultivation was performed by membrane filtration in order to easily obtain total DNA extracts from all colonies growing on the membrane surface. Cellulose nitrate membrane filters (45 mm diameter, 0.45 µ pore size, Sartorius, Vienna, Austria) were placed on ISO 6222 conform Yeast Extract Agar (YEA, Merck, Darmstadt, Germany (ISO 1998)), and incubated at 22°C for 48 h. After documentation of the colony-forming units (CFU), filters, containing the HPC colonies, were rolled, put into sterile cryo-vials (Simport Plastics, Quebec, Canada) and stored at –80°C until use. Filtration of increasing volumes (1, 10, 50 mℓ) was applied to check for adequate sampling volumes (Farnleitner et al., 2001) and 50 mℓ filtration volume was used for further analysis.
For the corresponding non-cultivation-based direct filtration (DF) analysis of the bacterial in situ community, water was filtered through polycarbonate membrane filters (IsoporeTM, 45 mm diameter, 0.2 µ pore size, Millipore Corp. Bedford, MA); filters were stored in sterile microcentrifuge tubes (Eppendorf, Austria) at –80°C. The filtration volume was set to 500 mℓ and 1 ℓ after reproducibility tests with increasing volumes from 240 mℓ to 5 200 mℓ. Total bacterial cell numbers (BN) were determined from formaldehyde fixed samples (2% w/v) by epifluorescence microscopy using diaminophenyl indole (DAPI) fluorescent dye, as described in detail by Kirschner et al. (1999).
DNA extraction, PCR amplification and DGGE analysis
DNA from stored cellulose nitrate membrane filters (HPC) and polycarbonate membrane filters (DF) was extracted applying mechanical disruption (bead beating), phenol, chloroform and CTAB extraction as previously described (Griffiths et al., 2000). Bead beating was performed on a FastprepTM EP120 (Bio 101 Inc. Vista, CA) level 6 for 30 s. Replicate extracted DNA was tested under different speed levels (level 4, 5, 6 and 30 s and 60 s) and resulted in corresponding DGGE patterns showing best profile resolution at settings described above (data not shown). Extracted DNA was subsequently checked by agarose gel electrophoresis (Ausubel et al., 1994).
For PCR the variable V3 16S rRNA gene fragment (Ovreas et al., 1997; Farnleitner et al., 2001) primers PRBA 338f (5'-ACT CCT ACG GGA GGC AGC AG- 3') and PRUN 518r (5'-ATT ACC GCG GCT GCT GG- 3') were used. The short V3 region was selected because of the low tendency to form chimeric molecules using beat beating procedures but still enabling high population resolution capacity (Farnleitner et al., 2001; Farnleitner et al., 2004; Hoefel et al., 2005). In addition, a GC-rich sequence (5'-CGC CCG CCG CGC GCG GCG GGC GGG GCG GGG GCA CGG GGG G- 3') was attached to the 5'end of the forward primer for subsequent DGGE analysis (Muyzer et al., 1993; Rusin et al., 1997). For HPC community extracted DNA triplicate PCR reactions were performed using 10–1, 10–2, 10–3 DNA template dilution steps. Duplicate PCR reactions were performed for undiluted DF DNA extracts. PCR analysis from DF DNA extracts were also performed at 10–1, 10–2, 10–3 DNA template dilutions, but did not yield any PCR product at the respective dilutions, except for higher volumes (>2 ℓ). The PCR was performed in a total volume of 50 µℓ including 1'PCR reaction buffer (Promega corporation, Madison, WI), 1.5 mM MgCl2 (Promega), 100 µM of each deoxynucleoside triphosphate (Boehringer Mannheim, Vienna, Austria), 300 ng/µℓ BSA (Boehringer Mannheim), 100 nM of each primer, DNA templates, water and 0.5 U of Taq DNA Polymerase (Promega). PCR amplification was performed in an iCycler IQTM System (Biorad) running the following protocol: after a hotstart and an initial denaturation step at 94°C for 4 min 30 Standard PCR cycles, followed by a final extension at 74°C for 3 min were run; denaturation, annealing and elongation was set at 94°C, 59°C and 74°C for 1 min each. All PCR analysis from the sampling locations, except location zero, yielded PCR products of expected size as checked by agarose gel electrophoresis (Ausubel et al., 1994). Sampling location S0 was not considered for further investigations. DGGE analysis was performed using a D GENE denaturing gel electrophoresis system according to the manufacturers' instructions (Biorad, Vienna, Austria) running an 8% polyacrylamide gel with a parallel chemical denaturing gradient adapted to between 10% and 80% and between 20% and 60% for initial analyses. Profiles of identical samples were corresponding for both gradients (data not shown) and for further analysis 10% to 80% was used as gradient ensuring that all bands were included especially for HPC samples. The running conditions were 200V at 60°C for 3 h, and applying 20 V for 15 min at the start of the DGGE analysis. For comparison of different DGGE gels, a DGGE-marker was used and prepared. Therefore, equivalent 16S-rDNA amplicon concentrations were mixed, which were obtained from Methylomonas methanica NCIMB 11130 (NCIMB, National Collection of Industrial and Marine Bacteria, Aberdeen, U.K.), Methylobacter albus NCIMB 11123, Methylobacter capsulatus NCIMB 11132, Brevibacter spp. (own isolate), Flavibacter spp. (own isolate), and Methylosinus trichosporium NCIMB 11131; sub-samples were stored at –80°C till usage (strains were chosen arbitrarily showing an appropriate migration behaviour in the DGGE gel). The gels were visualised and photographed by 30 min staining in a 1:10000 final diluted SYBR Green I nucleic acid gel stain (Molecular Probes, Leiden, Netherlands) and 10 min destaining in water, followed by a subsequent analysis with a GelDOC 2000 System (Biorad, Austria). Representative bands were excised and subsequently sequenced. Excised bands were put into a vial (containing 30 µℓ of ultra-pure water) and stored at 4°C overnight. 5 µℓ of a 10–1 dilution of each supernatant was thereafter used for the re-PCR at same settings as described above for PCR, except where the forward primer PRBA 338f with the T3 tag (5'-AAT TAA CCC TCA CTA AAG GG-3') attached to the 5'end was used and PCR was reduced to 25 cycles. PCR products were sequenced and sequences were submitted to the Basic Local Alignment Search Tool (BLAST, http://www.ncbi.nlm.nih.gov/BLAST/) in order to allocate to available 16S rRNA gene sequences.
Statistics and computational analysis of profiles
Digitised profiles were analysed using the software package Gelcompar II (Applied Maths, Belgium). Required standardisation and normalisation was achieved by a reference pattern of an inter lane standard (Farnleitner et al., 2005) applied to every 4th to 5th lane on the DGGE gels. From the triplicate HPC and standard duplicate DF profile analysis per sample (i.e. 100 single profiles) only one consensus profile per sample was used for further analysis. For cluster analysis, the Pearson product moment correlation (i.e. densitometric curve comparisons) and the Jaccard coefficient (i.e. band-based comparison) were calculated. For DGGE band-based investigations bands were referred as operational taxonomic units (OTU). Dendrograms were generated with the un-weighted pair-group method of arithmetic averages (UPGMA), the single linkage and the complete linkage as available in the program. Different correlation coefficients and cluster algorithms gave a general consistent result of the analysed band patterns and thus indicated stable results. To test for statistical significance of the obtained clusters and respective spatial and temporal correlations, Jackknife simulations were performed as offered in Gelcompar. For further statistical analysis SPSS Software Version 8.0 was used.
Results
PCR DGGE: evaluating appropriate sampling volumes and reproducibility
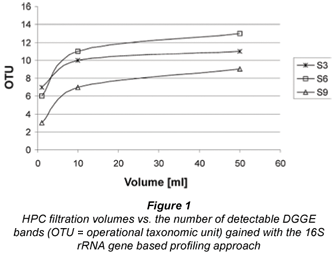
HPC DGGE profile analysis with increasing filtration volumes for representative sampling locations S3, S6, S9 clearly demonstrated that a saturation of recoverable OTU could be reached by using a volume of 50 mℓ of water (Fig. 1). Furthermore, no correlation between quantitative HPC counts and the respective numbers of OTU (i.e. numbers of DGGE bands) could be detected for the whole set of investigated samples (Spearmann Rank Coefficient, ρ = –0.009, p = 0.97, n = 19). Thus it can be concluded that a volumetric relationship between observed HPC concentrations and recoverable OTU richness did not exist and differing HPC DGGE profiles were not the result of inappropriately chosen sampling volumes but due to distinct HPC communities at distinct sampling locations (see below).
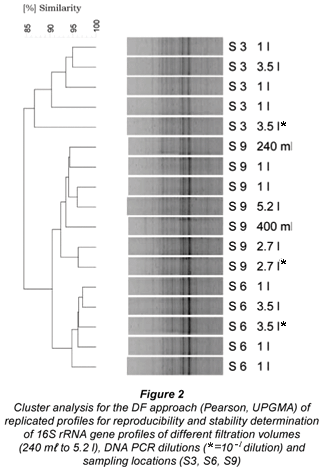
In contrast to the observed saturation effects of HPC OTU, all DF DGGE profiles remarkably corresponded for the respective test series of varying volumes, ranging from 240 mℓ to 5 200 mℓ (Fig. 2, next page) and for further investigations of the distribution system, volumes of 1 ℓ and 500mℓ were selected. Reproducibility testing on sites S3, S9, S6 for DF DGGE profiles revealed a tendency to cluster together for the selected evaluation set (Fig. 2), supporting the good discrimination power of the chosen V3- PCR DGGE approach. However, it has to be mentioned that the formed cluster proved not statistically significant by Jackknife analysis and furthermore profile similarity levels within each cluster (i.e. S3, S6, S9) were extremely high (85% to 95%). From the replicate analysis using 1 ℓ samples a reproducibility level for the applied PCR DGGE approach could be determined to be > 90% similarity (n = 8, cf. Fig 2). As for HPC, no correlation between BN and BN - OTU for the whole set of investigated samples was discernible (Spearmann Rank Coefficient, ρ = –0.42, p = 0.06, n = 20).
HPC, bacterial numbers (BN) and plating efficiency
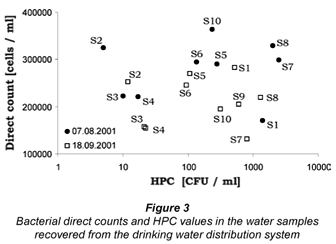
Comparison between the observed HPC concentrations and total bacterial numbers (BN) for all investigated water samples from the distribution system revealed that only a median fraction of 0.5% of the direct counts, ranging from 0.05% to 8.3% (n = 19) could be cultivated under the respective conditions (Fig. 3). No correlation between HPC and BN could be observed (Spearmann Rank Coefficient, ρ = –0.04, p = 0.85). The BN of the first sampling time (t1) was significantly higher than those from the second (t2) (Mann Whitney U-test, p < 0.05, n = 2×10), whereas no significant difference between t1 and t2 was observed for the HPC numbers (Mann Whitney U-test, p > 0.05; n = 9, 10).
Comparison of HPC vs. DF DGGE profiles from distribution system
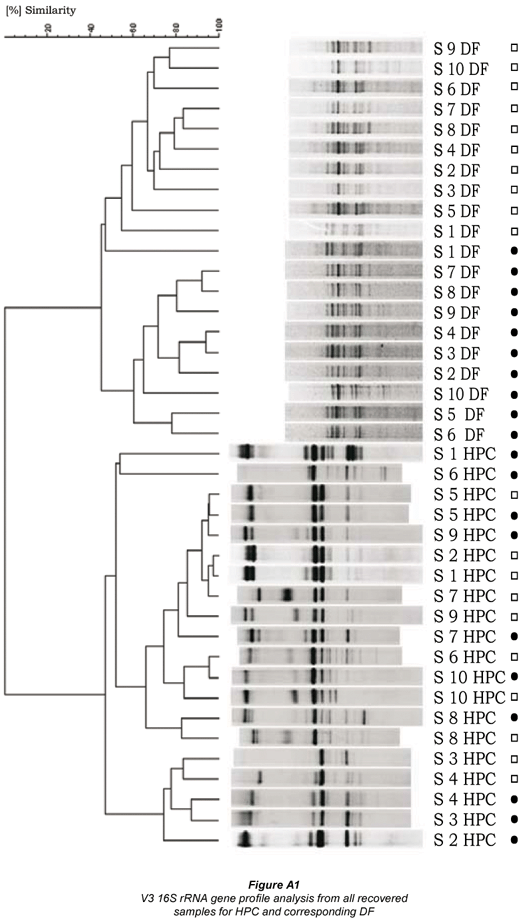
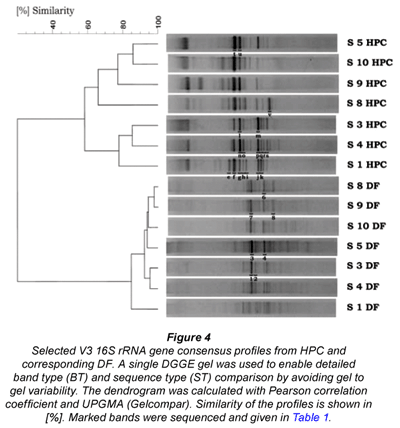
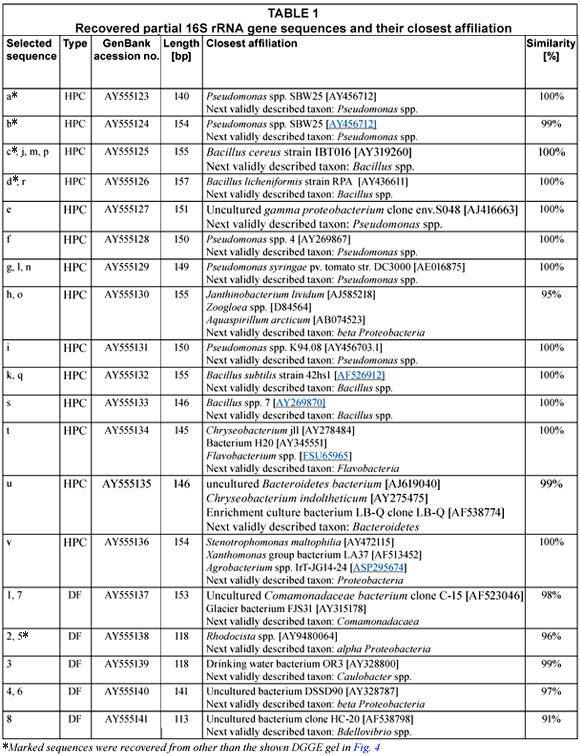
Comparison of the DGGE profiles from the HPC DNA extracts with the DF DNA extracts revealed 2 well-defined clusters for the whole set of analysed samples recovered from the distribution net (n = 39). The two clusters completely distinguished the HPC from DF profiles as shown for representatively selected samples in Fig. 4 (for all samples see Fig. A1 - additional materials). Jackknife analysis perfectly separated the 2 groups (100% distinction), irrespective of the applied cluster algorithm proving the statistical significance (p < 0.05). There was no correspondence between the dominant band types from HPC and DF profiles (Fig. 4). Sequencing of selected dominant bands from DGGE profiles (cf. Fig. 4) confirmed that different sequence types and thus distinct populations were recovered by HPC and DF for the whole set of samples (Table 1). For HPC mainly Pseudomonas spp. and Bacillus spp. could be found in the sequence database as the next validly described taxa with very high sequence similarities (> 99%). Sequences of bands from DF profiles obtained completely different results. No similar sequence could be found compared to the HPC sequences and highest similarities were obtained to uncultured bacteria of various α- and β-Proteobacteria in the sequence database (Table 1).
Spatial and temporal variations of DGGE profiles from distribution system
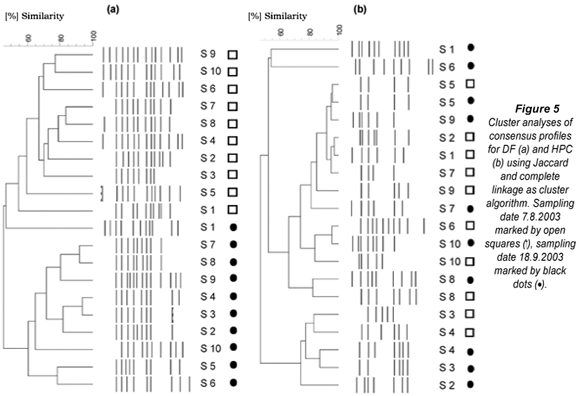
Analysis of the spatial and temporal dynamics of the HPC and DF profiles in the distribution system revealed contrasting results. Cluster analysis of DF profiles proved an association to the sampling time resulting in 2 distinct clusters (Fig. 5a). Jackknife analysis separated the DF profiles to 100% and 90% correctly to time point of sampling t1 and t2. No spatial association in the distribution system could be detected. Contrasting to DF analysis, HPC profiles revealed no detectable correlation to the sampling time (Fig. 5b), but showed a clear trend for an association with the sampling sites. This was supported by Jackknife re-sampling analysis, correctly assigning 55% of all samples to the respective sampling location, whereas DF analysis resulted in only 10% of correct spatial allocations (data not shown).
Discussion
More than 20 years ago, Staley and Konopka described the 'great plate count anomaly' for oligotrophic aquatic habitats which is based on the overwhelming disparity between the observed concentrations of colonies detected on traditional cultivation media and cell numbers enumerable by microscopic direct detection techniques (Staley and Konopka, 1985). For drinking water, commonly reported values of HPC populations vary from <0.02 to 104 CFU/mℓ and are strongly dependent on the cultivation medium, incubation time and temperature, whereas bacterial numbers determined by microscopic direct count techniques are commonly found to be in the range of 104 to 107 cells/mℓ (Farnleitner et al., 2005a; Hoefel et al., 2005; Hammes et al., 2008). Resulting plating efficacies are thus usually around and below 1%, as it was also the case in our study, showing a median value of 0.5%. Several factors are currently considered responsible for the huge discrepancy between cultivation and direct detection in terms of the recovered abundance. First and probably most important, oligotrophic aquatic systems, like drinking water distribution systems, exhibit low substrate and nutrient availabilities, and for example bio-available dissolved organic carbon substrates are commonly found in the range of µg/ℓ or below (Wilhartitz et al., 2009). In contrast, HPC cultivation media contain easily degradable organic substrates in the range of g/ℓ and only those cells which tolerate or which are adapted to these high substrate concentrations (i.e. copiotrophic cells) are recovered by the conventional HPC methods (Coallier et al., 1994; Reynolds and Fricker, 1999; Delahaye et al., 2003; Hoefel et al., 2003; Farnleitner et al., 2004; Hoefel et al., 2005). In this respect, cells which are adapted to low substrate concentrations may additionally be impeded by substrate accelerated bacterial cell death induced by the high concentrations of certain substrates in the HPC media (Barer and Harwood, 1999). On the other hand, cells may need the contact of surrounding cells or specific microenvironments due to syntrophic relationships (Szewzyk et al., 2000), or simply may require vital signalling molecules required for cell-to-cell communication (i.e. quorum sensing), which may be diluted by standard HPC procedures (Kaprelyants and Kell, 1996). Furthermore, fractions of bacterial cells encountered may simply be dead, injured or inactive cells, which are not distinguishable by direct count methods such as the herein-used DAPI direct count approach. Finally, bacterial cells may enter a viable but non-culturable (VBNC) or an active but non-culturable (ANBC) state (Kell et al., 1998; Szewzyk et al., 2000) and although viable or active cells are present in the drinking water they are not amenable to cultivation. Besides mentioned differences in recovered cell or colony abundance, fundamental discrepancies between HPC-based procedures vs. direct detection techniques from drinking water collected within distribution systems have also been encountered in relation to the taxonomic affiliation of the recovered organisms or nucleic acid sequences, respectively (Foght et al., 2004; Williams et al., 2004; Crump and Hobbie, 2005; Loy et al., 2005; Abulencia et al., 2006). However, it has to be mentioned that, except in a preliminary study by our group (Farnleitner et al., 2004), comparative direct molecular-based investigations on HPC communities from the planktonic phase in relation to the corresponding total bacterial community have unfortunately not been available to date for drinking water distribution systems.
In this study a rigorous comparison between the cultivable copiotrophic fraction (HPC) used for water quality monitoring and the dominating in situ bacterial community (DF) from corresponding drinking water samples has been undertaken along a distribution net. Results demonstrate that HPC populations recovered by membrane filtration, using an ISO 6222 standard method compatible agar medium, represent completely different communities as compared to recovered DF communities from corresponding samples. No common DGGE band or sequence for both the HPC and DF communities could be retrieved from the whole set of pair-wise comparisons covering 2 points in time and 10 sampling locations throughout the distribution system. From the recovered median plating efficacy within this study (i.e. 0.5%) and the commonly reported PCR DGGE detection limit for a successful detection of distinct populations within profiled communities (i.e. 1% to 10% minimum abundance of the total community (Farnleitner et al., 2004)) it can be furthermore concluded that bacterial taxa retrieved by cultivation did not constitute dominant populations in the investigated water of the distribution system. Our results are in principal agreement with a recently performed study by Hoefel et al. (2005) comparing the DF and HPC communities in Australian water samples at 2 sampling sites during potable water production by using the same PCR DGGE approach but coupled to a flow cytometric analysis. Both investigation sites, the reservoir and the settled water site after coagulation, flocculation and sedimentation, showed significantly different HPC and DF profiles and the HPC abundance was generally less than 0.1% of the total bacterial communities. However, a few bands appeared to be shared between the HPC and DF community. In this respect it should be mentioned that Hoefel et al. (2005) used R2A and TSA agar showing lower substrate availability as compared to the ISO 6222 Agar (Reasoner and Geldreich, 1985; ISO, 1998). Quite an opposite picture to the planktonic phase of potable water discussed above was presented by the comprehensive studies of Kalmbach et al. (1997; 1999), studying bacterial cells in young established biofilms in German and Swedish drinking water distribution systems. Surprisingly, by the use of R2A agar (reported plating efficacy between 0.1% and 1.5%) bacterial strains could be grown belonging to the newly established genera Aquabacterium spp. By design of strain-specific FISH probes the authors could prove that the cultivated Aquabacterium spp. taxa formed system-dominant populations in young drinking water biofilms. The authors concluded that the majority of the considered strains formed VBNC populations and only small fractions of those subpopulations resided in a cultivable condition (Kalmbach et al., 1997). The contrasting results from HPC taxa in respect to the planktonic vs. the biofilm phase, as discussed above, agree with the recently postulated concept that cells in biofilm compartments are thought to be associated with growth activities (and thus are in principle cultivable), whereas cells in the planktonic phase are non-growing detached subsets thereof, spreading in the environment for new sessile habitats (Szewzyk et al., 2000). However, far more detailed data are needed in future to support this speculative hypothesis for distribution systems.
The sequences gained in this study from DGGE profiles of HPC filters could easily be allocated and were most often identical to well-known HPC members (Table 1), such as Bacillus, Flavobacterium, and Pseudomonas (Koch, 1893; LeChavallier et al., 1980; Allen et al., 2002; Sartory, 2004; Williams et al., 2004; Tokajian et al., 2005, Liu et al., 2008). Accordingly to the recovered partial sequences, the HPC community was dominated by Bacillus spp. and Pseudomonas spp. populations. Thus ubiquitously-occurring copiotrophic bacterial cells were recovered by the applied ISO 6222 agar. Unlike sequences from HPC profiles, dominant bands from DF profiles (cf. Table 1) showed similarities mainly to sequences from uncultured bacteria reported from the aquatic environment. The identical sequences from Bands 1 and 7 showed 98% similarity to a sequence found in a study of bottled mineral water (Loy et al., 2005) and to a glacier bacterium gained from sub-glacial sediments and ice (Foght et al., 2004). Sequences 2 and 5 showed 96% similarity to an uncultured alpha proteobacteria clone originating from bacterioplankton communities of 2 rivers (Crump and Hobbie, 2005). Sequence 3 showed similarities of 99% to a drinking water bacterium found in a distribution system simulator (Williams et al., 2004), to an uncultured bacterium gained from a fluidised bed reactor treating contaminated ground water (Cardenas et al., 2005), and to an uncultured bacterium found in the Weser estuary (Selje and Simon, 2002). Sequences 4 and 6 showed 97% similarity to an uncultured bacterium from the study of the drinking water distribution system simulator (Williams et al., 2004) and to a sequence of a clone originating from sediments (Abulencia et al., 2006). It may be concluded that the recovered DF sequences represented members of autochthonous aquatic bacterial populations.
Conclusion
By use of the rigorous PCR DGGE standardisation and evaluation measures, to our knowledge for the first time, a 16S rRNA gene profile analysis with spatial and temporal resolution between corresponding HPC and DF communities in a drinking water distribution net could be realised. The results were unexpected and revealed a totally different spatial and temporal behaviour of DF vs. HPC communities. The strong spatial associations of the HPC 16S rRNA gene profiles may be explained by local associated biofilm interactions in the complex and large distribution net, which possibly introduced HPC into the planktonic water phase. In fact, growth and subsequent detachment of biofilm bacteria into the planktonic water phase has been reported before by Servais et al. (1992; 2004) and provides a plausible argument for the observed spatial correlation. In contrast, the excellent temporal correlation of the DF 16S rRNA gene profiles to sampling time t1 and t2, irrespective of which sampling location was investigated, points to a determining role of source-water quality in terms of the occurring DF community. However, due to practical reasons, no source-water DF analysis could be performed, and this explanation remains only speculation. Nonetheless, it has become a well-known fact that groundwater and spring-water possess their own characteristic and distinguishable autochthonous DF communities (Farnleitner et al., 2005a; Eichler et al., 2006), which may show some temporal variations due to hydrological variations in the aquifer (Farnleitner et al., 2005a). For the observed contrasting dynamics of the HPC vs. the DF communities it is speculated that possible biofilm detachment in the distribution system could only be detected by HPC communities due to the sensitive cultivation approach (i.e. 1 CFU can easily be detected by the PCR DGGE approach). In contrast, DF communities were not detached from biofilm compartments in such a manner as to significantly change the DF profiles (DF DGGE sensitivity only 1 to 10% of the total population, see discussion above) and profiles were likely the result of cells from the planktonic water phase as derived from the groundwater source.
Acknowledgements
This study was supported by grants from the Austrian Academy of Sciences to AHF (APART 10794 [Austrian Program for Advanced Research and Technology]) and by an FWF Project No. P18247-06 granted to AHF.
References
ABULENCIA CB, WYBORSKI DL, GARCIA JA, PODAR M, CHEN WQ, CHANG SH, CHANG HW, WATSON D, BRODIE EL, HAZEN TC and KELLER M (2006) Environmental whole-genome amplification to access microbial populations in contaminated sediments. Appl. Environ. Microbiol. 72 (5) 3291-3301. [ Links ]
ALLEN MJ, EDBERG SC and REASONER DJ (2002) Heterotrophic plate count (HPC) bacteria – what is their significance in drinking water? Proc. 2002 NSF Int./World Health Org. Symp. on HPC Bacteria in Drinking Water, ISBN 0-9675817-5-3. April 22-24, Geneva, Switzerland. 29-46. [ Links ]
AMANN RI, LUDWIG W and SCHLEIFER KH (1995) Phylogenetic identification and in-situ detection of individual microbial cells without cultivation. Microbiol. Rev. 59 (1) 143-169. [ Links ]
AUSUBEL RB, BRENT R, KINGSTON RE, MOORE DD, SEIDMAN JG, SMITH JA and STRUHL K (1994) Current Protocols in Molecular Biology. John Wiley and Sons, New York. [ Links ]
BERRY D and RASKIN L (2006) Microbial ecology of drinking water distribution systems. Curr. Opin. Biotechnol. 17 (3) 297-302. [ Links ]
BARER MR and HARWOOD CR (1999) Bacterial viability and culturability. Adv. Microb. Physiol. 41 93-137. [ Links ]
COALLIER J, PREVOST M, ROMPRE A and DUCHESNE D (1994) The optimization and application of 2 direct viable count methods for bacteria in distributed drinking-water. Can. J. Microbiol. 40 (10) 830-836. [ Links ]
CRUMP BC and HOBBIE JE (2005) Synchrony and seasonality in bacterioplankton communities of two temperate rivers. Limnol. Oceanogr. 50 (6) 1718-1729. [ Links ]
DELAHAYE E, WELTE B, LEVI Y, LEBLON G and MONTIELA (2003) An ATP-based method for monitoring the microbiological drinking water quality in a distribution network. Water Res. 37 (15) 3689-3696. [ Links ]
DEWETTNICK T, HULSBOSCH W, VAN HEGE K, TOP EM and VERSTRAETE W (2001) Molecular fingerprinting of bacterial populations in groundwater and bottled mineral water. Appl. Microbiol. Biotechnol. 57 (3) 412-418. [ Links ]
EDBERG SC, KOPS S, KONTNICK C and ESCARZAGA M (1997) Analysis of cytotoxicity and invasiveness of heterotrophic plate count bacteria (HPC) isolated from drinking water on blood media. J. Appl. Microbiol. 82 (4) 455-461. [ Links ]
EICHLER S, CHRISTEN R, HÖLTJE C, WESTPHAL P, BÖTEL J, BRETTAR I, MEHLING A and HÖFLE MG (2006) Composition and dynamics of bacterial communities of a drinking water supply system as assessed by RNA- and DNA-based 16S rRNA gene fingerprinting. Appl. Environ. Microbiol. 72 (3) 1858-1872. [ Links ]
FARNLEITNER AH, REISCHER G, ZIBUSCHKA F, LINDNER G and MACH RL (2001) Comparison and differentiation of heterotrophic plate count communities in raw and drinking water by eubacterial 16S-rDNA amplicon profiling. Vom Wasser 97 167-180. [ Links ]
FARNLEITNER AH, WILHARTITZ I, RYZINSKA G, KIRSCHNER AKT, STADLER H, BURTSCHER MM, HORNEK R, SZEWZYK U, HERNDL G and MACH RL (2005a) Bacterial dynamics in spring water of alpine karst aquifers indicates the presence of stable autochthonous microbial endokarst communities. Environ. Microbiol. 7 (8) 1248-1259. [ Links ]
FARNLEITNER AH, WILHARTITZ I, REISCHER G, BURTSCHER MM and MACH RL (2005b) Possibilities and limitations of molecular biological techniques for microbial water quality analysis. D. Lebensm. Rundsch. 101 446-456. [ Links ]
FARNLEITNER AH, ZIBUSCHKA F, BURTSCHER, MM, LINDNER G, REISCHER G and MACH RL (2004) Eubacterial 16SrDNA amplicon profiling: a rapid technique for comparison and differentiation of heterotrophic plate count communities from drinking water. Intern. J. Food Microbiol. 92 (3) 333-345. [ Links ]
FOGHT J, AISLABIE J, TURNER S, BROWN CE, RYBURN J, SAUL DJ and LAWSON W (2004) Culturable bacteria in subglacial sediments and ice from two Southern Hemisphere glaciers. Microb. Ecol. 47 (4) 329-340. [ Links ]
FROMIN N, HAMELIN J, TARNAWSKI S, ROESTI D, JOURDAIN-MISEREz K, FORESTIER N, TEYSSIER-CUVELLE S, GILLET F, ARAGNO M and ROSSI P (2002) Statistical analysis of denaturing gel electrophoresis (DGE) fingerprinting patterns. Environ. Microbiol. 4 (11) 634-643. [ Links ]
GRIFFITHS RI, WHITELEY AS, O'DONNELL AG and BAILEY MJ (2000) Rapid method for coextraction of DNA and RNA from natural environments for analysis of ribosomal DNA- and rRNA-based microbial community composition. Appl. Environ. Microbiol. 66 (12) 5488-5491. [ Links ]
HAMMES F, BERNEY M, WANG Y, VITAL M, KÖSTER O and EGLI T (2008) Flow-cytometric total bacterial cell counts as a descriptive microbiological parameter for drinking water treatment processes. Water Res. 42 (1-2) 269-277. [ Links ]
HOEFEL D, GROOBY WL, MONIS PT, ANDREWS S and SAINT CP (2003) Enumeration of water-borne bacteria using viability assays and flow cytometry: a comparison to culture-based techniques. J. Microbiol. Methods 55 (3) 585-597. [ Links ]
HOEFEL D, MONIS PT, GROOBY WL, ANDREWS S and SAINT CP (2005) Profiling bacterial survival through a water treatment process and subsequent distribution system. J. Appl. Microbiol. 99 (1) 175-186. [ Links ]
ISO (1998) Water quality – enumeration of culturable micro-organisms – colony count by inoculation in a nutrient agar culture medium. prEN ISO 6222. Brussels, European Committee for Standardisation. [ Links ]
KALMBACH S, MANz W and SZEWZYK U (1997) Isolation of new bacterial species from drinking water biofilms and proof of their in situ dominance with highly specific 16S rRNA probes. Appl. Environ. Microbiol. 63 (11) 4164-4170. [ Links ]
KALMBACH S, MANZ W, WECKE J and SZEWZYK U (1999) Aquabacterium gen. nov., with description of Aquabacterium citratiphilum sp. nov., Aquabacterium parvum sp. nov. and Aqua-bacterium commune sp. nov., three in situ dominant bacterial species from the Berlin drinking water system. Int. J. Syst. Bact. 49 769-777. [ Links ]
KAPRELYANTS AS and KELL DB (1996) Do bacteria need to communicate with each other for growth? Trends Microbiol. 4 (6) 237-242. [ Links ]
KELL DB, KAPRELYANTS AS, WEICHART DH, HARWOOD CR and BARER MR (1998) Viability and activity in readily culturable bacteria: A review and discussion of the practical issues. Antonie Van Leeuwenhoek Int. J. Gen. Mol. Microbiol. 73 (2) 169-187. [ Links ]
KIRSCHNER AKT, ULBRICHT T, STEITZ A and VELIMIROV B (1999) Material fluxes through the procaryotic compartment in a eutrophic backwater branch of the River Danube. Aquat. Microb. Ecol. 17 (3) 211-230. [ Links ]
KOCH R (1893) Wasserfiltration und Cholera. Zentralbl. Hyg. 14 393 429. [ Links ]
LECHAVALLIER M, SEIDLER R and EVANS T (1980) Enumeration and characterization of standard plate count bacteria in chlorinated and raw water supplies. Appl. Environ. Microbiol. 40 922-930. [ Links ]
LIU XL, LIU WJ, JIN GU and GU JN (2008) Analysis of microbial community of a Beijing simulator water distribution system. Huan Jing Ke Xue 29 (5) 1170-1174. [ Links ]
LOY A, BEISKER W and MEIER H (2005) Diversity of bacteria growing in natural mineral water after bottling. Appl. Environ. Microbiol. 71 (7) 3624-3632. [ Links ]
MARTINY AC, ALBRECHTSEN HJ, ARVIN E. and MOLIN, S (2005) Identification of bacteria in biofilm and bulk water samples from nonchlorinated model drinking water distribution system: detection of a large nitrite-oxidizing population associated with Nitrospira spp. Appl. Environ. Microbiol. 71 (12) 8611-8617. [ Links ]
McCOY WF and OLSON BH (1986) Relationship among turbidity, particle counts and bacteriological quality within water distribution lines. Water Res. 20 (8) 1023-1029. [ Links ]
MUYZER G, DEWAAL EC and UITTERLINDEN AG (1993) Profiling of complex microbial-populations by denaturing gradient gel-electrophoresis analysis of polymerase chain reaction-amplified genes-coding for 16S ribosomal-RNA. Appl. Environ. Microbiol. 59 (3) 695-700. [ Links ]
NORTON CD and LECHEVALLIER MW (2000) A pilot study of bacteriological population changes through potable water treatment and distribution. Appl. Environ. Microbiol. 66 (1) 268-276. [ Links ]
OVREAS L, FORNEY L, DAAE FL and TORSVIK V (1997) Distribution of bacterioplankton in meromictic Lake Saelenvannet, as determined by denaturing gradient gel electrophoresis of PCR-amplified gene fragments coding for 16S rRNA. Appl. Environ. Microbiol. 63 (9) 3367-3373. [ Links ]
PAVLOV D, DE WET CME, GRABOW WOK and EHLERS MM (2004) Potentially pathogenic features of heterotrophic plate count bacteria isolated from treated and untreated drinking water. Int. J. Food Microbiol. 92 (3) 275-287. [ Links ]
PAYMENT P, GAMACHE F and PAQUETTE G (1988) Microbiological and virological analysis of water from 2 water filtration plants and their distribution-systems. Can. J. Microbiol. 34 (12) 1304-1309. [ Links ]
REASONER DJ (1990) Monitoring heterotrophic bacteria in potable water. In: GA Mc Feters (ed.) Drinking Water Microbiology: Progress and Recent Developments. Springer Verlag, New York. [ Links ]
REASONER DJ and GELDREICH EE (1985) A new medium for the enumeration and subculture of bacteria from potable water. Appl. Environ. Microbiol. 49 (1) 1-7. [ Links ]
REYNOLDS DT and FRICKER CR (1999) Application of laser scanning for the rapid and automated detection of bacteria in water samples. J. Appl. Microbiol. 86 (5) 785-795. [ Links ]
RUSIN PA, ROSE JB, HAAS CN and GERBA CP (1997) Risk assessment of opportunistic bacterial pathogens in drinking water. Rev. Environ. Contam. Toxicol. 152 57-83. [ Links ]
SARTORY DP (2004) Heterotrophic plate count monitoring of treated drinking water in the UK: a useful operational tool. Int. J. Food Microbiol. 92 (3) 297-306. [ Links ]
SERVAIS P, ANZIL A, GATEL D and CAVARD J (2004) Biofilm in the Parisian suburbs drinking water distribution system. J. Water Supply Res. Technol.-Aqua 53 (5) 313-324. [ Links ]
SERVAIS P, BILLEN G, LAURENT P, LEVI Y and RANDON G (1992) Studies of BDOC and bacterial dynamics in the drinking water distribution system of the Northern Parisian suburbs. Sci.de l'Eau 5 69-89. [ Links ]
STALEY JT and KONOPKA A (1985) Measurement of in situ activities of nonphotosynthetic microorganisms in aquatic and terrestrial habitats. Ann. Rev. Microbiol. 39 321-346. [ Links ]
STANDARD METHODS (1995) Standard Methods for the Examination of Water and Wastewater (19th edn.) American Public Health Association (APHA), Washington, DC. [ Links ]
SZEWZYK U, SZEWZYK R, MANZ W and SCHLEIFER KH (2000) Microbiological safety of drinking water. Ann. Rev. Microbiol. 54 81-127. [ Links ]
TOKAJIAN ST, HASHWA FA, HANCOCK IC and ZALLOUA PA (2005) Phylogenetic assessment of heterotrophic bacteria from a water distribution system using 16S rDNA sequencing. Can. J. Microbiol. 51 (4) 325-335. [ Links ]
VAN DER KOOIJ D (2002) Managing re-growth in drinking water distribution systems. Proc. 2002 NSF Int./World Health Org. Symp. on HPC Bacteria in Drinking Water, ISBN 0-9675817-5-3. April 22-24, Geneva, Switzerland. 449-478. [ Links ]
VIVES-REGO J, LEBARON P and NEBE-VON CARON G (2000) Current and future applications of flow cytometry in aquatic microbiology. FEMS Microbiol. Rev. 24 (4) 429-448. [ Links ]
WATKINS J and XIANGRONG J (1997) Cultural methods of detection for microorganisms: recent advances and successes. In: Sutcliffe DW (ed.) The Microbiological Quality of Water. Freshwater Biological Association, Ambleside. Ambleside, Freshwater Biological Association. 19-27. [ Links ]
WHO (2002) Expert Consensus. In: JCJ Bartram, M Exner, CR Fricker and A Glasmacher (eds.) Heterotrophic Plate Count and Drinking-Water Safety. IWA Publishing, London. [ Links ]
WILHARTITZ I, KIRSCHNER AKT, STADLER H, HERNDL G, DIETZEL M, LATAL C, MACH RLM and FARNLEITNER AH (2009) Heterotrophic prokaryotic production in ultraoligotrophic alpine karst aquifers and ecological implications. FEMS Microbiol. Ecol. 68 287-299. [ Links ]
WILLIAMS MM, DOMINGO JWS, MECKES MC, KELTY CA and ROCHON HS (2004) Phylogenetic diversity of drinking water bacteria in a distribution system simulator. J. Appl. Microbiol. 96 (5) 954-964. [ Links ]
Received 3 March 2009; accepted in revised form 22 April 2009.
§ Present address: Environmental Research Institute, North Highland College, UHI Millennium Institute, Castle Street, Thurso, KW14 7JD Scotland
* To whom all correspondence should be addressed.
+43 (01) 5880117251; fax: +43 (01) 5816266;
e-mail: A.FARNLEITNER@aon.at
Supplementary information to the paper:
