Services on Demand
Article
Indicators
Related links
-
 Cited by Google
 -
 Similars in Google
Share
Water SA
On-line version ISSN 1816-7950
Print version ISSN 0378-4738
Water SA vol.35 n.3 Pretoria Apr. 2009
Practical application and statistical analysis of titrimetric monitoring of water and sludge samples
SWH Van HulleI, II, *; S De MeyerI; TJL VermeirenI; A VergoteI; J HogieI; P DejansI
IResearch Group EnBiChem, Department of Industrial Engineering and Technology, University College West Flanders, Graaf Karel de Goedelaan 5, B-8500 Kortrijk, Belgium
IIBIOMATH, Department of Applied Mathematics, Biometrics and Proces Control, Ghent University, Coupure Links 653, B-9000 Gent, Belgium
ABSTRACT
Titrimetry offers the possibility of simultaneous measurement at low cost of several (buffering) components. A first step in the study towards practical application of the titrimetric technique was the titrimetric analysis by up- or down-titration of standard solutions, standard mixtures, solids digester samples and water samples coming from autotrophic nitrogen-removal reactors. The resulting raw data were further processed with an Excel-based program. This program first converts the raw data into a buffer curve upon which a linear buffer capacity model is fitted to the experimental data by estimating the (buffer) concentrations and corresponding pKa values. As such the type of component and the concentration can be determined. As a second step the resulting calculated concentrations were analysed statistically to assess the accuracy and precision of the titrimetric technique. For this purpose, the data were paired, i.e. the difference between the concentration obtained with titrimetry and the concentration obtained with another technique such as colorimetry or gas chromatography was calculated. First the normality of the paired data was assessed. Then, a paired t-test (normal data) or a paired Wilcoxon test (normal data) was used to statistically compare the results obtained with the titrimetric technique to either the stock solution concentration or measurements with another method (colorimetry or gas chromatography). The statistical tests showed that, depending on the titrant concentration, concentrations from 50 mg/ℓ to 3 000 mg/ℓ could adequately be measured with the titrimetric technique.
Keywords: titrimetric monitoring, water treatment, modelling, statistical analysis
Introduction
Titrimetry offers the possibility of simultaneous measurement at low cost of several (buffering) components, such as ammonium, volatile fatty acids, phosphate and nitrite, in wastewater and sludge samples. Titrimetry can therefore be used in aerobic, anaerobic and physicochemical wastewater treatment. This study demonstrates the practical application of titrimetric monitoring of samples originating from anaerobic water and sludge treatment reactors. The anaerobic processes considered here are anaerobic solids digestion (ASD) and nitrogen removal by the autotrophic nitrogen-removal (ANR) process.
The ASD process offers the possibility of transferring waste streams into biogas (mainly a mixture of methane (66%) and CO2 (33%)). This biogas can be transformed into electricity and heat. Examples of waste streams that can be treated by anaerobic digestion are livestock farm waste (e.g. various manures, slurries and waste waters), agro-industrial waste (from abattoirs, wineries, vegetable-processing plants, etc.), animal dung, human sewage and crop residues (Hilkiah Igoni et al., 2008).
The effluent from such ASD reactors contains high amounts of nitrogen (1 to 5 g N/ℓ). About 80% of this nitrogen is in the form of ammonium and about 20% is organic nitrogen. The nitrogen content of this effluent needs to be decreased in view of further valorisation of this stream as for example agricultural fertiliser. Normally this reduction is accomplished by applying a nitrification/denitrification process (Metcalf and Eddy, 2003). An efficient and cost-effective alternative for the traditional nitrification/denitrification process is the autotrophic nitrogen removal process. This process is also known as the SHARON-Anammox process (Van Dongen et al., 2001) or the OLAND process (Kuai and Verstraete, 1998). In the autotrophic nitrogen-removal process a highly loaded nitrogen stream is first partially oxidised in a reactor that is operated in such as way that ammonium oxidisers are maintained in the reactor, while nitrite oxidisers are washed out and further nitrification of nitrite to nitrate is prevented. The SHARON (Single reactor system for High activity Ammonium Removal Over Nitrite) reactor, for example, can produce an almost 1:1 ammonium to nitrite ratio depending on the ammonium to bicarbonate ratio in the influent of the SHARON reactor. The effluent of the partial nitrification reactor is then sent to an Anammox (Anaerobic ammonium oxidation) reactor where the remainder of the ammonium is oxidised anoxically with nitrite as electron acceptor (Van Hulle et al., 2005).
Both anaerobic processes are very sensitive to inhibition and frequent monitoring of the reactor is essential for stable operation. This paper demonstrates the practical application of monitoring certain key components in the ASD and ANR processes using titrimetric measurements. For the ANR reactor, the key components are ammonium and nitrite. For the ASD reactor, ammonium, bicarbonate alkalinity and volatile fatty acids are the components of concern. Similarly to previous studies the complete and detailed titration profile (typically 50 measurement points) is used for model-based interpretation and concentration determination (Van Vooren et al., 2001; Zaher and Vanrolleghem, 2005). Classification of different titrimetric techniques (Zaher et al., 2004) has shown the use of this detailed titration profile is an advanced technique for improving the accuracy of the titrimetric measurement (Zaher and Vanrolleghem, 2005). This is mainly because up to 50 data points are used in contrast to other titrimetric techniques, which typically use up to 8 data points recorded at certain pH levels (Lahav and Loewenthal, 2000; Moosbrugger et al., 1993). As such the detailed titration profile method was applied in this study.
Material and methods
ASD and ANR reactors
A first series of samples for titrimetric analysis was taken from the anaerobic solids digestion reactors operated at the biogas lab of the EnBiChem research group (www.biogas-labo.be). Several solid waste streams are treated in batch (1.5 ℓ) reactors and semi-continuous reactors (50 ℓ) at 37°C or 51°C. Biogas production from these reactors was monitored on a daily basis.
A second series of samples for titrimetric analysis was taken from the autotrophic nitrogen- removing reactors present at the BIOMATH lab at the Ghent University. These 2 ℓ reactors, fed with synthetic influent, are described in detail by Van Hulle et al. (2005) and Van Hulle et al. (2006).
Chemical analysis and standard solutions
Concentrations of ammonium, nitrite and phosphate were analysed according to standard methods by the colorimetric method (Standard Methods, 1992). Volatile fatty acids were analysed by gas chromatography with an FID detector (Grob and Barry, 2004). Further, concentrations of ammonium, nitrite, volatile fatty acids and phosphate were also analysed with a titrimetric set-up. A Metrohm titrino 716 (Metrohm, Switzerland) was used for the ANR samples. The collection and interpretation of these data is discussed in detail by Van Hulle et al. (2006). A Metrohm titrino 775 (Metrohm, Switzerland) was used for the ASD and standard solutions.
Three types of titration were performed. Up-titration was performed when samples were acidified to pH 2 with a 37% HCl solution. As such the CO2 in the sample was stripped. The pH of the sample was adjusted to 12 when down-titration was performed. No acid or base was added prior to titration when a neutral titration was performed. No sample pretreatment (e.g. filtration or centrifugation) was performed.
The titrant (NaOH or HCl) was prepared by adding an appropriate amount of NaOH pellets or concentrated HCl (37%) to distilled water. Standard solutions were prepared by appropriate dilution from freshly prepared NaNO2, (NH4)2SO4, acetic acid, butyric acid and Na2HPO4 stock solution.
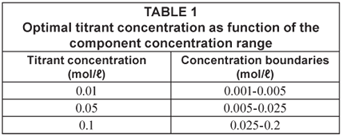
A preliminary study revealed that the optimal titrant concentration is a function of the component concentration as described in Table 1. The samples analysed in this study are in the concentration range given in Table 1. As such this study aimed at demonstrating the feasibility of the titrimetric technique for measuring samples in the 50 to 3 000 mg/ℓ range.
Buffer curve calculation and pKa and concentration estimation
The buffer capacity (β) curve is calculated from the titration curve, which is obtained by measuring the pH as function of a stepwise addition of base. From this measured titration curve (typically around 30 to 50 data points) the buffer capacity at each pH point is calculated as the derivative of the amount of base needed (meq/ℓ·pH). The area of each peak of the buffer capacity curve is related to the concentration of the component, while the position is depending on the pKa value(s) of the component.
The buffer capacity curve in fact consists of the sum of the buffer capacities of individual buffering components in the solution (Van Vooren et al., 2001). Based on this additive property of β, one can write a general equation for the buffer capacity of a sample containing l monoprotic, m diprotic and n triprotic weak acids (Van Vooren et al., 2001):

where:
Β: buffer capacity (eq/ℓ pH)
[H+]: hydrogen ion concentration (mol/ℓ), equals 10–pH
[HB][H2B'][H3B"]: concentration of respectively a monoprotic, diprotic or triprotic weak acid (mol/ℓ)
Ka: acidity constant
The acid concentrations and acidity constant values in this buffer capacity curve can be considered as parameters that can be estimated by minimising the sum of squared errors between calculated and measured buffer capacity curve. Such an algorithm was developed in MS-Excel using the solver function. This solver minimises the sum of squared errors by changing the values of the acid concentrations and acidity constants. The minimum value is found using the Generalised Reduced Gradient (GRG2) nonlinear optimisation algorithm (Fylstra et al., 1998), which was implemented in Excel.
The buffers presented in Table 2 were considered. Further, the initial value of the acidity constants is given. The estimated value of the acidity constant after minimisation of the sum of squared errors varied from sample to sample because this acidity constant is affected by different factors such as ionic strength. All in all the final value was always within a 10% range of the initial value.
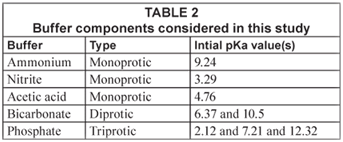
The last component in Table 1 was introduced to take into account unknown buffers that could be present in the sample.
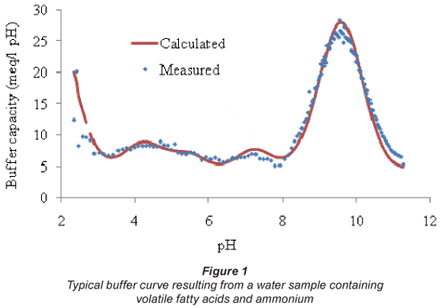
The algorithm also took dilution effects into account, originating from acid or base addition during titration. As an example, the titration of a water sample containing volatile fatty acids and ammonium is presented in Fig. 1.
Statistical analysis
For every experiment, the normality of the paired data (difference between the concentration obtained with titrimetry and the concentration obtained with another technique such as colorimetry or gas chromatography) was tested with a normal probability plot (Brereton, 2003). This was done because a paired t-test, the standard test for testing the hypothesis that 2 measurement methods cannot be differentiated, can only be used if the data are normally distributed. In case of the data not being normally distributed a paired Wilcoxon test should be used (Currell and Dowman, 2005). If the paired data are normally distributed, then the normal probability plot should be linear. The R² linear correlation coefficient can be used to determine this linearity. If this R² value is below a certain value (depending on the number of measurements), then the normal probability plot is not linear (Filliben, 1975). For every experiment discussed below this critical R² value is given.
The theory of paired t-testing and the Wilcoxon test is described elsewhere (Brereton, 2003; Currell and Dowman, 2005) but basically comes down to the following: The test statistic (t, W- and W+) is calculated starting from the difference between the concentration obtained with titrimetry and the concentration obtained with another technique such as colorimetry or gas chromatography. If the calculated t-value is below the tabulated t-value or if the calculated W values are above the tabulated W-value, than the titrimetric method cannot statistically be distinguished from the other technique.
For every experiment, the student t-value, the Wilcoxon W+ and W- value and the R² linear correlation coefficient for the normal probability plot were calculated for the paired data. A 95% confidence interval was used in this study.
Results and discussion
Standard solutions and mixtures
A first series of samples for titrimetric analysis consisted of standard solutions and standard mixtures. Initially up-titration of 20 mℓ samples with a titrant concentration of 0.1 M was performed. However, the t-test that evaluated the hypothesis that volatile fatty acids could be measured by up-titration revealed that this hypothesis could be rejected. This non-agreement was probably caused by volatilisation of the volatile fatty acids when applying up-titration. As such it was decided to use up-titration for the determination of phosphate and ammonium and neutral down-titration for the determination of volatile fatty acids. The titrant concentration remained 0.1 M.
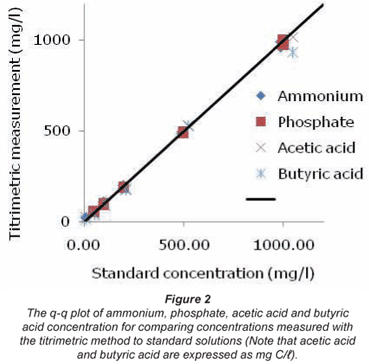
The q-q plot presenting the results from the titrimetric measurements of the ammonium, phosphate, acetic acid and butyric acid standard solutions is given in Fig. 2. In this q-q plot, the points have as abscissa the standard concentration and as ordinate the sample concentration obtained with the titrimetric method. In case both methods gave the same result, then all points should lie on the bisector.
In Table 3 the corresponding student t-value, the Wilcoxon W+ and W- value and the R² linear correlation coefficient for the normal probability plot are given. From this table it can be seen that for ammonium and butyric acid the R² value is below the critical R² value, indicating that the data are not normally distributed. As such non-parametric techniques such as the Wilcoxon test should be used. The other data can be considered normal. However, both the t-test and the Wilcoxon come to the same conclusion: the hypothesis that both methods are the same cannot be rejected.

Measurements performed with standard solutions of ammonium, phosphate, acetic acid and butyric acid resulted in the same conclusion: it can be stated with statistical confidence that these components can be measured by titrimetric analysis. Further, Fig. 2 demonstrates that the procedure can be applied to a wide range of concentrations. Measurements with mixtures of the tested components have resulted in the same conclusion.
The technique can now be evaluated on actual water and sludge samples.
ANR reactors
The raw experimental data obtained from the ANR reactors described by Van Hulle et al. (2006) were re-used in this study. First the components (ammonium, phosphate and nitrite) present and the related concentrations were calculated from the buffer capacity curves. These curves were obtained by up-titration of a 50 mℓ sample with a titrant concentration of 0.05 M. The values obtained with the titrimetric method were compared to measurement results obtained with a colorimetric method. The corresponding q-q plot is presented in Fig. 3. The excellent agreement is obvious.
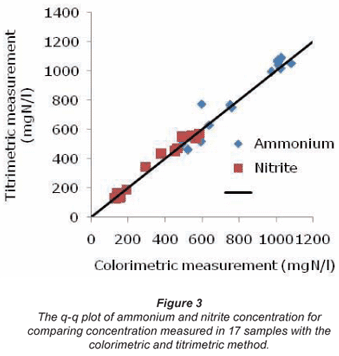
In Table 4 the corresponding student t-value, the Wilcoxon W+ and W- value and the R² linear correlation coefficient for the normal probability plot are given. From this table it can be seen that the R² value is below 0.94. As such the data cannot be considered normal. However, both the t-test and the Wilcoxon come to the same conclusion: the hypothesis that both methods are the same cannot be rejected.

In addition to cost-effective ammonium and nitrite measurements, the titrimetric measurement also offers the determination of phosphate, a component that was present in the influent of the ANR reactors. On average the phosphate concentration determined titrimetrically was 244 mg P/ℓ. This concentration is somewhat higher than the one present in the influent, possibly because of the concentrating effect of evaporation that occurs in the ANR reactors (Van Hulle et al., 2005)
ASD reactors
The experimental data obtained from the ASD reactors operated at the biogas lab was used in this study. First the components (ammonium, phosphate and volatile fatty acids) present and the related concentrations were calculated from the buffer capacity curves. For the volatile fatty acids, it was assumed that 2 monoprotic volatile fatty acids were present.
The curves for determining the volatile fatty acids concentration were obtained by performing a neutral down-titration of a 20 mℓ sample with a titrant concentration of 0.1 M. The curves for determining the ammonium concentration were obtained by performing an up-titration of a 20 mℓ sample with a titrant concentration of 0.1 M. Simultaneous determination of both concentrations with 1 up-titration was not possible.
The volatile fatty acids values obtained with the titrimetric method were compared to measurement results obtained with a gas chromatograph, measuring acetic acid, butyric acid and propionic acid. The sum of these 3 volatile fatty acids was taken as the measured volatile fatty acids concentration.
The ammonium values obtained with the titrimetric method were compared to measurement results obtained with a colorimetric method. The corresponding q-q plot is presented in Fig. 4. The results are somewhat more scattered than the results obtained with the ANR reactors, probably due to matrix effects as synthetic influent was used in the ANR reactors while real influent was used in the ASD reactors.

In Table 5 the corresponding student t-value, the Wilcoxon W+ and W- value and the R² linear correlation coefficient for the normal probability plot are given. From this table it can be seen that the R² value is above 0.95, but that ammonium is not normally distributed. Both the t-test and the Wilcoxon come to the same conclusion: the hypothesis that both methods are the same cannot be rejected.

These results show that titrimetry can be used as a low-cost and time-efficient alternative for gas chromatography for the determination of volatile fatty acids.
Conclusions
This study illustrates with different practical cases that titrimetric monitoring is a useful technique for efficient analysis of water and sludge samples. Furthermore, the results of this study were subjected to a thorough statistical analysis. Care should, however, be taken to use the appropriate statistical technique for data interpretation as not all data are normally distributed.
The titrimetric technique was first applied to standard solutions and revealed that, ammonium, phosphate and volatile fatty acids could be measured. It was demonstrated that nitrite and ammonium could be measured in samples from ANR reactors and that ammonium and volatile fatty acids could be measured in ASD reactors provided the correct titrant concentration is used.
Acknowledgements
This study was partially supported by the EU Interreg III project 'Master of Science in Water Management' and by the Institute for the Promotion of Innovation by Science and Technology in Flanders (IWT, contract number 080126).
References
BRERETON RG (2003) Chemometrics, Data Analysis for the Laboratory and Chemical Plant. Wiley, UK. 487 pp. [ Links ]
CURRELL G and DOWMAN A (2005) Essential Mathematics and Statistics for Science. Wiley, UK. 360 pp. [ Links ]
FILLIBEN JJ (1975) the probability plot correlation coefficient test for normality. Technometrics 111-117. [ Links ]
FYLSTRA D, LASDON L, WATSON J and WAREN A (1998) Design and use of the Microsoft Excel Solver. Interfaces 28 (5) 29-55. [ Links ]
GROB RL and BARRYEF (2004) Modern Practice of Gas Chromatography. Wiley, UK. 1045 pp. [ Links ]
HILKIAH IGONI A, AYOTAMUNO MJ, EZE CL, OGAJI SOT and PROBERT SD (2008) Designs of anaerobic digesters for producing biogas from municipal solid-waste. Appl. Energy 85 (6) 430-438. [ Links ]
KUAI L and VERSTRAETE W (1998) Ammonium removal by the oxygen-limited autotrophic nitrification-denitrification system. Appl. Environ. Microbiol. 64 4500-4506. [ Links ]
LAHAV O and LOEWENTHAL R (2000) Measurement of VFA in anaerobic digestion: The five point titration method revisited. Water SA 26 (3) 389-392. http://www.wrc.org.za/archives/watersa%20archive/2000/July/1357.pdf. [ Links ]
METCALF & EDDY Inc. (Revised by Tchobananoglous G and Burton FL) (2003) Wastewater Engineering: Treatment, Disposal And Reuse (3rd edn.). McGraw-Hill Series in Water Resources and Environmental Engineering. McGraw-Hill, New York, USA. [ Links ]
MOOSBRUGGER R, WENTZEL M, EKAMA G and MARAIS G (1993) Weak acid/bases and pH control in anaerobic system – A review. Water SA 19 (1) 1-10. [ Links ]
STANDARD METHODS (1992) Standard Methods for the Examination of Water and Wastewater (18th edn.). American Public Health Association (APHA), Inc. New York. [ Links ]
VAN DONGEN U, JETTEN MSM and VAN LOOSDRECHT MCM (2001) The SHARON®-Anammox® process for treatment of ammonium rich wastewater. Water Sci. Technol. 44 (1) 153-160. [ Links ]
VAN HULLE SWH, VAN DEN BROECK S, MAERTENS J, VILLEZ K, DONCKELS BMR, SCHELSTRAETE G, VOLCKE EIP and VANROLLEGHEM PA (2005) Construction, start-up and operation of a continuously aerated laboratory-scale SHARON reactor in view of coupling with an Anammox reactor. Water SA 31 (3) 327-334. http://www.wrc.org.za/downloads/watersa/2005/Jul-05/1836%20new.pdf [ Links ]
VAN HULLE SWH, ZAHER U, SCHELSTRAETE S and VANROLLEGHEM PA (2006) Titrimetric monitoring of a completely autotrophic nitrogen removal process. Water Sci. Technol. 53 (4-5) 533-540. [ Links ]
VAN VOOREN L, VAN DE STEENE M, OTTOY JP and VANROLLEGHEM PA (2001) Automatic buffer capacity model building for the purpose of water quality monitoring. Water Sci. Technol. 43 (7) 105-114. [ Links ]
ZAHER U, BOUVIER JC, STEYER J-P and VANROLLEGHEM PA (2004) Titrimetric monitoring of anaerobic digestion: VFA, alkalinities and more. In: Proc. 10thWorld Congress on Anaerobic Digestion (AD10). 29 August - 2 September, Montreal, Canada. [ Links ]
ZAHER UE and VANROLLEGHEM PA (2005) Automatic initialisation of buffer composition estimation for on-line analysis of unknown buffer solutions. Anal. Bioanal. Chem. 383 605-618. [ Links ]
Received 18 September 2008; accepted in revised form 6 February 2009.
* To whom all correspondence should be addressed.
+32 56 241251; fax: +32 56 241224;
e-mail: Stijn.Van.Hulle@Howest.be


