


Servicios Personalizados
Articulo
 Inglés (pdf)
 Articulo en XML
 Referencias del artículo
Indicadores

Links relacionados
-
 Citado por Google
 -
 Similares en Google
Compartir

 Permalink
Water SA
versión On-line ISSN 1816-7950
versión impresa ISSN 0378-4738
Water SA vol.35 no.3 Pretoria abr. 2009
Investigation into the metal contamination of the Plankenburg and Diep Rivers, Western Cape, South Africa
VA JacksonI; AN PaulseI; JP OdendaalII; W KhanIII, *
IDepartment of Biomedical Sciences, Faculty of Health and Wellness Sciences, Cape Peninsula University of Technology, Bellville 7535, South Africa
IIDepartment of Environmental and Occupational Studies, Faculty of Applied Sciences, Cape Peninsula University of Technology, Cape Town 8000, South Africa
IIIDepartment of Agricultural and Food Sciences, Faculty of Applied Science, Cape Peninsula University of Technology, Cape Town 8000, South Africa
ABSTRACT
Metal contamination in the Plankenburg and Diep Rivers (Western Cape) was investigated over a 12 and 9 month period, respectively. Aluminium (Al), copper (Cu), iron (Fe), lead (Pb), manganese (Mn), nickel (Ni) and zinc (Zn) concentrations were determined using the nitric acid digestion method and analysed by inductively coupled plasma atomic emission spectrometry (ICP-AES). For both rivers the Al and Fe concentrations were higher than that for all the other metals analysed for in sediment and water samples. The highest concentrations recorded in the Plankenburg River were 13.6 mg·ℓ-1 (water – Week 18, Site B) and 15 018 mg·kg-1 (sediment – Week 1, Site C) for Al, and 48 mg·ℓ-1 (water – Week 43, Site A) and 14 363.8 mg·kg-1 (sediment – Week 1, Site A) for Fe. The highest concentrations recorded in the Diep River were 4 mg·ℓ-1 (water – Week 1, Site A) and 19 179 mg·kg-1 (sediment – Week 1, Site C) for Al, and 513 mg·ℓ-1 (water – Week 27, Site A) and 106 379.5 mg·kg-1 (sediment – Week 9, Site C) for Fe. For most of the metals analysed the concentrations were higher than the recommended water quality guidelines as stipulated by the Department of Water Affairs and Forestry, the Canadian Council for the Ministers of the Environment and the accepted 'world average'. Point sources of pollution could not be conclusively identified, but runoff from both industrial and residential areas could have contributed to the increased concentrations. Metal concentrations should be routinely monitored and the guidelines should be updated and revised based on the current state of the rivers and pollution sources.
Keywords: ICP-AES, metal contamination, Plankenburg- and Diep River water, sediment, water and sediment quality guidelines
Introduction
South Africa's major water sources are primarily used for agricultural activities (52%), followed by industry, mining and power generation (12.5%), domestic and municipal uses (12%), with a further 15% needed to maintain estuaries and rivers (Schutte and Pretorius, 1997; Holtzhausen, 2002). The quality of the water resources is, however, steadily declining due to an increase in urbanisation and industrialisation, with the major sources of pollution including industrial and agricultural effluents and domestic and commercial sewage (DWAF, 2004). In addition, population increases in South Africa are expected to lead to an increase in agricultural development, which will in turn lead to an increased demand for irrigation water (FAO, 2007).
Point- and non-point source pollution contributes to a decline in water quality when leaching occurs into the surrounding environment (Hills et al., 1998; Ho et al., 2003). Agricultural contamination arises from the discharge of pesticides into rivers (ATSDR, 2000). In addition, pollutants such as micro-organisms, metals, oils and other toxic substances contribute to decreases in water quality (Pegram et al., 1999).
Metals are present in the environment in trace amounts and certain metals, such as iron (Fe), copper (Cu) and zinc (Zn), are essential for a variety of functions in organisms. It is important though to ensure that these metals do not exceed normal concentrations, as they may then have detrimental long-term effects on human health (Wright and Welbourne, 2002). Excessive consumption of cadmium (Cd) and lead (Pb) could result in neurological, bone and cardiovascular diseases, renal dysfunction and various cancers, even at relatively low levels (Calderon, 2000; Jarup, 2002). The short-term effects of high Cd concentrations also include diarrhoea, nausea, vomiting, renal failure, muscle cramps, salivation, sensory disturbances, convulsions, shock and liver injury (Hazards Centre and People's Science Institute, 2005). Short-term exposure to Cu fumes causes irritation of the eyes, nose and throat, and a flu-like illness called metal fume fever. Symptoms of metal fume fever include: fever, muscle aches, nausea, chills, dry throat and cough (US Department of Health and Human Services, 1978). Iron is an essential element, but ingestion of Fe at concentrations above permissible levels may cause many gastrointestinal disturbances, including vomiting, diarrhoea and abdominal pain. The prolonged intake of high doses of Fe can result in liver damage and kidney failure (Hazards Centre and People's Science Institute, 2005).
High concentrations of metals usually deposit on and then integrate in the river sediment. The sediment comprises organic or inorganic materials removed by erosion and transported by fluid flow to different locations (Prange and Dennison, 2000; Marchand et al., 2006). The highest metal content available for transport between sites is that which is stored in the sediment-water interface (Maanan et al., 2004). Increased levels of heavy metals were reported in the sediment of the Mooi River, South Africa (Wade et al., 2000). These increased levels of toxic metals in both the water and sediment presumably resulted from the release of mine water from a nearby goldmine into a tributary of the Mooi River. The levels of heavy metals reported did not differ appreciably from those found by a previous study conducted by Witmann and Förstner (1977), where concentrations recorded for water and sediment for Cu were 5.4 mg·ℓ-1 and 484 mg·kg-1 and for Zn were 26.0 mg·ℓ-1 and 6440 mg·kg-1, for water and sediment respectively. The authors concluded that the high concentrations could be due to the fact that the slimes dams receive discharges with high acidity from the mines.
Mzimela et al. (2003) conducted a study investigating the aluminium (Al), Fe, Mn, Zn, chromium (Cr), Cu, Pb, Cd and mercury (Hg) bioaccumulation patterns in sediment, water and fish samples collected on a quarterly basis from the Mhlathuze Estuary, South Africa.. The highest concentrations for Al (26 200 mg·ℓ-1 and 13 928.6 mg·kg-1), Fe (23 500 mg·ℓ-1 and 16 035.71 mg·kg-1) and Mn (266 mg·ℓ-1 and 182.8 mg·kg-1) in water and sediment respectively, were recorded in December, which coincided with an extremely high freshwater inflow from the Mhlathuze River. Metal concentrations were generally lower during April, which coincided with the reduced runoff from the catchment of the estuary. In fish tissue Fe and Al were recorded in concentrations ranging from 450 to 3 000 µg·g−1.
Jackson et al. (2007) investigated the degree of metal pollution (Al, Cu, Fe, Mn, Ni, Pb and Zn) at 4 different sampling points along the Berg River, as a recent decline in water quality has been reported. Inductively coupled plasma atomic emission spectrometry (ICP-AES) analysis of water, sediment and bio-film samples revealed that the highest mean metal concentrations recorded were for Al (6 mg·ℓ-1, 17 448.8 mg·kg-1 and 876.8 mg·ℓ-1) and for Fe (14.6 mg·ℓ-1, 26 473.3 mg·kg-1 and 1 017.5 mg·ℓ-1). The appreciably higher Al and Fe concentrations in comparison to the other metals analysed for, could be due to the leaching of metals into the river water from waste and household products associated with an informal settlement and the subsequent settling of these metals on sediment.
Cadmium, Hg and Zn concentrations in the Umtata, Buffalo, Keiskamma, and Tyume Rivers and in the Sandile and Umtata Dams were assessed by Fatoki and Awofolu (2003). These catchments support rapidly growing populations and concerns arose regarding the quality of their surface waters. Cadmium levels in the Umtata River and the Umtata Dam were normal, but in the Keiskamma, Buffalo and Tyume rivers elevated Cd concentrations of 0.007 mg·ℓ-1 to 0.009 mg·ℓ-1, 0.008 mg·ℓ-1 to 0.01 mg·ℓ-1 and 0.008 mg·ℓ-1 to 0.017 mg·ℓ-1 respectively, were recorded. These levels exceeded the South African guideline of 0.005 mg·ℓ-1 for Cd (DWAF, 1996a). According to the authors, use of river water with elevated Cd levels may have affected the health of the rural communities who use the river water prior to treatment, as Cd is extremely toxic and could cause adverse health effects (Friberg et al., 1986). Cadmium has been found to be toxic to fish and other aquatic organisms (Fianko et al., 2007). In humans, Cd can result in bone demineralisation, either through direct bone damage or indirectly as a result of renal dysfunction (Bernard, 2008). The levels of Hg and Zn recorded in these rivers were normal and did not exceed the recommended concentrations stipulated by the Department of Water Affairs and Forestry (DWAF, 1996b).
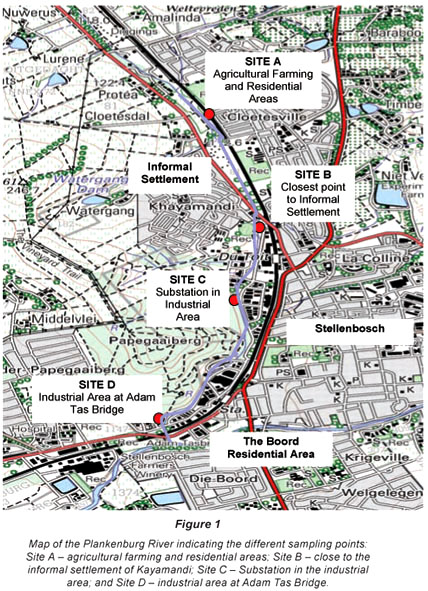
The Plankenburg River is 10 km long, and originates from a mountainous area in the Boland region, South Africa. Downstream it flows through Stellenbosch and services various industrial and agricultural activities. The river also flows through the informal settlement of Kayamandi, which has an estimated population size of 22 000. Twenty per cent of Kayamandi's inhabitants live in brick houses with in-house water connection and flush toilets. The remaining 80% of the inhabitants live in shacks in a densely populated area and utilise portable toilets (DWAF, 2001). Service delivery to the settlement is inadequate and skips provided by the local municipality for refuse are not frequently emptied or removed. Farmers up- and downstream from this settlement utilise the river water for the irrigation of vineyards, as well as other crops. In addition, the river flows through Stellenbosch's industrial area, which is the location for, amongst others, a clothing factory, a well-known cheese factory, yoghurt- and dairy-producing plants, and spray-painting and mechanical workshops.
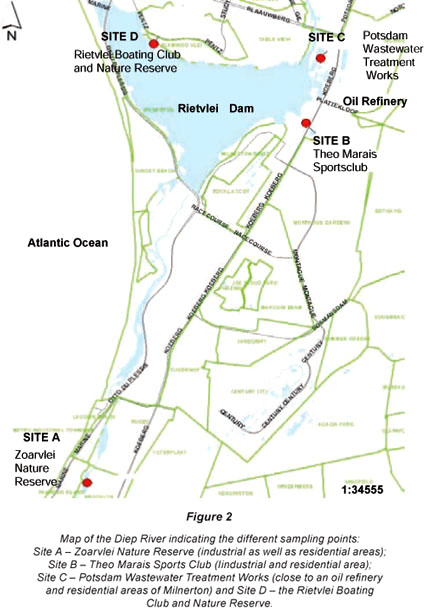
The Diep River is 65 km long, originating in the Riebeek-Kasteel Mountains, and flowing south-westerly through Malmesbury to ultimately drain into Table Bay. Land in the upper catchment area is dominated by agricultural activities, while in the lower part of the catchment land use is largely reserved for urban development, which includes formal and informal settlements, as well as industrial establishments, such as spray-painting, chemical and clothing manufacturers, a wastewater treatment works and an oil refinery. The Diep River-Rietvlei system has silted up significantly over the past few years due to extensive erosion (Grindley and Dudley, 1988). It can therefore be regarded as a storage area for sediment-rich water during floods. Vegetation in the vlei increases the sedimentation rate, especially where treated sewage water is released.
The aim of this study was to investigate the spatial and temporal variation in the metal contamination in the Plankenburg and Diep Rivers in the Western Cape, South Africa. Metal concentrations in water and sediment samples were analysed using the nitric acid digestion method followed by inductively coupled plasma atomic emission spectrometry (ICP-AES) (Saleh et al., 2000). The 2 rivers selected border industrial areas, residential areas, agricultural areas and informal settlements. Increased metal pollutants have a detrimental effect on human health (Wright and Welbourne, 2002), where exposure is mainly due to the ingestion of food and water contaminated with metals leaching into groundwater (Piver, 1992).
Materials and methods
Sampling Sites
Four sampling sites were identified for the Plankenburg River (Stellenbosch) location: Site A (agricultural farming and residential areas); Site B (informal settlement of Kayamandi); Site C (substation in industrial area) and Site D (industrial area at Adam Tas Bridge) (Fig. 1). Sampling of sites along the Plankenburg River started in May 2004 and continued for a period of 1 year until May 2005. Sites sampled for the Diep River (Milnerton) location were: Site A (Zoarvlei Nature Reserve - industrial as well as residential areas); Site B (Theo Marais Sports Club – industrial and residential area); Site C (Potsdam Wastewater Treatment Works) and Site D (Rietvlei Boating Club and Nature Reserve) (Fig. 2). Sampling of these sites started in March 2005 and continued for a period of 9 months until November 2005. Sampling at the Diep River initially started in May 2004, but due to adverse weather conditions one of the original sampling points dried up and another site had to be selected to replace it. Potsdam Wastewater Treatment Works was selected as Site C because effluent from a nearby oil refinery flows directly into a storm-water drain at the wastewater works. Results for the period before March 2005, was thus not reported on.
Sampling for metal concentration determination
Water samples were collected in sterile 250 mℓ narrow mouth square polypropylene bottles (Cole-Palmer Instrument Company). The sediment samples consisted of a combination of five different sub-samples collected from various points (±15 cm deep) in 250 mℓ plastic containers. The samples were stored at 4°C during transport. The temperature and pH were determined at each site using a YSI pH 100 portable pH mV and temperature instrument (YSI Environmental).
Metal concentration determination in water and sediment samples
The collected sediment samples were dried in an oven for 3 d and weighed using a fine analytical balance (RADWAG®). In order to determine the concentrations of Al, Zn, Cu, Fe, Pb, Ni and Mn (total metals), water (5 mℓ) and sediment samples (0.500 - 0.600 g; dry mass) were digested with 10 mℓ 55% nitric acid at 40°C for 60 min and then at 120°C for 180 min, using a Grant dry-block heater. A blank (control) of 10 mℓ 55% nitric acid was analysed along with the collected samples to check for possible contamination. The samples were cooled to room temperature, filtered with Whatman No. 6 filter paper into 20 mℓ volumetric flasks, made up to a volume of 20 mℓ with distilled water and subsequently filtered for a 2nd time using 0.45 mm cellulose nitrate ultra-filtration membrane filters (Whatman) (Odendaal and Reinecke, 1999). Metal concentrations were determined using inductively coupled plasma atomic emission spectrometry (ICP-AES) analysis according to the procedure outlined in Saleh et al. (2000). Analytical efficiency was checked using standard reference material (100 g contaminated soil standard). Metal concentrations are expressed in mg·ℓ-1 (water) and mg·kg-1 (sediment). Recovery rates measured were between 91 and 102% for the metals analysed in accordance with confidence limits of published values for the reference materials.
Statistical analysis
Repeated measures ANOVA (RMA) was performed on all data obtained as outlined in Dunn and Clark (1987), using StatisticaTM. In each RMA, the residuals were analysed to determine if they were normally distributed. In all hypothesis tests, a significant level of 5% was used as a standard. The results presented are the averages of 5 repeats for each particular sampling point at the different sampling sites for both water and sediment samples. For statistical analysis, the volumes (5 mℓ) and mass (0.500 to 0.600 g; dry mass) were taken into consideration for the calculation of the final metal concentrations in a given sample.
Results
Metal concentrations in water samples
Plankenburg River
Comparisons of the mean metal concentrations in water samples collected at Sites A, B, C and D along the Plankenburg River over time are presented in Tables 1, 2 and 5. The recorded Al and Fe concentrations were higher than the concentrations of all the other metals analysed for. The concentrations of Al ranged from 0.3 mg·ℓ-1 (Week 1, Site A) to 13.6 mg·ℓ-1 (Week 18, Site B), while for Fe the concentrations ranged from 0.3 mg·ℓ-1 (Week 39, Site B) to 48 mg·ℓ-1 (Week 43, Site A). The recorded concentrations for Al in water were higher than the recommended concentrations for Al of 0.1 mg·ℓ-1 to 0.15 mg·ℓ-1 (DWAF, 1996b) and 0.005 mg·ℓ-1 to 0.1 mg·ℓ-1 (CCME, 2001) throughout the entire study period (Table 5). The Fe concentrations also exceeded the guidelines of 0.3 mg·ℓ-1 (CCME, 2001) and the ' world average' of 0.04 mg·ℓ-1 (Martin and Windom, 1991). No Al guidelines were available for the 'world average' and no Al and Fe guidelines were available for the Australian and New Zealand Environment and Conservation Council (ANZECC, 2000). No guidelines for Fe in river water samples were available from DWAF.
The mean metal concentrations recorded for Cu, Mn, Ni and Zn in the Plankenburg River are presented in Tables 1, 2 and 5. Lead was not detected in any of the analysed samples for the Plankenburg River. The concentrations of Cu, Ni and Zn in the Plankenburg River water samples varied throughout the study period. The Cu concentrations ranged from 0.3 mg·ℓ-1 (Weeks 27 and 52, Site D) to 2.2 mg·ℓ-1 (Week 1, Site A) (Tables 1, 2 and 5). The Cu concentrations were higher than the recommended concentrations of 0.002 to 0.012 mg·ℓ-1, 0.002 to 0.004 mg·ℓ-1, 0.0015 mg·ℓ-1 and 0.0001 to 0.00015 mg·ℓ-1, as stipulated by DWAF (1996b), the CCME (2001), Martin and Windom (1991) and ANZECC (2000), respectively (Table 5). Mean Mn concentrations ranged from values below the detection limit to 0.4 mg·ℓ-1 (Site C) (Tables 1 and 2) at different weeks during the sampling period and always fell within the recommended water quality guideline of 1.3 mg·ℓ-1 as stipulated by DWAF (1996b) (Table 5). The recorded concentrations were, however, higher than the 'world average' of 0.0015 mg·ℓ-1 (Martin and Windom, 1991) (Table 5). No environmental quality guideline for Mn was available from the CCME (2001) or ANZECC (2000). The mean metal concentrations for Ni recorded throughout the study period ranged from 0.1 mg·ℓ-1 (Sites B, C and D) to 0.5 mg·ℓ-1 (Site A) and were generally above the recommended concentrations of 0.025 to 0.15 mg·ℓ-1, as stipulated by the CCME (2001), with the exception of weeks 27, 36, 43 and 52, where concentrations of 0.1 mg·ℓ-1 were recorded at sites B, C and D (Tables 1 and 2). The concentrations for Ni were significantly higher (p < 0.05) than the 'world average' guideline of 0.0005 mg·ℓ-1 (Martin and Windom, 1991) and the ANZECC (2000) guideline of 0.0001 to 0.0005 mg·ℓ-1 (Table 5). No environmental quality guideline for Ni was available from DWAF (1996b). The mean metal concentrations recorded for Zn ranged from below the detection limit to 1.1 mg·ℓ-1 (Tables 1, 2 and 5). Zinc concentrations fell within the recommended quality guideline of 0.03 mg·ℓ-1, 0.036 mg·ℓ-1, 0.0006 mg·ℓ-1 and 0.0009 mg·ℓ-1, as stipulated by the CCME (2001), DWAF (1996b), Martin and Windom (1991) and ANZECC (2000), respectively (Table 5), only once during the sampling period, when a concentration below the detection limit was recorded (Week 1, Site B). During the subsequent sampling weeks, the recorded concentrations all exceeded the recommended range (Tables 1 and 2).
Diep River
Comparisons of the mean metal concentrations in water samples collected at Sites A, B, C and D along the Diep River over time are presented in Tables 3, 4 and 5. At many sites the recorded Al, Zn and Fe concentrations were higher than all the other metals analysed for. The concentrations for Al ranged from below the detection limit during Week 9 at Site C to 4 mg·ℓ-1 during Week 1 at Site A (Table 5). The concentrations of Zn ranged from 0.1 mg·ℓ-1 to 4.4 mg·ℓ-1 (Weeks 9 and 27, respectively, Site A) (Table 3 and 5). The concentrations for Fe ranged from 0.1 mg·ℓ-1 to 513 mg·ℓ-1 (Weeks 9 and 27, respectively, Site A) (Table 3 and 5). Throughout the entire study period, the overall concentrations for Al were usually higher than the recommended concentrations of 0.1 mg·ℓ-1 to 0.15 mg·ℓ-1 (DWAF, 1996b) and 0.005 mg·ℓ-1 to 0.1 mg·ℓ-1 (CCME, 2001) (Table 5). The overall concentrations recorded throughout the study period for Zn were usually higher than the recommended concentrations of 0.03 mg·ℓ-1 (CCME, 2001), 0.036 mg·ℓ-1 (DWAF, 1996b), 0.0006 mg·ℓ-1 (Martin and Windom, 1991) and 0.0009 mg·ℓ-1 (ANZECC, 2000) (Table 5). The recommended concentrations of 0.3 mg·ℓ-1 (CCME, 2001) and the 'world average' of 0.04 mg·ℓ-1 (Martin and Windom, 1991) for Fe, were usually higher than the overall concentrations recorded during the entire study period (Table 5).
The mean metal concentrations recorded for Cu, Mn and Ni in water samples in the Diep River are represented in Tables 3, 4 and 5. Lead was not detected in any of the samples analysed for the Diep River. The recorded concentrations for Cu ranged from 0.1 mg·ℓ-1 during Weeks 1 and 36, at Sites C and D, respectively, to 0.8 mg·ℓ-1 during Week 32 at Site D (Table 4). These concentrations for Cu were higher than the recommended concentrations of 0.002 to 0.012 mg·ℓ-1, 0.002 to 0.004 mg·ℓ-1, 0.0015 mg·ℓ-1 and 0.0001 to 0.00015 mg·ℓ-1, as stipulated by DWAF (1996b), the CCME (2001), Martin and Windom (1991) and ANZECC (2000), respectively (Table 5). Similarly to the results obtained for Mn in the Plankenburg River, Mn concentrations recorded in the Diep River always fell within the recommended concentration limit of 1.3 mg·ℓ-1 (DWAF, 1996b) (Table 5), with the highest mean Mn concentration of 1.3 mg·ℓ-1 recorded during Week 27 at Site A (Table 3). The Mn concentrations however mostly exceeded the 'world average' of 0.0015 mg·ℓ-1 (Martin and Windom, 1991) (Table 5). The mean metal concentrations recorded for Ni fluctuated throughout the entire study period, ranging from values below the detection limit to 0.4 mg·ℓ-1 during Weeks 23 and 32 at Sites D and C, respectively. The recorded concentrations exceeded the recommended concentration of 0.025 to 0.15 mg·ℓ-1 (CCME, 2001), 0.0005 mg·ℓ-1 (Martin and Windom, 1991) and the Australian and New Zealand guidelines of 0.0001 to 0.00015 mg·ℓ-1 (ANZECC, 2000) during Weeks 5, 14, 18, 23, 27 and 32 at various sampling sites.
Metal concentrations in sediment samples
Plankenburg River
Comparisons of the mean metal concentrations for Al, Fe, Mn, Zn, Cu, Ni and Pb are presented in Figs. 3, 4 and 5, for sediment samples collected from various sites along the Plankenburg River. No recommended sediment quality guidelines for Al, Fe, Mn, Pb, Ni, Cu and Zn were available from DWAF (1996b) and the 'world average' (Martin and Windom, 1991), and only guidelines for Cu and Zn were available from the CCME (2001). Guidelines for Cu, Pb, Ni and Zn were available from ANZECC (2000). The highest Al concentration of 15 018 mg·kg-1 was recorded during Week 1 at Site C (Fig. 3). The lowest mean Al concentration of 1 609 mg·kg-1 was recorded during Week 52 at Site D (Fig. 3). The mean concentrations recorded for Fe during the entire study period ranged from 3 763 mg·kg-1, recorded at site D during Week 52, to 19 179 mg·kg-1 recorded during Week 1 at Site C (Fig. 3).
The highest Mn concentration of 225 mg·kg-1 was recorded during Week 5 at Site A, while the lowest Mn concentration of 15.93 mg·kg-1 was recorded during Week 22 at Site B in the Plankenburg River (Fig. 4). The highest Zn concentration recorded in the Plankenburg River was 269.5 mg·kg-1 during Week 1 at Site B (Fig. 4). The highest recorded concentration was significantly higher (p < 0.05) than the recommended environmental quality guideline of 123 mg·kg-1 in freshwater sediment as stipulated by the CCME (2001) and 200 mg·kg-1 as stipulated by ANZECC (2000). The mean metal concentrations recorded for Zn fluctuated throughout the study period, exceeding the recommended concentrations intermittently, with the exception of Site A where all the concentrations fell below the recommended concentrations of the CCME (2001) and ANZECC (2000).
The highest Pb concentration in the Plankenburg River was recorded at 275 mg·kg-1 during Week 9 at Site C, with the lowest concentration of 7.38 mg·kg-1 recorded during Week 52 at Site C (Fig. 5). The highest Pb concentration exceeded the Australian and New Zealand quality guideline of 50 mg·kg-1 (ANZECC, 2000). The highest (11.7 mg·kg-1) and lowest (0.62 mg·kg-1) Ni concentrations were recorded during Weeks 1 and 52 at Sites C and D, respectively (Fig. 5). The highest Ni concentration was lower than the quality guideline as stipulated by ANZECC (2000).
The highest Cu concentration of 251.8 mg·kg-1 was recorded during Week 9 at Site C (Fig. 5). This concentration was significantly higher (p < 0.05) than the recommended environmental quality guideline of 35.7 mg·kg-1 in freshwater sediment as stipulated by the CCME (2001) and the Australian and New Zealand quality guideline of 65 mg·kg-1 (ANZECC, 2000). The Cu concentrations fluctuated throughout the entire study period. At Sites A, B and D of the Plankenburg River, concentrations were generally lower than the recommended guidelines, while Cu concentrations recorded at Site C were in most cases higher than the recommended guidelines (Fig. 5).
Diep River
Comparisons of the mean metal concentrations for Al and Fe, Mn and Zn and Cu, Ni and Pb are presented in Figs. 6, 7 and 8, respectively, for sediment samples collected from various sites along the Diep River. No quality guidelines for Al, Cu, Fe, Mn, Ni, Pb and Zn were available from DWAF and the 'world average' (Martin and Windom, 1991) and guidelines for only Cu and Zn were available from the CCME (2001). Guidelines for Cu, Ni, Pb and Zn were available from ANZECC (2000). The highest mean Al concentration of 14 363.8 mg·kg-1 was recorded during Week 1 at Site A in the Diep River (Fig. 6). The lowest mean Al concentration was recorded at 175.5 mg·kg-1 during Week 1 at Site D (Fig. 6). The mean metal concentrations recorded for Fe ranged from 299.3 mg·kg-1 during Week 14 at Site B to 106 379.5 mg·kg-1 during Week 9 at Site C (Fig. 6).
The highest mean concentrations for Mn and Zn, were 1 353.5 mg·kg-1 and 1 081.2 mg·kg-1 during Week 1 at Sites C and A, respectively (Fig. 7). The highest mean Zn concentration of 1 081.2 mg·kg-1 was significantly (p < 0.05) higher than the recommended Canadian sediment quality guidelines of 123 mg·kg-1 (CCME, 2001) and the Australian and New Zealand guideline of 200 mg·kg-1 (ANZECC, 2000). The mean metal concentrations recorded for Zn fluctuated above and below the recommended concentration for most of the sampling sites, except for Site D at the Diep River, where all the concentrations fell below the recommended concentration.
The highest mean metal concentration of 643.06 mg·kg-1 recorded for Pb during Week 1 at Site A was higher than the recommended concentration of 50 mg·kg-1 as stipulated by ANZECC (2000). For Ni, the highest mean concentration of 15.81 mg·kg-1, recorded during Week 9, at Site C (Fig. 8), was lower than the ANZECC guideline of 21 mg·kg-1 (ANZECC, 2000). The highest Cu concentration recorded in the Diep River was 370.5 mg·kg-1 during Week 1 at Site B (Fig. 8). This concentration was significantly higher (p < 0.05) than the recommended Canadian environmental quality guideline of 35.7 mg·kg-1 in freshwater sediment as stipulated by the CCME (2001) and 65 mg·kg-1, as stipulated by ANZECC (2000). The Cu concentrations also fluctuated above and below the recommended guideline at Sites A, B and C. Copper concentrations did not exceed the recommended guideline at Site D (Fig. 8).
Discussion
Metal concentrations in water samples
For all the sites investigated along the Plankenburg River the results for metal concentrations fluctuated throughout the study period and no specific point sources of pollution could be identified. The different sites were situated close to agricultural areas and residential areas (Site A), the informal settlement of Kayamandi (Site B), the substation in the industrial area of Stellenbosch (Site C) and the industrial area at the Adam Tas Bridge (Site D). In a previous investigation into the metal contamination of the Berg River in the Western Cape, Jackson et al. (2007) showed that Mn, Al and Fe were recorded at higher concentrations at an agricultural area situated along this river system. Correspondingly, the agricultural area (Site A) situated along the Plankenburg River was found to be one of the possible sources of Cu, Zn, Ni and Fe pollution, as elevated concentrations of these metals were recorded at this particular site. Similarly to farmers in the Paarl/Wellington area for the Berg River, the farmers in Stellenbosch use the same pesticides, such as MancozebTM and Copperflo among others, to treat their crops. Copper is a major component of Copperflo, while MancozebTM is composed of 60% Mn and Zn (Acrobat®MZ, 2005). Vermeulen et al. (2001) stated that 1 343·103 kg MancozebTM/a is utilised in agricultural areas in the Western Cape. The Fisheries and Aquaculture Department (2007) of Botswana compiled a review of heavy metals in aquatic systems, where they identified the major sources of pollution and most commonly documented pollutants in aquatic systems. They found that fertilisers and biocides, which include pesticides and herbicides, are a major source of Cd, Hg, Pb, Al, arsenic (As), Cr, Cu, Mn, Ni, Zn and tin (Sn) pollution.
A storm-water drain flowing directly from the informal settlement of Kayamandi enters the river at Site B. Effluent from household products and waste could leach into the river via this storm-water drain and influence the metal concentrations at this site. Site C is situated close to the industrial area which includes amongst others spray-painters, panel-beaters and yoghurt manufacturers. All the metals analysed were found at elevated concentrations at Site C and effluent or waste from the surrounding areas may enter the river due to the leaching of waste from the surrounding factories into the river system. The increased and continued pollution of the Plankenburg River can adversely affect the primary uses of the river, such as supplying water for irrigation. The concentrations recorded during the study generally fell within the guidelines for irrigation water for DWAF (1996c) and ANZECC (2000) for all the metals analysed, except for Fe, where the highest concentrations of 48 mg·ℓ-1 exceeded the recommended guidelines of 20 mg·ℓ-1 (DWAF, 1996c) and 10 mg·ℓ-1 (ANZECC, 2000). The increased Fe concentration could result in the deposition of an Fe coating on plants, which can interfere with photosynthesis, leading to plant damage and death. This can in turn negatively impact the export of fruit and wine due to the production of below par products, which could influence South Africa's economy (DWAF, 2001).
As with the Plankenburg River, the point sources of pollution at the Diep River could not be conclusively identified. The different sites were situated close to the Zoarvlei Nature Reserve (Site A - industrial and residential areas), the Theo Marais Sports Club (Site B - industrial and residential areas), the Potsdam Wastewater Treatment Works (Site C) and the Rietvlei Boating Club and Nature Reserve (Site D). No direct correlation between rainfall, pH or temperature could be drawn for either river, as the concentrations recorded in the water samples fluctuated throughout the study period. From the results it was concluded that Sites A and B contributed to the Al, Fe and Zn pollution in the Diep River, especially during Weeks 1 and 27. According to the Fisheries and Aquaculture Department (2007) of Botswana, industrial wastes, such as pigments, paints, alloys, solders and batteries, are the primary sources of Pb, Zn, Mn, Al, Cu and Fe in the environment. In the Diep River, the pollution incidences at the various sites could have been influenced by the leaching of industrial effluent from the surrounding industries into the river. These industries include numerous panel-beaters, Al works, chemical manufacturers (cleaning materials), petrol stations and cold storage facilities. As with the Plankenburg River, pollution could possibly be attributed to improper waste discharge and the leaching of effluent and waste products into the river.
Metal contamination in sediment samples
Comparison of the overall results obtained at the various sites, showed that the point sources of pollution at the Plankenburg River could not conclusively be identified as concentrations at the various sites fluctuated throughout the entire study period. The increased concentrations for Al and Fe at the different sites, relative to the other metals analysed for, could be ascribed to elevated Al and Fe pollution at the different sampling times. For both Al and Fe, the highest mean metal concentrations were recorded at Site C of the Plankenburg River, which is situated close to the industrial area in Stellenbosch. At Site A (located in the agricultural area), the source of Al, Mn and Fe contamination of the Plankenburg River could be the leaching of pesticides, fertilisers and algaecides, utilised in the surrounding farming areas, into the river (Jackson et al., 2007). The concentrations recorded for Cu and Zn at the agricultural area fell within the recommended guidelines of the CCME (2001) and ANZECC (2000). The concentrations of Fe and Al were, however, recorded in significantly higher (p < 0.05) concentrations. Iron and Al are also 2 of the most abundant naturally occurring elements in the environment (ATSDR, 1995). Iron is the most abundant element in the Earth's crust (35%) with Al as the third most abundant element(7.3%). At Site B (the informal settlement), Fe, Zn and Pb could have leached into the river via a nearby storm-water drain, through which waste from the settlement is discarded. The galvanised sheeting used in housing materials in the informal settlement is composed of Fe coated with Zn, to provide resistance to abrasion (Hot Dip Galvanizing Today, 2005). These results were similar to that obtained from a report compiled by the Nairobi River Basin Programme Phase II Pollution Monitoring Stakeholders in 2003. Monitoring of the water and sediment quality of the Moitoine and Ngong Rivers showed that Fe and Zn concentrations were high at a site situated in the Kibera informal settlement. The authors attributed this to the use of Fe sheets galvanised with Zn as roofing and building materials in the settlement. The industrial area situated along the banks of the Plankenburg River houses various industries from which effluent could be discharged into the river accounting for the increased metal concentrations.
A comparison of the overall results obtained at the various sites along the Diep River could not conclusively identify any definite point source of metal contamination. As with results obtained at the Plankenburg River the elevated metal concentrations at specific sites during the sampling period could be attributed to pollution incidents. No direct correlation between rainfall, pH or temperature could be drawn for either river, as concentrations recorded in the sediment samples fluctuated throughout the study period. Increased concentrations could be due to the leaching of industrial waste into the river at Sites A and B, which are situated close to the industrial area. These industries include amongst others spray-painting, paint manufacturers, a pharmaceutical company, chemical manufacturing companies and concrete manufacturers. The highest mean concentrations recorded for Al along the Diep River were at Sites A and C, which are situated close to the industrial area and the oil refinery, respectively. The highest mean concentrations for Fe recorded along the Diep River were at Site C (Potsdam Wastewater Treatment Works), which is situated close to an oil refinery.
Aluminium products are also used in production equipment and as containers for chemicals and food beverage products in the area. Corrosion of Al is a result of the combination of sulphur dioxide, chlorides, phosphates, nitrates and other industrial emissions with precipitation or dew, resulting in increased Al concentrations in the sediment samples as Al could leach into the surrounding environment. The surrounding industrial activities could all have an impact on the water source and the surrounding environment. Waste from a nearby oil refinery could also enter the river via stormwater drains at Site C, the Potsdam Wastewater Treatment Works.
According to the Fisheries and Aquaculture Department (2007) of Botswana, the metals associated with oil refinery discharge are Fe, Ni, Pb, Mn and Zn. Mwamburi (2003) found increased concentrations of Fe, Mn, Zn, Cr and Al in sediment samples of the Kasat River, Kenya. The increases in metal concentrations in comparison with unpolluted sites could be correlated to the direct waste input into the Kasat River from municipal and industrial sources. Singh et al. (2005) studied the concentrations of Cd, Cr, Cu, Fe, Pb, Mn, Ni and Zn in water and bed sediments of the Gomti River (India). Water and sediment samples were collected from 10 different locations and analysed using ICP-AES. The heavy metal concentrations found in the river water were 0.0001 to 0.0005 mg·ℓ-1 (Cd), 0.0015 to 0.0688 mg·ℓ-1 (Cr), 0.0013 to 0.0.0043 mg·ℓ-1 (Cu), 0.0791 to 0.3190 mg·ℓ-1 (Fe), 0.0038 to 0.0.0973 mg·ℓ-1 (Mn), 0.0066 to 0.011 mg·ℓ-1 (Ni), 0.0158 to 0.0276 mg·ℓ-1 (Pb) and 0.0144 to 0.0298 mg·ℓ-1 (Zn). In the sediment samples, the concentrations were 0.7 to 7.9 µg·g-1 (Cd), 6.1 to 0.60 µg·g-1 (Cr), 3.7 to 35.7 µg·g-1 (Cu), 5051.5 to 8291.5 µg·g-1 (Fe), 134.9 to 320.5 µg·g-1 (Mn), 13.9 to 37.4 µg·g-1 (Ni), 21.3 to 92.2 µg·g-1 (Pb) and 15.7 to 99.4 µg·g-1 (Zn). The authors concluded that the high concentrations were due to a discharge of industrial effluent from various sources, including municipal waste, untreated sewage and agrochemical runoff from nearby cities and villages into the river water. Based on the geo-accumulation indices, the Gomti River sediment from Neemsar to Jaunpur was polluted with Pb (moderately), Cd (moderately polluted to highly polluted) and Ni (highly polluted).
Davies et al. (2006) evaluated the accumulation of Cr, Cd and Pb in water, sediment and periwinkle (Tympanotonus fuscatus var. radula; shell and soft tissues) from 4 stations along Elechi Creek (Nigeria) which receive effluent from heavily industrialised and highly populated settlements. Chromium, Cd and Pb concentrations in sediment, water and periwinkles were determined using atomic absorption/emission spectrophotometry (Buck Scientific instrumentation). The results showed that the concentrations of Cr were highest in both the sediment and water samples at all the sampling sites, where concentrations of 0.01 mg·kg-1 were recorded. The concentrations of these metals were higher in the periwinkles, which are consumed by the surrounding human population. The authors concluded that the metal concentrations in sediment must be monitored on a regular basis to ensure contaminant-free periwinkles. As reported herein for the Plankenburg and Diep Rivers, the concentrations recorded in the sediment samples of Elechi Creek exceeded the concentrations recorded in the water samples.
The effect of anthropogenic inputs on the accumulation of metals in sediment at the Hugli River (India), were studied by Sarkar et al. (2004). Of the 8 stations studied, all the elements (Al, Fe, Mn, Zn, Cr, Pb, Ni, Sn, gallium (Ga), vanadium (V), bismuth (Bi), cerium (Ce) and As) analysed for displayed elevated concentrations at the Gangasagar Site (mouth of the river). This was presumably due to the metal-containing effluent or discharge from upstream oil refineries, fertiliser and pesticide use, a sulphuric acid plant, a battery manufacturing plant, tanneries and thermal power plants. In the present study, the exact point sources of pollution could also not be conclusively identified. The industrial and residential areas, waterworks and oil refinery could all have contributed to the metal contamination of the river. The elevated levels of metals could therefore be attributed to anthropogenic sources. In the present study, the recorded concentrations for metals in sediment samples for Cu and Zn at both rivers exceeded the recommended concentrations of the CCME (2001), ANZECC (2000) and Micó et al. (2007), while the Pb concentration exceeded the recommended guidelines of ANZECC (2000) and the baseline values determined by Micó et al. (2007).
Baseline values for heavy metals were proposed by Micó et al. (2007) to identify soil contamination in Alicante, Spain. Cadmium, Co, Cr, Cu, Fe, Mn, Ni, Pb and Zn concentrations were determined using atomic absorption spectrometry. The baseline values identified were 0.7 mg·kg-1, 11 mg·kg-1, 36 mg·kg-1, 28 mg·kg-1, 19 822 mg·kg-1, 402 mg·kg-1, 31 mg·kg-1, 28 mg·kg-1 and 83 mg·kg-1 for Cd, Co, Cr, Cu, Fe, Mn, Ni, Pb and Zn, respectively. The authors concluded that the baseline concentrations would be useful for comparison with the sampled concentrations of metals for which there are no recommended quality guidelines, such as Al, Fe and Mn. The values could also provide a basis to identify contaminated sites. The concentration of Fe in the soil recorded by Micó et al. (2007) was comparable to the concentrations of Fe recorded in the Plankenburg River, but lower than the concentration of Fe recorded in the Diep River. The Mn concentrations recorded at the Plankenburg River w lower than the Micó et al. (2007) results, but for the Diep River Mn exceeded the baseline concentration recorded by Micó et al. (2007). The highest Cu, Pb and Zn concentrations recorded for both rivers were significantly higher (p < 0.05) than the baseline concentration stipulated by Micó et al. (2007), while for Ni the recorded concentrations at both rivers were below the baseline concentrations of Micó et al. (2007). Results from the present study indicate that the metal concentrations in the river systems should be routinely monitored.. The national guidelines should be updated or revised to accurately reflect the current state of the rivers and pollution sources.
Conclusions
The major conclusions of the study include the following:
• Aluminium and Fe concentrations were higher than the concentrations of all the other metals analysed for in the water samples collected from the Plankenburg River, and exceeded the guidelines stipulated by DWAF and the CCME (Al and Fe) and the 'world average' (Fe)
• Concentrations of Cu and Zn (with the exception of Week 1, Site B) in the Plankenburg River water samples exceeded the guidelines stipulated by the CCME, DWAF, ANZECC and the 'world average'
• Concentrations of Mn fell within the DWAF guidelines, as well as the 'world average'. No guidelines for Mn were available from the CCME
• No Pb could be detected in any of the Plankenburg and Diep River water samples
• The highest mean metal concentrations in sediment samples were recorded for Al and Fe at Site C (substation in the industrial area) on the Plankenburg River
• The highest mean metal concentrations in water samples were recorded for Al, Fe and Zn at Site A (industrial area) in the Diep River, which exceeded the guidelines stipulated by DWAF, the CCME, ANZECC and the 'world average', and for Fe and Zn, the baseline values of Micó et al. (2007)
• Concentrations for Cu in water samples from the Diep River exceeded the recommended concentrations for ANZECC, DWAF, the 'world average' and the CCME, while Ni concentrations fluctuated above and below the recommended guidelines at Sites A, B, C and D. Manganese concentrations fell within the recommended guideline during the sampling period, with the exception of Week 27, where the Mn concentration was 1.3 mg·ℓ-1, at Site A.
• The highest mean Al concentration in sediment samples from the Diep River was recorded at Site A (industrial area) and the highest mean Fe concentration was recorded at Site C (wastewater treatment works). The highest Fe concentration was significantly higher (p < 0.05) than the baseline value obtained by Micó et al. (2007).
• Possible sources of contamination of the Plankenburg River could be the leaching of household waste into the river from the informal- and formal residential settlements, as well as the leaching of industrial effluent from the industries situated close to the river
• In addition, contamination of the Plankenburg River could also have been due to the excessive use of pesticides and insecticides on farms bordering the river system and the discarding of these pesticides into the rivers
• Possible sources of contamination of the Diep River could have been the leaching of industrial waste from various industries into the sampled sites along the banks of the river, as well as waste from the nearby oil refinery
• Metal concentration analysis should be routinely performed to ensure an accurate assessment of the current state of the rivers, and quality guidelines adapted accordingly on the basis of these results.
Acknowledgements
The National Research Foundation (NRF) and Cape Peninsula University of Technology (CPUT) are thanked for financial support. Shirley Clark and Koos Retief (Blaauwberg Nature Conservation Group) are thanked for their assistance.
References
ACROBAT® MZ (2005) Fungicide for use on potatoes and flue cured tobacco. URL: http://www.engageagro.com/media/pdf/label/acrobatmz_label_english.pdf [ Links ]
ATSDR (AGENCY FOR TOXIC SUBSTANCES AND DISEASE REGISTRY, USA) (1995) Aluminium Material Safety Data Sheet. Atlanta, Georgia, USA. [ Links ]
ATSDR (AGENCY FOR TOXIC SUBSTANCES AND DISEASE REGISTRY, USA) (2000) Toxicological Profile for Manganese. US Department of Health and Human Services, Public Health Service, Atlanta, Georgia, USA. [ Links ]
ANZECC (AUSTRALIAN AND NEW ZEALAND ENVIRONMENT AND CONSERVATION COUNCIL) (2000) Australian and New Zealand Guidelines for Fresh and Marine Water Quality. National Water Quality Management Strategy Paper No 4. Australian and New Zealand Environment and Conservation Council & Agriculture and Resource Management Council of Australia and New Zealand, Canberra, Australia. [ Links ]
BERNARD A (2008) Cadmium and its adverse effects on human health. Indian J. Med. Res. 128 557-564. [ Links ]
CALDERON RL (2000) The epidemiology of chemical contaminants of drinking water. Food Chem. Toxicol. 38 S13-S20. [ Links ]
CCME (CANADIAN COUNCIL OF MINISTERS OF THE ENVIRONMENT) (2001) Canadian Sediment Quality Guidelines for the Protection of Aquatic Life: Summary Tables. Canadian Environmental Quality Guidelines, 1999. Canadian Council of Ministers of the Environment, Winnipeg, Canada. [ Links ]
DAVIES OA, ALLISON ME and UYI HS (2006) Bioaccumulation of heavy metals in water, sediment and periwinkle (Tympanotonus fuscatus var. radula) from the Elechi Creek, Niger Delta. Afr. J. Biotechnol. 5 (10) 968-973. [ Links ]
DWAF (DEPARTMENT OF WATER AFFAIRS AND FORESTRY, SOUTH AFRICA) (1996a) South African Water Quality Guidelines. Volume 1:- Domestic Use (2nd edn.) Department of Water Affairs and Forestry, Pretoria, South Africa. [ Links ]
DWAF (DEPARTMENT OF WATER AFFAIRS AND FORESTRY, SOUTH AFRICA) (1996b) South African Water Quality Guidelines. Volume 7: Aquatic Ecosystems (1st edn.) Department of Water Affairs and Forestry, Pretoria, South Africa. [ Links ]
DWAF (DEPARTMENT OF WATER AFFAIRS AND FORESTRY, SOUTH AFRICA (1996c) South African Water Quality Guidelines. Volume 4: Agricultural Water Use: Irrigation (2nd edn.)Deparment of Water Affairs and Forestry, Pretoria, South Africa. [ Links ]
DWAF (DEPARTMENT OF WATER AFFAIRS AND FORESTRY, SOUTH AFRICA) (2001) Managing the Water Quality Effects of Settlements: Managing the Water Quality Impacts of Pollution in Two Towns. Technical Supporting Document. Department of Water Affairs and Forestry, Pretoria, South Africa. pp. 21-27. [ Links ]
DWAF (DEPARTMENT OF WATER AFFAIRS AND FORESTRY, SOUTH AFRICA) (2004) National Water Resource Strategy (1st edn.), South Africa's water situation and strategies to balance supply and demand Chapter 2 . pp. 15-54. [ Links ]
DUNN OJ and CLARK VA (1987) Applied Statistics: Analysis of Variance and Regression (2nd edn.). John Wiley and Sons, London, England. [ Links ]
FAO (FOOD AND AGRICULTURE ORGANIZATION OF THE UNITED NATIONS) (2007) Unlocking the water potential of agriculture. Natural Resources Management and Environment Department, Food and Agriculture Organization of the United Nations. URL:http://www.fao.org/docrep/006/y4525e/y4525e05.htm (Accessed on 20 February 2008). [ Links ]
FATOKI OS and AWOFULU R (2003) Levels of Cd, Hg and Zn in some surface waters from the Eastern Cape Province, South Africa. Water SA 29 (4) 375-380. http://www.wrc.org.za/archives/watersa%20archive/2003/october/4.pdf [ Links ]
FIANKO JR, OSAE S, ADOMAKO D, ADOTEY DK and SERFOR-ARMAH Y (2007) Assessment of Heavy Metal Pollution of the Iture Estuary in the Central Region of Ghana. Environ. Monit. Assess. 131 467-473. [ Links ]
FISHERIES AND AQUACULTURE DEPARTMENT (BOTSWANA) (2007) Review of Heavy Metals. URL: file://F:\Report (No 22) on the 9th Steering Committee Meeting, Gaborone, Botswana. [ Links ]
FRIBERG L, ELINDER CG, KJELLSTROEM T and NORDBERG GF (eds.) (1986) Cadmium and Health: A Toxicological and Epidemiological Appraisal. Volume 11: Effects and Response. CRC Press, Boca Raton, Florida. [ Links ]
GRINDLEY JR and DUDLEY S (1988) Report No. 28 Rietvlei (CW 24) and Diep (CW 25). In: Heydorn AEF and Morant PD (eds.) Estuaries of the Cape. Part 2. Synopses of Available Information on Individual Systems. CSIR Research Report No. 427. CSIR, Pretoria, South Africa. 90 pp. [ Links ].
HAZARDS CENTRE and PEOPLE'S SCIENCE INSTITUTE (2005) Ground Water Resources in Plachimada Coca Cola stores toxics for future generations - Effects on Human Health. URL: http://www.indiaresource.org/documents/PlachimadaReportWaterPollution.pdf (Accessed on 16 April 2009) [ Links ]
HILLS P, ZHANG L and LIU JH (1998) Transboundary pollution between Guangdong Province and Hong Kong: threats to water quality in the Pearl River Estuary and their implications for environmental policy and planning. J. Environ. Plan. Manage. 41 (3) 375-396. [ Links ]
HO KC, CHOW YL and YAU JTS (2003) Chemical and microbiological qualities of the East River (Dongjiang) water, with particular reference to drinking water supply in Hong Kong. Chemos. 52 1441-1450. [ Links ]
HOLTZHAUSEN L (2002) The war for water. Fighting the battle for the last drop. WASE 22 29-29. [ Links ]
HOT DIP GALVANISING TODAY (2005) Corrugated iron has stood the test of time. URL: http://www.hdgasa.org.za/Journals/indSearchs/C/Corrugated%20Iron.pdf (Accessed 16 April 2009). [ Links ]
JACKSON VA, PAULSE AN, VAN STORMBROEK T, ODENDAAL JP and KHAN W (2007) Investigation into metal contamination of the Berg River, Western Cape, South Africa. Water SA 33 (2) 175-182. http://www.wrc.org.za/downloads/watersa/2007/Apr%2007/2009b.pdf [ Links ]
JARUP L (2002) Cadmium overload and toxicity. Nephrol. Dial. Transpl. 17 (Suppl.2) 35-39. [ Links ]
MAANAN M, ZOURARAH B, CARRUESCO C, AAJJANE A and NAUD J (2004) The distribution of heavy metals in the Sidi Moussa lagoon sediments (Atlantic Moroccan Coast). J. Afr. Earth Sci. 39 473-483. [ Links ]
MARCHAND C, LALLIER-VERÈGS E, BALTZER F, ALBÉRIC P, COSSA D and BAILLIF P (2006) Heavy metals distribution in mangrove sediments along the mobile coastline of French Guiana. Mar. Chem. 98 1-17. [ Links ]
MARTIN JM and WINDOM HL (1991) Present and future roles of ocean margins in regulating marine biogeochemical cycles of trace elements. In: Mantoura RFC, Martin JM and Wollast R (eds.) Ocean Margin Processes in Global Change. John Wiley & Sons Ltd., New Jersey, USA. [ Links ]
MICÓ C, PERIS M, RECATALÁ L, SÁNCHEZ J (2007) Baseline values for heavy metals in agricultural soils in an European Mediterranean region. Sci. Tot. Environ. 378 13-17. [ Links ]
MWAMBURI J (2003) Variations in trace elements in bottom sediments of major rivers in Lake Victoria's basin, Kenya. Lakes & Reservoirs: Res. Manage. 8 5-13. [ Links ]
MZIMELA HM, WEPENER V and CYRUS DP (2003) Seasonal variation of selected metals in sediments, water and tissues of the groovy mullet Liza dumerelii (Mugilidae) from the Mhlathuze Estuary, South Africa. Mar. Poll. Bull. 46 (5) 659-664. [ Links ]
NAIROBI RIVER BASIN PROGRAMME PHASE II POLLUTION MONITORING STAKEHOLDERS (2003) Nairobi River Basin Programme – Phase II (UoN/UNEP project Feb – Nov. 2003) Final Report. pp. 1–74. [ Links ]
ODENDAAL JP and REINECKE AJ (1999) The sublethal effects and accumulation of cadmium in the terrestrial isopod Porcellio laevis Latr. (Crustacea, Isopoda). Arch. Environ. Contam. Toxicol. 36 64-69. [ Links ]
PEGRAM GC, QUIBELL G and HINSCH M (1999) The nonpoint source impacts of peri-urban settlements in South Africa: implications for their management. Water Sci. Technol. 39 283-290. [ Links ]
PIVER WT (1992) Contamination and restoration of groundwater aquifers. Environ. Health. Perspect. 100 237-247. [ Links ]
PRANGE JA and DENNISON WC (2000) Physiological responses of five seagrass species to trace metals. Mar. Pollut. Bull. 41 327-336. [ Links ]
SALEH MA, EWANE E, JONES J and WILSON BL (2000) Monitoring Wadi El Raiyan lakes of the Egyptian desert for inorganic pollutants by ion-selective electrodes, ion chromatography and inductively coupled plasma spectroscopy. Ecotoxicol. Environ. Saf. 45 310-316. [ Links ]
SARKAR KS, FRANČIKOVIĆ-BILINSKI S, BHATTACHARYA A, SAHA M and BILINSKI H (2004) Levels of elements in the surficial estuarine sediments of the Hugli River, northeast India and their environmental implications. Environ. Intern. 30 1089-1098. [ Links ]
SCHUTTE CF and PRETORIUS WA (1997) Water demand and population growth. Water SA 24 2 (2) 65-268. http://www.wrc.org.za/downloads/watersa/1997/Vol%2023_no_2/1006%20abstract.pdf [ Links ]
SINGH VK, SINGH KP and MOHAN D (2005) Status of heavy metals in water and bed sediments of River Gomti - a tributary of the Ganga River, India. Environ. Monit. Assess. 105 43-67. [ Links ]
US DEPARTMENT OF HEALTH AND HUMAN SERVICES (1978) Occupational Health Guideline for Copper Fume. Centre for Disease Control, National Institute for Occupational Safety and Health, United States. [ Links ].
VERMEULEN LA, REINECKE AJ and REINECKE SA (2001) Evaluation of the fungicide manganese-zinc ethylene bis(dithiocarbamate) (Mancozeb) for sublethal and acute toxicity to Eisenia fetida (Oligochaeta). Ecotox. Environ. Saf. 48 183-189. [ Links ]
WADE PC, WOODBORNE S, MORRIS WM, VOS P and JARVIS NV (2000) Tier 1 Risk Assessment of Selected Radionuclides in Sediment of the Mooi River Catchment. WCR Report No. K5/1059. Water Research Commission, Pretoria, South Africa. [ Links ]
WITMANN GTW and FÖRSTNER U (1977) Heavy metal enrichment in mine drainage: III The Klerksdorp, West Wits and Evander Goldfields. S. Afr. J. Sci. 73 53-57. [ Links ]
WRIGHT D and WELBOURNE P (2002) Environmental Toxicology. Factors affecting toxicology. Cambridge Environmental Chemistry Series 11. Cambridge University Press. [ Links ]
Received 28 October 2008; accepted in revised form 9 March 2009.
* To whom all correspondence should be addressed.
+2721 460 3175; fax: +2721 460 3193;
e-mail: khanw@cput.ac.za

