Services on Demand
Article
 English (pdf)
 Article in xml format
 Article references
Indicators

Related links
-
 Cited by Google
 -
 Similars in Google
Share

 Permalink
Water SA
On-line version ISSN 1816-7950
Print version ISSN 0378-4738
Water SA vol.35 n.3 Pretoria Apr. 2009
Application of the contingent valuation method to estimate a recreational value for the freshwater inflows into the Kowie and the Kromme Estuaries
MC Sale*; SG Hosking and M Du Preez
Department of Economics, PO Box 77000, Nelson Mandela Metropolitan University, Port Elizabeth, 6031, South Africa
ABSTRACT
This paper assesses the amount recreational users are willing to pay to secure an increase in freshwater inflows into 2 South African estuaries, the Kowie and the Kromme. A questionnaire was administered to 150 respondents at each estuary site during the period December 2002 to January 2003. The values of freshwater inflows into the Kowie and the Kromme Estuaries were calculated at R0.072/m3 and R0.013/m3, respectively. Total WTP values were estimated at R938 296.59 and R974 019.20, respectively. A valuation function to predict willingness-to-pay was predicted using the Tobit model estimation of linear bid functions. Annual levies paid (consisting of fishing licences, boat registration fees, etc.), distance of current accommodation to estuary, number of household members, primary use of estuary (i.e. recreation or commercial), how informed the respondent was and investment in boats and vehicles were shown to be important predictors of willingness-to-pay in the case of the Kromme Estuary. Level of education, race of respondent, annual levies paid, investment in estuary access equipment and respondent status (i.e., visitor vs. non-visitor) were shown to be important predictors of willingness-to-pay in the case of the Kowie Estuary. An expectations validity assessment indicated that the estimates were credible.
Keywords: contingent valuation method, recreation, estuary, freshwater inflows
Introduction
The future conservation status of many estuaries around the South African coastline is heavily dependent on adequate freshwater inflows (Lamberth and Turpie, 2003; Maree et al., 2003; Turpie et al., 2002; Hosking et al., 2002). Freshwater inflows into many South African estuaries are, however, being reduced due to uncontrolled alien tree and plant infestations, coupled with an ever-increasing human demand for freshwater (Lamberth and Turpie, 2003; Turpie et al., 2002). Insufficient freshwater flowing into estuaries leads to the partial loss of the environmental service flows supplied by them – the relative availability of these service flows enables and/or promotes the occurrence of recreational activities (Adams, 2001). Consequently, the loss of environmental service flows has adverse economic consequences as the residential and holiday recreational appeal of the estuaries is diminished.
Two South African estuaries, namely the Kowie and the Kromme are suffering from a growing deficiency of freshwater inflow due to various forms of water abstraction (Adams, 2001; Lamberth and Turpie, 2003). The effect of freshwater abstraction has varying effects on different types of estuaries (Schalacher and Wooldridge, 1996; Whitfield and Wooldridge, 1994). The Kowie and Kromme Estuaries are classified as permanently open ones. The effects of water abstraction on these types of estuaries are as follows: a fall in riverine nutrient plants, increased salinity levels, reduced fish recruitment, increased sand shoal size and a bigger flood requirement (Hosking et al., 2004).
In terms of the Kowie Estuary, the mouth and lower reaches have been significantly developed and altered over time. One of the main problems experienced in the Kowie Estuary is the deposition and accumulation of sediment (Kowie Estuary Management Plan, 1999; Schumann, 2001; Hosking et al., 2004) due to inadequate freshwater inflows. This has been found to negatively interfere with the boating, fishing and birding activities that take place on the river and could negatively affect tourism (Kowie Estuary Management Plan, 1999; Wooldridge, 2003; Hosking et al., 2004).
The Kromme Estuary is considered to be freshwater starved (Scharler and Baird, 2005; Bate and Adams, 2000; Baird, 2003). Two major dams have been constructed in the catchment area of the Kromme Estuary, namely the Churchill Dam and the Mpofu Dam. These dams have the combined capacity of storing about 133% of the MAR of the Kromme River catchment area. Freshwater inflow into the Kromme Estuary is irregular and relatively low with a mean annual inflow rate of approximately 11 000 m3 (Hosking et al., 2004). Numerous small dams are also situated on the tributaries of the Kromme River and these tend to restrict the water flow. Due to the relatively low freshwater inflows experienced in the Kromme Estuary, fishing and birding activities are compromised and could adversely affect tourism.
The aims of this study were twofold:
• To determine recreational estuary users' total willingness-to-pay for initiatives/actions that would increase the freshwater inflow into the Kowie and Kromme Estuaries so as to maintain or improve the environmental service flows provided by each estuary
• To determine the recreational per cubic metre value of the freshwater inflow into the Kowie and Kromme Estuaries.
The study sites
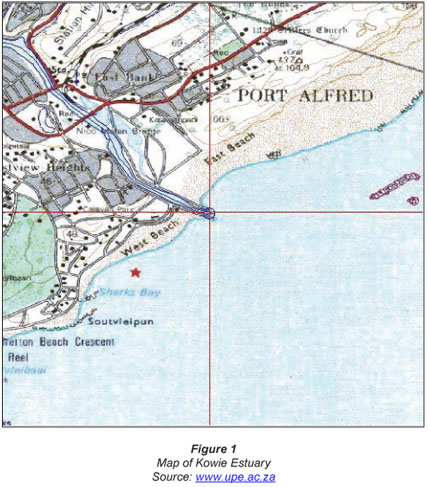
Kowie Estuary
The Kowie Estuary (another estuary with similar characteristics is the Fish River Estuary and this is approximately 15 km away, by road) opens to the Indian Ocean at 33°36"S, 26°54"E, and is found midway between East London and Port Elizabeth, flowing through the town of Port Alfred. Port Alfred is the administrative capital of the Ndlambe Municipality (Thornton and Gibb, 2005). Data obtained from the 2001 Census indicate a reduction in employment in the agriculture, forestry and mining sectors. There has, however, been significant growth in the construction, manufacturing, real estate, social service and retail sectors. Growth in these sectors has been attributed to the rise in tourism in the area, prompting an increased demand for leisure properties, holiday accommodation and hospitality services (Thornton and Gibb, 2005).
The length of the Kowie River from the mouth to the source is approximately 70 km and the last 21 km of the river, leading into the Indian Ocean, is tidal and is regarded as estuarine (Kowie Estuary Management Plan, 1999; Heydorn and Grindley, 1982; Noble and Hemens, 1978). The lower reaches of the estuary are located within the town of Port Alfred. Road access to the estuary is considered to be good and there are approximately 25 public access points. The closest residential area is located on the estuary.
The catchment area of the Kowie River is approximately 769 km2 (Noble and Hemens, 1978). The Kowie River's upper catchment area is made up mostly of privately owned farms, which focus on the production of beef cattle (Cowley and Daniel, 2001). The main crop cultivation takes place on the floodplain.
The steep slopes along the upper to middle reaches of the river are mostly covered with indigenous vegetation. Alien tree species, including Hakea, Pinus spp., Acacia spp. and Eucalyptus spp. have, however, also invaded an area of roughly 23 263 ha (20.12%), which is estimated to cause runoff losses amounting to 24 x 106 m³/a (Chapman et al., 1998).
The estuary provides 21 km of navigable water and is mainly used for recreation activities, such as fishing, sailing, skiing and jet skiing (Kowie Estuary Management Plan, 1999; Adams, 2001). The estuary is also used as a harbour for commercial fishing boats, recreational boats and yachts. Subsistence fishing also occurs in the estuary (Kowie Estuary Management Plan, 1999). Many private waterfront homes are situated along the lower reaches of the estuary, particularly along the Western Bank. These homes often have jetties and slipways protruding into the main channel. These jetties, together with larger boats moored midstream, obstruct and limit the utilisation of the main channel (Heydorn and Grindley, 1982).
Over time, the mouth and lower reaches of the estuary have been significantly developed and altered. During the last century, the mouth of the estuary was canalised and infrastructural and residential development has taken place in and around the lower reaches of the estuary. A marina was established on the east side of the estuary, close to the mouth (Kowie Estuary Management Plan, 1999).
Although the Kowie River is considered to be perennial, the river flow can come to a halt for 2 to 3 months during abnormal drought conditions (Whitfield and Wooldridge, 1994). The Kowie River has a very swift run-down period resulting in a high flow over a very short duration (Heydorn and Grindley, 1982). Mean annual runoff is estimated at 23 x 106 m³ (Adams, 1991).
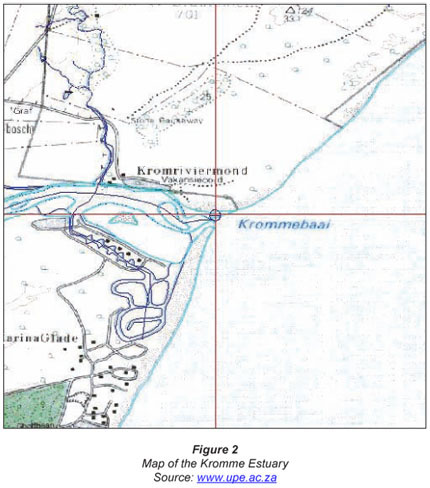
The Kromme Estuary
The Kromme Estuary opens into St. Francis Bay at 34°08"S: 24°51"E, and is located approximately 55 km west of Port Elizabeth. The Kromme Estuary supports many recreational activities, namely fishing, birding, bait collection, waterskiing, canoeing, boat cruisers, hiking and swimming (Adams, 2001). Tourism is seen as an important income generator in the area (Davies, 2009). The recent establishment of the second golf course in St Francis Bay (The Links) has also provided the area with much needed job creation (Davies, 2009).
The Kromme is classified as a permanently open estuary with a relatively undisturbed catchment area (Heymans, 1992). The total length of the Kromme River is approximately 95 km (Reddering and Esterhuysen, 1983). The last 14 km of the river, leading into the Indian Ocean, is tidal and is regarded as estuarine (Heymans, 1992). The estuary is considered to be one of the few relatively pristine systems in the country. Minimal industrial activity occurs in the catchment or in the estuary floodplain (Baird, 2003).
The catchment area is approximately 936 km2 (Baird, 2003) in size. Small agricultural and urban settlements are found in the catchment area. The main agricultural activities include livestock farming and grain cultivation (Hosking et al., 2004). The catchment area comprises of 11.73 km2 of natural forest, 79.6 km2 of fynbos and private farmland (Heymans, 1992). However, 6.50% of the catchment area is invaded by alien trees, which reduces annual water runoff by about 27.90 x 10⁶ m³/a (Chapman et al., 1998).
A marina canal system was constructed in a marshy area at the estuary mouth, and has undergone numerous expansions over the years in order to accommodate the construction of more houses (Crosby, 1993). Numerous small dams are also situated on the tributaries of the Kromme River, which restrict the water flow. The dams have a combined storage capacity of approximately 133% of the MAR of the Kromme River catchment (Baird, 2003). Other in-stream obstructions include several minor crossings, as well as the N2 national road. Annual rainfall varies between 700 mm and 1 200 mm (Baird, 2003). Freshwater inflow into the Kromme Estuary is irregular and relatively low, with a mean annual flow rate of about 11 000 m³. The system is considered to be freshwater starved (Baird, 2003).
Method and data
The contingent valuation method
The value of the recreational services provided by an estuary is modelled through the effects of a freshwater inflow quantity change. In principle, there are several methods by which these values can be inferred, for instance, the hedonic price method and the travel cost method. Because the contingent valuation method (CVM) is the most amenable to fine-tuning, it was preferred in this study. It can be used in the case of estuaries to infer economic values for the services they provide (Hosking et al., 2004). The premise of this study is that individuals who use the environmental services provided by estuaries for recreational purposes are willing to pay to increase the freshwater inflows into them so as to maintain or improve the said services. Accordingly, respondents were asked the maximum amount they would be willing to pay for a project that would secure an increase in freshwater inflows into the estuary. The willingness-to-pay welfare measure was chosen for the purposes of this study instead of the willingness-to-accept one, since the former measure is more appropriate in cases where desired quality or quantity increases would require higher payment levels (see Mitchell and Carson, 1990). A Tobit Model was fitted to the data collected for each estuary in order to generate a predictive WTP model. The Tobit Model is commonly used in CVM studies to describe the relationship between WTP (i.e., the dependent variable) which is non-negative, and a vector of explanatory variables. The use of the ordinary least method (OLS) would, in this case, produce negative predicted WTP values which is incorrect from a theoretical perspective.
Questionnaire and survey
Every attempt was made in this study to adhere to the guidelines for the application of the CVM, recommended in the Arrow et al. (1993) report. These attempts are described below:
• The survey was conducted via personal interviews
• The pre-coded questionnaire, used as the survey instrument, was pre-tested during a pilot survey (after the pilot study the questionnaire was simplified and improved)
• A scenario was formulated to make respondents aware of the positive changes an increase in freshwater inflows would have on the estuary (the good to be valued was accurately described). The required increase in inflows to secure positive changes for each estuary was estimated by a panel of estuarine specialists. The panel was convened, as part of an ongoing investigation into the value of freshwater inflows into South African estuaries, under the auspices of the Water Research Commission and included the following members: T Wooldridge, P Huizinga, A Whitfield and J Adams. The scenario described to the respondent in the case of the Kowie Estuary was as follows: 'What levy per year are you willing to pay (including what you already do pay) for a project to increase the river water inflow (due to urban and agricultural abstraction or reduced flows through forestry or vegetation changes) into the estuary of 56% over what currently flows into the estuary? Another way of seeing this is WTP to increase the proportion of MAR inflow into the estuary from 34% to 80%.'
• The levy would be collected by the local authority from all users who derive benefit directly or indirectly, including those providing visitors access to the Kowie Estuary. This levy would be collected in rates and user fees to those accessing the water. It would be used to fund the 'purchase' of 13 x 106 m3 of water, i.e., enough freshwater inflow to secure the changes in estuary services indicated." The positive changes were then described to the respondent. The same scenario was described to users of the Kromme Estuary, with the applicable scientific data.
• In the case of the Kowie Estuary, the willingness-to-pay question was based upon a specified increase of 56% of current freshwater inflow (i.e. a 13 x 106 m3 increase), which would positively alter the estuary's functioning, and as a result lead to a 25% increase in the availability of angling fish, mudprawn and birdlife.
• The willingness-to-pay question in the case of the Kromme Estuary was based upon a specified increase of 812% of current freshwater inflow (i.e. a 75.5 x 10⁶ m3 increase), which would positively alter the functioning of the estuary, and as a result lead to a 25% increase in the availability of angling fish, mudprawn and birdlife. In both cases, the above scientific information was explained to the respondent.
• A willingness-to-pay welfare measure was employed in the study. The payment card question format, showing annual rand willingness-to-pay options ranging from R0 to R1 001+, was used to elicit the respondent's willingness-to-pay (Frazer and Lawley, 2000). This bidding format was used because it is not subject to starting-point biases. It should, however, be noted that the use of absolute values in the payment card instead of R/m3 values could lead to an underestimation of the value of freshwater inflow. The listed range of rand options were selected in accordance with the characteristic financial outlays made by respondents on other publicly provided services.
• Non-responses were zero (upon data validation, unusable responses were discovered and discarded).
• Respondents were reminded of the substitute estuaries available, as well as of the fact that they would have to make a monetary sacrifice in order to make a payment (respondents face a budget constraint). This was done in an attempt to reduce mental account bias .
• An annual user levy was used as the payment (bid) vehicle. Respondents were told that the same levy would be charged to residents and tourists.
• Finally, a follow-up question on zero responses to the willingness-to-pay one was also included in the questionnaire - the respondent was asked for his or her reasons for providing a zero response.
The questionnaire was also prepared to obtain information on: the predominant use of the estuary; whether the respondent was a visitor or resident; whether the respondent made a living out of the estuary; the frequency of estuary use; the respondent's knowledge about the estuary; the different attributes and activities of the estuary; how far away from the estuary the respondent lived; the respondent's current cost of using the estuary; the value of the respondent's equipment that was used to access the estuary services; and personal information about the respondent, including race, level of education, level of income and gender.
Preliminary target population estimates were generated from 2 sources: first, GIS census data on the population living within 10 km of the estuary mouths, and second, interviews with local authorities on the user population. These estimates were later revised based on additional information gained during the administration of the surveys. The estimates of the number of user households (i.e., target population) for the Kowie and Kromme Estuaries were 3 234 and 3 200, respectively. During the surveys, a questionnaire was administered to 150 respondents (this size was the maximum that could be surveyed with the budget available) at each estuary site during the period stretching from December 2002 to January 2003. A simple random sampling technique was employed. This period was chosen so as to obtain a suitable mix of visitors and permanent resident users. Face-to-face interviews were conducted with the respondents by one trained enumerator at each estuary. The interviewers read the questions from the survey instrument to the respondents upon which the respondents' answers were recorded on the questionnaire by the interviewer. In the case of the Kowie Estuary 58% of the respondents were visitors and 42% were residents and in the case of the Kromme Estuary, 46% were visitors and 54% were residents.
The sample sizes were calculated using the equation below:

where:
n is the required sample size
N is the target population size
e is the desired level of precision
The target population size was taken to be the total number of households for each estuary (i.e. 3 200 for the Kromme and 3 234 for the Kowie) and the desired level of precision was set equal to 8%. This level of precision ensures representivity from the selected population, because the generally accepted level of precision for representative samples is 10% or less (Fink, 2003). Accordingly, the sample sizes were estimated to be 149 respondents for both estuaries - expressed as a percentage of the target population for the Kowie and Kromme surveys the sample size was 4.64% and 4.69%, respectively.
The valid response rate for the Kromme Estuary was 100% (150 questionnaires). The response rate for the Kowie Estuary was 67% (100 questionnaires) – the reason for this low response rate was that many of the respondents were reluctant to provide critical information, specifically annual pre-tax income.
Characteristics of respondents
It is evident from the study that the Kowie and the Kromme Estuaries are used mainly for recreational purposes. Table 1 provides a summary of the socio-economic profiles of the sample of households surveyed at the two estuaries in question.
The socio-economic profile of the Kowie respondents broadly corresponds to that of the Kromme respondents. The only large disparity is in annual pre-tax income earned.
Freshwater inflows and willingness-to-pay
Table 2 below summarises the willingness-to-pay bids for projects that will secure increased freshwater inflows into the Kowie and the Kromme Estuaries.
From the data in the above table, a weighted average WTP value was calculated for the Kowie and the Kromme Estuaries. These values were R198 and R265, respectively.
The predicated median WTP values used for aggregation purposes were derived by applying the Tobit Model to a predictive WTP function. These values are described in Tables 3 and 4. Of those respondents questioned at the Kowie and Kromme Estuaries respectively, 17% and 28.7% submitted zero willingness-to-pay bids and these were deemed to be protest bids. The protest bids were retained for analysis purposes as it is statistically incorrect to exclude them. Sample selection bias, as a result of the purposeful omission of zero bids, may cause one or both of the following consequences: first, the empirical analysis of the valuation function may produce inconsistent parameter estimates, and second, the calculated benefit measures and, thus, the total values derived may also be biased. One per cent of the respondents for the Kowie Estuary had a willingness-to-pay bid in excess of R4 000. These responses were treated as outliers and were omitted. None of the respondents for the Kromme Estuary provided excessively large bids.
A chi-square test for significance was conducted to test whether visitors and residents provided significantly different WTP values. The fact that the null hypothesis holds in the chi-square test suggests that there are no significant differences in terms of the WTP figures provided by residents and visitors.
Willingness-to-pay functions
A Tobit Model was fitted to the data collected for each estuary in order to generate predictive models of willingness-to-pay (WTP). As WTP is a censored dependent variable, the ordinary least squares (OLS) method cannot be applied in this instance. In the case of a censored dependent variable the OLS method will predict negative WTP values which are incorrect from a theoretical point of view. Some argue that when R2 values for valuation functions are less than 15% the credibility of the predictive model is of questionable use (Mitchell & Carson, 1990).
Predictors which did not offer sufficient statistical significance were omitted from the valuation functions. The results for the Kowie and Kromme Estuaries respectively, are documented below in Tables 3 and 4.
The signs of all the coefficients, shown in Table 3 above, are in accord with predictions. It can be deduced from Table 3 that for every extra year of education completed, willingness-to-pay increases by approximately R50. Worth of vehicles and boats and levies are positively correlated to willingness-to-pay - for each additional R1 000 increase in worth of vehicles and boats, willingness-to-pay increases by R1. For every additional rand paid in annual levies, willingness-to-pay increases by approximately R0.45. For every additional visitor, willingness-to-pay decreases by R210.
For every additional rand paid in annual levies to estuary services, willingness-to-pay increases by approximately R0.91. It was found that the worth of vehicles and boats was highly statistically significant, but has only a small effect on willingness to pay - for every R1 000 increase in the current value of vehicle and boats, WTP increases by R1. People who are well informed on estuarine ecology were willing to pay R126 more than less knowledgeable respondents. WTP also increased by R47 for each additional family member making use of the estuary.
Recreational estuary users' median willingness-to-pay
The predictive WTP equations for the Kowie and Kromme Estuaries (see Tables 3 and 4 above) are provided below in Eqs. (1) and (2), respectively:
When the median values (obtained from the sample data) are substituted into Eqs. (1) and (2) above, the predicted median WTP values for the Kowie and Kromme Estuaries are R290.14 and R304.38, respectively.
The recreational value of the freshwater inflows
Two recreational values of the freshwater inflows into the Kowie and Kromme Estuaries are reported here: one showing what the entire visiting population is prepared to pay per annum for increased freshwater inflows, and another showing the R/m3 value of water per annum.
The total willingness-to-pay (TWTP) for changes to estuary services for the Kowie and Kromme Estuaries (see Table 5 below) was calculated as the products of the predicted median WTP per annum and the estimated number of households.
In total, the populations visiting the Kowie and Kromme Estuaries are willing to pay R938 296.59 and R974 019.20/a, respectively, for a positive change in freshwater inflows (i.e. a 13 x 106 m3 change in the case of the Kowie Estuary, and a 75.5 x 10⁶ m3 change in the case of the Kromme Estuary).
The per cubic metre per annum rand value of water is the TWTP divided by the change in inflow (m³) (see Table 5) required for each selected estuary, in order to secure the previously mentioned positive recreational changes. This information is presented in Table 6 below.
It is concluded that the WTP per cubic metre per annum for freshwater for the Kowie and the Kromme Estuaries are R0.072 and R0.013, respectively. These WTP values represent how much could be charged for delivering the required freshwater inflows. These marginal values should be compared with marginal cost information in order to guide the allocation of freshwater inflows into the respective estuaries. This would allow for the establishment of an optimum inflow in order to facilitate sound water resource management.
It is also useful to compare the recreational values in Table 6 with the raw water tariffs in the applicable water management area. Table 7 provides this information in R/m3, within the Fish to Tsitsikamma water management area, which incorporates the Kowie and the Kromme estuaries. The recreational values reported in Table 6 are considerably lower than the raw water tariffs presented in Table 7, thus implying that a higher value is placed on water for domestic/industrial, agriculture and forestry use.
Conclusions
The premise of this study was that individuals who use the environmental services provided by estuaries for recreational purposes are willing to pay to increase the freshwater inflows into them so as to maintain or improve these services. The survey conformed to most of the guidelines suggested by Arrow et al. (1993), and a conservative payment/bid elicitation approach was adopted. The models selected for the purpose of estimation used annual levies paid and investment in vehicles and boats inter alia, to predict WTP for inflows into the Kromme Estuary, and level of education, annual levies paid, investment in estuary access equipment and respondent status (visitor vs. non-visitor) to predict WTP for inflows into the Kowie Estuary. The paper finds that the recreational value of freshwater inflows into the Kowie and the Kromme Estauries respectively, was R0.072/m³ and R0.013/m³ in the year 2002. These marginal values still need to be compared with marginal cost information in order to guide the allocation of freshwater inflows into the respective estuaries (Hosking, 2008).
Acknowledgements
The financial support and advice of the relevant Water Research Commission Project No K5/1413 Reference Group are gratefully acknowledged.
References
ADAMS JB (1991) The distribution of estuarine macrophytes in relation to freshwater in a number of Eastern Cape estuaries. Unpublished M.Sc. Thesis. Department of Botany, University of Port Elizabeth, South Africa. [ Links ]
ADAMS JB (2001) The importance and freshwater requirements of South Africa's estuaries. SA Waterbulletin 26 (6) 16-19. [ Links ]
ARROW K, SOLOW R, PORTNEY PR, LEAMER EE, RADNER R and SCHUMAN H (1993). Report of the National Oceanic and Atmospheric Administration (NOAA) Panel on Contingent Valuation. Federal Register 58 (10) 4601-4614. [ Links ]
BAIRD D (2003) Kromme River Estuary, St. Francis Bay, Eastern Cape, South Africa. www.data.ecology.su.se. [ Links ]
BATE GC and ADAMS JB (2000) The effects of a single artificial freshwater release into the Kromme Estuary. 1: Overview and interpretation for the future. Water SA 26 (3) 329-332. http://www.wrc.org.za/archives/watersa%20archive/2000/July/1301e.pdf [ Links ]
BATEMAN IJ, LOVETT AA and BRAINARD JS (2005) Applied Environmental Economics. A GIS Approach to Cost – Benefit Analysis. Cambridge University Press, New York. [ Links ]
CHAPMAN RA, LE MAITRE DC and VERSVELD DB (1998) Alien Invading Plant and Water Resources in South Africa: A Preliminary Assessment. CSIR Division of Water, Environment and Forestry Technology, Stellenbosch, South Africa. [ Links ]
COCHRANE WG (1977) Sampling Techniques (3rd edn.) Wiley, New York. [ Links ]
COWLEY P and DANIEL C (2001) Estuaries of the Ndlambe Municipality, INR Investigation Report. No. 229. South Africa. [ Links ]
CROSBY HM (1993) The influence of marina design on water quality – a comparative study of three marinas on the eastern Cape coast. M.Sc. thesis, University of Port Elizabeth, Port Elizabeth, South Africa. [ Links ]
DAVIES L (2009) Personal communications. St Francis Bay Tourism Office, St Francis Bay, South africa. [ Links ]
DU PREEZ M (2002) An Economic Evaluation of the Environmental Use of Water: Selected Case Studies in the Eastern and Southern Cape. Unpublished Ph.D. Thesis, University of Port Elizabeth, South Africa. [ Links ].
FIELD BC (1994) Environmental Economics: An Introduction. McGraw-Hill, New York. [ Links ]
FINK A (2003) The Survey Handbook (2nd edn.). Sage Publications, California. [ Links ]
FRAZER L and LAWLEY M (2000) Questionnaire Design and Administration, A practical guide. John Wiley and Sons, Australia, Ltd. [ Links ]
HEYDORN A and GRINDLEY J (1982) Estuaries of the Cape: Kowie. National Research Institute for Oceanology, Stellenbosch, South Africa. [ Links ]
HEYMANS J (1992) Energy Flow Model and Network Analysis of the Kromme Estuary. St. Francis Bay, South Africa. Unpublished Masters Dissertation. University of Port Elizabeth, Port Elizabeth, South Africa. [ Links ]
HOSKING SG (2008) An economic approach to allocating river water to estuaries in South Africa. Coastal Manage. 36 (1) 35-46. [ Links ]
HOSKING SG, DU PREEZ M, CAMPBELL EE, WOOLDRIDGE TH and DU PLESSIS LL (2002) Evaluating the Environmental Use of Water-Selected Case Studies in the Eastern and Southern Cape. WRC Report No. 1045/1/02, Water Research Commission, Pretoria, South Africa. [ Links ]
HOSKING SG, WOOLDRIDGE, TH, DIMOPOULOS G, MLANGENI M, LIN C-H, SALE M and DU PREEZ M (2004) The Valuation of Changes To Estuary Services in South Africa as a Result Changes to Freshwater Inflow. WRC Report No. 1304/1/04. Water Research Commission, Pretoria, South Africa. [ Links ]
KOWIE ESTUARY MANAGEMENT PLAN http:/www.inr.ac.za/estuaries/management/Kowie/Kowieplan.html (Date accessed: 28 June 2002). [ Links ]
LAMBERTH SJ and TURPIE KJ (2003) The role of estuaries in South African fisheries; economic importance and management implication. WRC Report No. 756/2/03. Water Research Commission, Pretoria, South Africa. [ Links ]
MITCHELL RC and CARSON RT (1990) Using Surveys to Value Public Goods: The Contingent Valuation Method. Resources for the Future. John Hopkins University Press, Washington. [ Links ]
MAREE RC, WHITFIELD AK and QUINN NW (2003) Prioritization of South African Estuaries based on their potential importance to estuarine – associated fish species. WRC Report No. TT 203/03. Water Research Commission, Pretoria, South Africa. [ Links ]
NICHOLSON W (2004) Intermediate Microeconomics and its Application (9th edn.). Dryden, Chicago. [ Links ]
NOBLE R and HEMENS J (1978) Inland water ecosystems in South Africa - A Review of Research Needs. South African National Science Programmes. Report No. 34. [ Links ]
REDDERING JSV and ESTERHUYSEN K (1983) Research on sedimentation in estuaries. Sedimentation in the Kromme estuary. Rosie Report No. 6. University of Port Elizabeth, South Africa. 92 pp. [ Links ]
SCHARLER UM and BAIRD D (2005) A comparison of selected ecosystem attributes of three South African estuaries with different freshwater inflow regimes, using network analysis. J. Mar. Syst. 56 284. [ Links ]
SCHUMANN E (2001) Estuarine sedimentation in South Africa. SA Waterbulletin 27 (6) 13. [ Links ]
THORNTON A and GIBB W (2005) A Study of Pro-Poor Local Economic Development in Ndlambe for the World Bank: Case Study prepared for the World Bank – Netherlands Partnership Programme Evaluating and Disseminating Experiences in Local Economic Development. [ Links ]
TURPIE JK, ADAMS JB, JOUBERT A, HARRISON TD, COLLOTY BM, MAREE RC, WHITFIELD AK, WOOLDGRIDE TH, LAMBERTHSJ, TALJAARD S and VAN NIEKERK L (2002) Assessment of the conservation priority status of South African estuaries for use in management and water allocation. Water SA 28 191-206. http://www.wrc.org.za/archives/watersa%20archive/2002/April/1386.pdf. [ Links ]
WATER RESOURCE MANAGEMENT CHARGES: SIMPLIFIED GUIDE. http://www.dwaf.gov.za/Projects/WARMS/docs/pdf/A5eng.pdf (Date accessed: 5 March 2009). [ Links ]
WHITFIELD AK and WOOLDRIDGE TH (1994) Changes in freshwater supplies to southern African estuaries: some theoretical and practical considerations. In: Dyer KR and Orth RJ (eds.) Changes in Fluxes in Estuaries: Implications from Science to Management. Olsen and Olsen, Fredensborg, Denmark. 41-50. [ Links ]
www.upe.ac.za/cerm/images/Estuaries2/kromme.jpg (Date accessed: 28 June 2002). [ Links ]
www.upe.ac.za/cerm/images/Estuaries2/kowie.jpg (28 June 2002). [ Links ]
Received September 2008; accepted in revised form 24 March 2009.
* To whom all correspondence should be addressed.
+2741 5042795; fax: +2741 5832644;
e-mail: michael.sale@nmmu.ac.za
Appendix : Example of questionnaire used in the study
WRC CVM QUESTIONNAIRE– ADMINISTERED BY UPE – PUBLIC ISSUE OF FRESH WATER INFLOW INTO THE KROMME ESTUARY