


Services on Demand
Article
 English (pdf)
 Article in xml format
 Article references
Indicators

Related links
-
 Cited by Google
 -
 Similars in Google
Share

 Permalink
Water SA
On-line version ISSN 1816-7950
Print version ISSN 0378-4738
Water SA vol.35 n.2 Pretoria Jan. 2009
Particulate fingerprinting of water quality in the distribution system
JQJC VerberkI, *; JHG VreeburgI, II; LC RietveldI; JC van DijkI
IDelft University of Technology, Faculty of Civil Engineering and Geosciences, Department of Water Management, Section Sanitary Engineering, PO BOX 5048, 2600 GA Delft, The Netherlands
IIKiwa Water Research, Nieuwegein, The Netherlands
ABSTRACT
Particles in the distribution system play an important role in the perception? Not clear what is meant) of drinking water quality, particularly in association with discolouration. In The Netherlands the water quality in the distribution system is traditionally monitored by turbidity measurements. However, turbidity is hard to quantify as it is a complex function of particle suspension, dependent on many factors. In this paper the value of on-line particle counting in determining the particulate volume load fed to and developing in a distribution system is discussed and analysed. On-line particle counters have been used at several locations in Dutch distribution systems to monitor the particulate water quality. Furthermore, particulate material in a transportation system was characterised by using pre-concentration methods allowing organic and inorganic analysis of the particulate material. By using on-line particle counters and pre-concentration methods, it is possible to identify different sources of particles in a distribution network. The overall conclusion of the authors is that on-line particle counters, in combination with pre-concentration methods, are very effective and useful tools in understanding the water quality processes in distribution systems.
Keywords: particles, drinking water, distribution system, sediment deposits
Introduction
The water quality in distribution systems depends on a combination of biological, physical and chemical processes. Bio-stability and disinfection residual concentrations are considered to be the most important parameters of international interest in distribution systems (Prevost et al., 2005; Woolschlager et al., 2005), as most countries have a treatment system incapable of producing bio-stable water. Therefore, they rely on chemical disinfection to safeguard the biological water quality. In the Netherlands and parts of Germany, another approach is used, as the use of disinfectant residual is totally avoided. The combination of an extensive treatment by multiple barriers with good distribution practices eliminates the need for a disinfectant residual. With the multiple-barrier treatment, biologically and chemically stable water is produced. As a result of the multiple-barrier treatment in the Netherlands, the physical loading of the distribution system with particulate material is also low. Stable and low turbidity values, on the order of < 0.2 NTU, are commonly found and, thus, the water quality complaint level is low. However, some discoloration events still occur. This aesthetic water problem is, together with organoleptic water problems, the primary reason for customers to complain to their water company about the water quality.
Water quality processes in a distribution system
Although the processes and mechanisms that cause water quality deterioration in distribution systems are generally known, they are complex and poorly understood compared to water quality processes in the treatment plant. In Fig. 1 the processes and parameters determining discolouration are shown (Vreeburg, 2007). A similar figure can be drawn for biological (re)growth as there is a relationship between both water quality deterioration processes. The (modelling of) biological regrowth has been described quite extensively in the literature (Piriou et al., 1997). General model approaches for discolouration caused by particles, however, are more or less lacking.
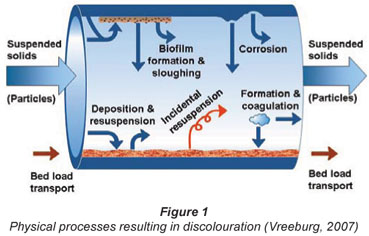
The mechanisms determining water particulate quality change in a (segment of a) distribution system can be described by the inflow, production, storage and outflow of particles.
The inflow and outflow of particles consist of:
-
Regular particle/sediment load entering the system because of the incomplete removal of suspended solids at the treatment plant (Gauthier et al., 2001; Gauthier et al., 2003; Kirmeyer et al., 2000; Slaats, 2002)
-
Particle load caused by disturbances in the daily operation resulting in a peak loading of the distribution system (Colton et al., 1996)
-
Particles added to the water by certain treatment processes, such as powdered activated carbon (Brazos and O'Conner, 1996) and sand particles, alum or iron flocs and bio- particles originating from biofilters (Ahmad and Amirtharajah, 1998).
The production of particles consists of different chemical, biological and physical processes:
-
Post-treatment precipitation of small particulate material and flocculation to larger particles (Sly et al., 1990; Lin and Coller, 1997)
-
Growth of micro-organisms, in particular biofilm, attached to the walls of pipes as a result of the presence of assimilable organic carbon (AOC) in the water or on the pipe wall (Van der Kooij, 2002; LeChavellier et al., 1987; Clark et al., 1993; Meches, 2001; Siebel et al., 2008)
-
Corrosion and leaching of chemical components from cast iron or cement pipe walls (Gauthier et al., 2001; Boxall et al., 2003; Clement et al., 2002)
-
Incidental re-suspension of 'old' sediment and biomass originating from the (long) history of the pipe, the network and the treatment plant.
The storage of particles consists of physical processes, like deposition or sedimentation, dispersion and transportation. The overall result of these processes is a build-up of sediment in the pipes over time.
All of these mentioned particulate water quality mechanisms themselves do not directly result in discolouration events. However, they all contribute to the accumulation of material in the distribution network (storage) that can and will re-suspend incidentally. Obviously, distribution system characteristics like contact time, contact surface and hydraulic conditions also play an important role in the influence of these processes on the water quality. Next to the sources and growth of the particles, the hydraulic behaviour of the particles is also important because this determines the fate of the particles in the network. Regular deposition and re-suspension, as well as bed load transport, occur continuously and determine the amount of particulate matter that is available for accidental re-suspension leading to discolouration.
Water quality monitoring in a distribution system
Water quality in a Dutch distribution system is monitored for three types of group parameters by the water companies and reported to the Ministry of Housing, Spatial Planning and the Environment (Versteegh and Dik, 2005). The group parameters are:
-
Microbiological parameters
-
Chemical parameters
-
Indicator parameters.
The indicator parameters don't have a direct health background, but are meant to provide information over the production process from source to tap. This group can be further divided into organoleptic, operational and signalling parameters. Well-known parameters in this indicator group are, for example, turbidity, Aeromonas, iron and the saturation-index (SI). If any of the indicator parameters has a value higher than specified in the Dutch Decree on Water Supply, the water company needs to investigate the reason.
The most important operational parameters from the group parameters used by the Dutch water companies to limit the water quality change in the distribution system are given in Table 1. Besides the values as given in the Decree on Water Supply, the water companies use the VEWIN recommendations. Their values are stricter than those of the Decree.
The traditional particulate water quality parameter for distribution systems is turbidity. In the Dutch Decree on Water Supply, the maximum value for turbidity leaving the treatment plant is set at 1 NTU and occasionally values up to 4 NTU are accepted in the distribution system. The water quality at the treatment plant, including turbidity measurements, is checked on a regular basis by grab sampling. This turbidity value only represents turbidity at the moment the grab sample is taken, and no guidelines are given for the time of the day at which a grab sample has to be taken. Some water utilities perform on-line turbidity measurements in order to understand the water quality changes in their reticulation systems.
On-line particle counting
Although turbidity is the commonly measured water quality parameter in distribution systems, it is a parameter that is hard to quantify; it is a complex function of particle suspension and dependent on a combination of factors including obscuration, reflection, refraction, diffraction and scatter (Boxall and Saul, 2005). Turbidity measurements do not give information about the size, composition or origin of particles. Therefore, detailed information about particle composition in a distribution system is typically rare. Several studies have investigated the chemical composition, quantity and associated bacteriological activity of loose deposits after flushing a distribution system (Barbeau et al., 2005; Carriere et al., 2005; LeChavellier et al., 1987; Zacheus et al., 2001; Rompré et al., 2000; Gauthier et al., 1999; Antoun et al., 1999; Seth et al., 2004). Data on the composition and quantity of particulate material in the water-phase in distribution systems is even rarer (Gauthier et al., 1997; Matsui et al., 2007; Verberk et al., 2007b). Gauthier et al. (1997) attributed this to the difficulty of sampling particles in a distribution system compared to analyses of the water itself. In Table 2 the reported total suspended solids (TSS) values are given. As can be seen, the range in TSS is quite broad.
Particle counters provide detailed information on the size and number of particles in water. This is advantageous because particle size is often seen as the most important parameter governing particle transport and settling. In the last decade, on-line particle counters have become available for application in drinking water treatment. Well-known examples are the detection of fibre breakage in membranes (Glucina et al., 1997) and the evaluation of treatment efficiency (O'Leary et al., 2003). Other studies have focused on the relationship between particle counts and turbidity (Hargesheimer et al., 1992; Hargesheimer and Lewis, 1995). In the higher turbidity range, there is a reasonable correlation between particle counts and turbidity. However, a poor relationship was found for turbidities of lower than 0.1 NTU. This indicates that, for lower turbidity waters, the detection ability of particle counters is expected to be better than that of turbidimeters (Hargesheimer and Lewis, 1995).
Particle counters have also been used in a study to relate turbidity, particle counts and bacteriological quality in water distribution pipes (McCoy and Olson, 1986). In that study, grab samples were collected at two locations in four different distribution systems, and they were analysed for turbidity and particle size in the laboratory. It was concluded that, although there was a direct, positive relationship between turbidity and particle counts across the different distribution systems, no direct relationship was seen within a distribution system due to the variability of the measurements.
As the interpretation of particle count data is difficult, there are still no guidelines in the legislation for particle counting as a water quality target.
Objective of study
The objective of this study is twofold:
-
To establish whether particle counters can be used as on-line monitoring tools for: (1a) water quality leaving the treatment plant and water quality changes in a distribution system
-
To develop tools to characterise particulate particles in distribution systems.
Methods and data representation
Sampling strategy
In recent years different studies have been conducted in the Netherlands on particle counting in drinking water distribution systems. In this paper an overview will be given of the results of those studies at different water utilities. In principle, the experimental set-up as given in Fig. 2 was used in all the studies. During a measuring period, one turbidimeter and particle counter monitored the water quality at the treatment plant (Sampling Location 1). The other turbidimeter and particle counter first measured the transportation line (Sampling Location 2) and were later moved to measure further away in the line (Sampling Location 3).
Analytical methods
Turbidimeters
The turbidimeters used were identical Sigrist KT65 or identical Hach 1720C turbidimeters. The measuring principle is based on scattering white light at a 90° angle. The turbidimeter was able to measure for four ranges. In this research only the lower range of 0 to 2 NTU was used. The resolution of the turbidity measurements was 1% of the maximum of the range. The turbidity was logged every minute. Before the experiments, both turbidimeters were calibrated.
Particle counters
As the on-line particle count technology has improved significantly in recent years, the research projects under review used different types of Met-One PCX particle counters. The number of ranges and the bin size of the ranges varied depending on the type of particle counter available at the water supply company. Some of the results were made with particle counters able to measure only in 5 particle-size ranges, while the most recent results were collected with particle counters using 31 channels of one µm bandwidths. The measuring technique is based on light blockage by laser diode-based particle counting sensors. The particle counters were calibrated before the experiments.
Particulate pre-concentration methods
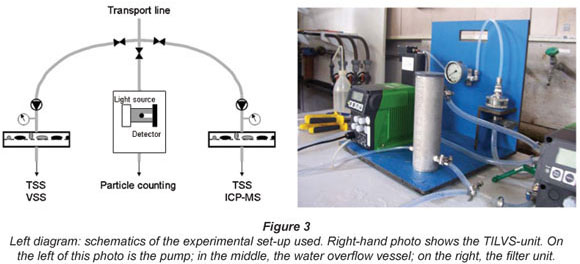
Particulate mass was measured by total suspended solids (TSS). The collection of particles was achieved by pre-concentrating the particles onto a filter membrane using experimental on-line filtration devices, termed a 'time integrated large volume sampler' (TILVS). The TILVS apparatus is used to determine the particulate mass and its characterisation for time periods between 1 and 2 d.
By having a continuous delivery of water through the filter, a large amount of water can be sampled, pre-concentrating the low number of particles and providing a time-integrated sample. This is done by using a True-dos pump to deliver a constant flow to the filter by changing the pressure to keep the flow constant as the filter fouls and resistance increases. The filtration unit is made of stainless steel and can withstand up to 10 bar of pressure. The unit also has a water overflow vessel to allow the pump to passively sample from the tap in point. As the pump delivers a constant flow of water to the filter, the total volume filtered over the duration of the sampling period can be calculated. Flow rates used ranged from 0.5 to 4.0 ℓ/h over a period of 19 to 72 h. Most samples were collected on 0.45 µm cellulose acetate filters, though 0.2 µm polycarbonate and 1.2 µm cellulose acetate filters were also used for comparison. Only the results of the 0.45 µm filters will be discussed. Filters were prepared by rinsing with de-ionised water and drying in a 105ºC oven. All glass and plastic used for the preparation and handling of the filters were acid bathed in a 1:10 dilution of AR-grade nitric acid (Merck) before their use. Filters were analysed gravimetrically for total suspended solids (TSS) after drying at 105ºC and cooling in a desiccator. Recorded masses on the filter ranged from 2.2 to 6.6 mg. Any samples with a mass below 2.2 mg were excluded from gravimetric analysis and considered to be below the detection limits.
Inorganic analysis was undertaken by the Kiwa Water Research Laboratory in Nieuwegein (The Netherlands) and involved microwave digestion and analysis of the digested filtrate. The samples were digested using 4 mℓ of 65% HNO3 (Merck Suprapur) increased to 100 mℓ using metal free water and digested for 30 min. ICP-MS was used to analyse for K, Mg, Ca, Si, Mn, Al, Cu, Ba and Zn. Iron was analysed by flame-AAS. Four filter blank samples were also analysed. Insolubles were negligible. Volatile suspended solids (VSS) analysis was performed on samples by combustion at 550ºC. Four blank filters were also burnt. The results demonstrated that the filter membranes were being combusted completely.
The membrane filters used in this study had a much smaller pore size than filters used in comparable studies. Gauthier et al. (1997) used 5 µm cellulose acetate filters, while Nguyen et al. (2002) used an indestructible 1 µm filter cartridge. There were two reasons why a smaller pore size could be used in this study. As a result of the multi-barrier approach, the sediment loading of the Dutch drinking water (on the order of 0.01 to 0.2 mg/ℓ) is much lower than elsewhere. Gauthier et al. (2001) reported a concentration of 0.35 mg/ℓ in their study, while Nguyen et al. (2002) reported a value of 0.65 mg/ℓ. Furthermore, in the experimental set-up used, particle counters and the TILVS units were run in parallel (see Fig. 3), i.e. water was fed to the particle counter and the TILVS-unit. As a result of this set-up, it was possible to filter samples at high pressures to overcome the fouling of the membrane filters. The advantage of filters with a pore size of 0.45 µm is that this pore size is similar to the lower end of detection by the particle counters used. Furthermore, permeate can be analysed for DOC.
Data representation
Particle counters provide a large number of data. These data need to be processed and evaluated before they can be presented (Ceronio and Haarhoff, 2005). In this paper, the results of particle counts will be represented in terms of the total number of particles. Furthermore, the particle volume concentration (PVC) will be used. This calculated particle volume concentration is based on spherical particles with a geometrical average diameter for each size range (Ceronio and Haarhoff, 2005). The total particle volume concentration is the sum of the particle volume concentrations of the different size ranges. For every size range, the particle volume concentration is estimated by assuming spherical particles and by multiplying the number of detected particles in a channel by the volume of the average diameter of particles in each channel or:
where:
ni is the number of particles in a bin
i is the number of bins, and
dg is the geometrical diameter of the bin
As not all particle counters were able to measure the 1 to 2 µm range, the PVC is only calculated for particles larger than 2 µm. The unit of particle volume concentration is µm3/mℓ, but this can simply be recalculated to volume ppb (1 ppb = 10-9 m3/m3 ).
Site descriptions
At different drinking water treatment plants in the Netherlands, both particle counts and turbidity have been measured on-line; the same has been done in the distribution system. In Table 3, the main characteristics of the different drinking water treatment plants and the successive distribution systems are summarised. As reproducibility of the results over a long time period was not the objective of this specific study, reasonable, short measuring periods of a few days to two weeks were used.

Results and discussion
Monitoring turbidity and particles of water leaving treatment plant
From Fig. 4 it becomes clear that particle counters don't offer extra information compared to turbidimeters when the turbidity of the outgoing water is higher than 0.1 NTU and also fluctuating in time. Turbidimeters actually give clearer results than particle counters, as can be seen from the BF and GW data in Fig. 4. In the turbidity data of the GW plant, a recurring 7 d cycle in turbidity was found, while the BF turbidity data presented a clear daily cycle for turbidity. Both cycles find their origin in the backwash programme of the rapid sand filters. The particle count data of the same plants (Fig. 5, next page) give a much more chaotic view with many high peaks in particle numbers. The cyclic pattern is not visible in these particle count data. This conclusion about the usefulness of particle counting in waters with turbidities of higher than 0.1 NTU is in accordance with earlier reports in the literature (Hamilton et al., 2003).

The turbidity data for the plants producing drinking water from surface water are much less discriminating as almost no fluctuations in turbidity were found. In the particle number data, somewhat more variation was found than in the turbidity data. However, this variation in total particles was limited and no conclusion from this variation can be drawn.
When the particle volume concentration (PVC) is calculated, more information is obtained about the loading of the drinking water distribution system with particles. In Table 4 this PVC is calculated for all the monitored locations. As particle counting was done with different Met-One PCX particle counters with different size ranges, the PVC was calculated by using the following bin size ranges: 2 to 3, 3 to 5, 5 to 7, 7 to 10, 10 to 15 and > 15 µm.

From Table 4 it is concluded that each of the treatment plants UF, SSF and AL have a PVC of lower than 0.5 ppb. These treatment plants make use of slow sand filtration or ultrafiltration as the final treatment step. However, the AW treatment plant also has slow sand filtration as a final treatment step. In further research, the reasons for high value of PVC will be investigated. The treatment plants having rapid sand filtration as their final treatment step have much higher PVC values: up to 25 ppb.
Particulate water quality change in the distribution/transportation system
In Fig. 6 the turbidity, total particle numbers and PVC are shown for the treatment plant and for two places in a transportation system. As can be seen in the top graph (Verberk et al., 2007a), the turbidity in the distribution system is low at all sampling locations. The average turbidity is below 0.04 NTU. The turbidity at the treatment plant is very stable, almost a flat line is observed except for a few spikes caused by switching between transportation pumps in order to obtain an even number of running hours per pump. The turbidity at monitoring Location 2 is slightly lower than at the treatment plant (Location 1) and shows some variability. This is not a significant difference because these values are at the lower limit of the measuring range. The turbidity at monitoring Location 3 shows some small fluctuations but is still stable. The differences in turbidity between the different monitoring locations are too small to draw conclusions about changes in water quality in the distribution system. The total number of particles also stays relatively constant in this distribution system.

As can be seen by the comparing graphs in Fig. 6, the turbidity and total particle counts have similar trends. At the treatment location, lower total particle numbers than in the distribution system are found. With particle counters it is possible to further analyse the particle data by zooming in to different size ranges and by calculating the particle volume concentration. The bottom graph in this figure (Verberk et al., 2007a) gives the particle volume concentration for the different monitoring locations in this distribution system. A clear increase in the particle volume concentration in the distribution system is observed. The average particle volume concentration is almost 40 times larger at monitoring Location 3 compared to monitoring Location 1 (treatment plant) during the measuring period. This indicates a production of particles in this system. This increase was not observed with the turbidity data. During the transport of water from the treatment plant to the distribution reservoirs close to the city centre, more large particles formed.
The composition of these particles is derived by using a pre-concentration (TILVS). At the treatment plant (Location 1), even after filtering 191 ℓ (Table 5), a mass above the detection limit was unable to be collected, indicating a TSS lower than 13 µg/ℓ. At this location, predominantly small particles (1 µm) were present and these particles contributed very little to the mass. At Location 3, samples of up to 96 ℓ were filtered with a maximum mass of 6.6 mg retained on the filter. At this location, an average TSS of 65 µg/ℓ was found. Regardless of the TSS, the relative percentage contribution of the metals measured was very consistent, making up just under a quarter of the overall mass regardless of the variation in VSS.

The results of the elemental analysis by ICP-MS show that there is a large increase in the concentration of metals in the transportation system (Fig. 7), especially the concentration of particulate Fe increases. At Location 1 the concentration of particulate Fe is smaller than 0.13 µg/ℓ. Compared to a concentration of 5.3 µg/ℓ at Location 3, an increase by a factor 40 was found. The higher particulate Fe was also observed visually. The filters at Location 1 had a very pale-grey colour after sample collection, whereas the filters at Location 3 had a red-brown colouration.

It is unlikely that the increase in the amount of Fe would be due to corrosion of iron, as the pipes are made of concrete, with only cast-iron fittings, such as valves. The consecutive increase of particulate manganese and iron may indicate a classic flocculation of these metals, omnipresent in groundwater, while iron chloride also is dosed in the pretreatment. Transportation of water for decades has probably already created a layer of sediment in the main and this layer can be disturbed by changes in velocity. The origin of the aluminium, silicon and also potassium and calcium indicate a leaching process of the cementitious walls of the pipes that results in particulate matter in the water.
As this transportation system only consists of concrete pipes, the iron particulates are not corrosion products. It is very likely that they are products of post-flocculation. The concentration of dissolved iron at the treatment plant was <10 µg/ℓ. By stoichiometric calculations it can be calculated that 10 µg/ℓ dissolved iron can result in 19.2 µg/ℓ particulate iron.
In Table 6 some other particulate complexes and their possible particulate concentrations are given as the results of post-flocculation of dissolved compounds. It can be simply calculated that water leaving the treatment station, while complying with the guidelines, can result in a high particulate load to the distribution system. Therefore, it should be questioned whether the guidelines for dissolved material are strict enough to avoid discolouration.
Conclusions
In several monitoring projects, the particulate water quality feeding the distribution system and in the distribution system was monitored by turbidimeters and particle counters. A comparison of the water quality in a distribution network by using multiple particle counters of a similar nature proved to be very useful. From the measurements it became clear that particle counters are more sensitive than turbidimeters to changes in water quality. However, particle counters only give information about the number and size of particles. No information is obtained about the types of particles. Therefore, particle counters in WQDS research should be used in combination with particle capturing methods such as time-integrated sampling devices. By combining the results of both tools, the processes leading to changes in water quality in a distribution system can be more fully assessed. Research with on-line particle counters in the distribution system is still in its infancy, and the full potential of this monitoring technique is not currently being fully realised. It will be very useful when clear guidelines exist about how to present and interpret the particle-count data. Furthermore, a discussion should be started about establishing the acceptable number of particles or particle volume concentration at which point discolouration problems would be avoided.
Literature
AHMAD R and AMIRTHARAJAH A (1998) Detachment of particles during biofilter backwashing. J. Am. Water Works Assoc. 90 74-85. [ Links ]
ANTOUN EN, DYKSEN JE and HILTEBRAND D (1999) Unidirectional flushing: A powerful tool. J. Am. Water Works Assoc. 91 62-71. [ Links ]
BARBEAU B, GAUTHIER V, JULIENNE K and CARRIERE A (2005) Dead-end flushing of a distribution system: Short and long-term effects on water quality. J. Water Supply: Res. Technol. - AQUA 54 371-383. [ Links ]
BOXALL JB and SAUL AJ (2005) Modeling discoloration in potable water distribution systems. J. Environ. Eng. 131716-725. [ Links ]
BOXALL JB, SKIPWORTH PJ and SAUL AJ (2003) Aggressive flushing for discolouration event mitigation in water distribution networks. Water Sci. Technol. Water Supply 3 179-186. [ Links ]
BRAZOS BJ and O'CONNER JT (1996) Seasonal effects on the generation of particle-associated bacteria during distribution. J. Environ. Eng. 122 1050-1058. [ Links ]
CARRIERE A, GAUTHIER V, DESJARDINS R and BARBEAU B (2005) Evaluation of loose deposits in distribution systems through unidirectional flushing. J. Am. Water Works Assoc., 97 82-92. [ Links ]
CERONIO AD and HAARHOFF J (2005) An improvement on the power law for the description of particle size distributions in potable water treatment. Water Res. 39 305-313. [ Links ]
CLARK RM, GRAYMAN WM, MALES RM and HESS AF (1993) Modeling Contamination Propagation in Drinking Water Distribution Systems. J. Environ. Eng. 119 349-354. [ Links ]
CLEMENT JA, HAYES M, KRIVEN WM, SARIN P, BEBEE J, JIM K, BECKETT M, SNOEYINK VL, KIRMEYER GJ and PIERSON G (2002) Development of red water control strategies. Denver, American Water Works Association, Denver, USA. [ Links ]
GAUTHIER,V, BARBEAU B, MILETTE R, BLOCK J-C and PREVOST M (2001) Suspended particles in the drinking water of two distribution systems. Water Sci. Technol. Water Supply 1 237-245. [ Links ]
GAUTHIER V, BARBEAU B, TREMBLAY G, MILETTE R and NERNIER A-M (2003) Impact of raw water turbidity fluctuations on drinking water quality in a distribution system. J. Environ. Eng. Sci. 2 281-291. [ Links ]
GAUTHIER V, GÉRARD B, PORTAL J-M, BLOCK JC and GATEL D (1999) Organic matter as loose deposits in a drinking water distribution system. Water Res. 33 1014-1026. [ Links ]
GAUTHIER V, PORTAL J-M, ROSIN C, BLOCK JC, CAVARD J and GATEL D (1997) How good are water distribution systems for transport of particulate matter? Proc. Water Quality Technology Conference of American Water Works Association. 9-12 November 1997, Denver, Colorado, USA. [ Links ]
GLUCINA K, DO-QUANG Z and LAINE JM (1997) Assessment of a particle counting method for hollow fiber membrane integrity. Desal. 113 183-187. [ Links ]
HAMILTON PD, STANDEN G and PARSONS SA (2003) An analysis of particle monitor sensitivity in potable water treatment. J. Water Supply: Res. Technol. - AQUA, 52, 1-11. [ Links ]
HARGESHEIMER EE and LEWIS CM (1995) A Practical Guide to On-Line Particle Counting. AWWARF, Denver. [ Links ]
HARGESHEIMER EE, LEWIS CM and YENTSCH CM (1992) Evaluation of Particle Counting as a Measure of Treatment Plant Performance. AWWARF, Denver, USA. [ Links ]
KIRMEYER GJ, FRIEDMAN M, CLEMENT J, SANDVIG A, NORAN PF, MARTEL KD, SMITH D, LECHEVALLIER M, VOLK C, ANTOUN E, HILTEBRAND D, DYKSEN J and CUSHING R (2000) Guidance Manual for Maintaining Distribution System Water Quality. AWWARF, Denver, USA. [ Links ]
KIVIT CFT (2004) Origin and behavior of particles in drinking water networks. Department of Watermanagement. Delft, Delft University of Technology. [ Links ]
LECHAVELLIER M, BABCOCK T and LEE R (1987) Examination and characterization of distribution system biofilms. Appl. Environ. Microbiol. 53 4014-8. [ Links ]
LIN J and COLLER BA (1997) Aluminum in a water supply, Part 3: Domestic tap waters. Water 24 11-13. [ Links ]
MATSUI Y, YAMAGISHI T, TERADA Y, MATSUSHITA T and INOUE T (2007) Suspended particles and their characteristics in water mains: developments of sampling methods. J. Water Supply: Res. Technol. - AQUA 56 13-24. [ Links ]
McCOY WF and OLSON BH (1986) Relationship among turbidity, particle counts and bacteriological quality within water distribution lines. Water Res. 20 1023-1029. [ Links ]
MECHES M (2001) Chapter 13 - Biofilms in drinking water distribution systems. In: Clark RM and Boutin BK (eds.) Controlling Disinfection By-Products and Microbial Contamination in Drinking Water. US EPA Cincinnati, Ohio, USA. [ Links ]
NGUYEN BV, WU J, GRAINGER C, RYAN G, JAYARATNE A and MATHES P (2002) Particle Concentration Measurement in Water Distribution Systems. Cooperative Research Centre for Water Quality and Treatment Adelaide, Australia. [ Links ]
O'LEARY KC, EISNOR JD and GAGNON GA (2003) Examination of plant performance and filter ripening with particle counters at full-scale water treatment plants. Environ. Technol. 24 1-9. [ Links ]
PIRIOU P, LEVI J, HERAUD J and KIENE L (1997) New tools and applications in modelling and monitoring water quality in drinking water distribution systems. Water Supply 15 119-135. [ Links ]
PREVOST M, LAURENT P, SERVAIS P and JORET J-C (2005) Biodegradable Organic Matter in Drinking Water Treatment and Distribution. American Water Works Association (AWWA), Denver, USA. [ Links ]
ROMPRÉ A, PRÉVOST M, COALLIER J, BRISEBOIS P and LAVOIE J (2000) Impacts of implementing a corrosion control strategy on biofilm growth Water Sci. Technol. 41 287-294. [ Links ]
SETH A, BACHMANN R, BOXALL J, SAUL A and EDYVEAN R (2004) Characterisation of materials causing discolouration in potable water systems. Water Sci. Technol. 49 27-32. [ Links ]
SIEBEL E, WANG Y, EGLI T and HAMMES F (2008) Correlations between total cell concentration, total adenosine tri-phosphate concentration and heterotrophic plate counts during microbial monitoring of drinking water. Drinking Water Eng. Sci. 1 1-6. [ Links ]
SLAATS N (2002) Processes Involved in Generation of Discolored Water. AWWARF, Denver, USA. [ Links ]
SLY LI, HODGKINSON MC and ARUNPAIROJANA V (1990) Deposition of Manganese in Drinking Water Distribution System. Appl. Environ. Microbiol. 56 628-639. [ Links ]
VAN DER KOOIJ D (2002) Managing Regrowth in Drinking Water Distribution Systems. Kiwa Water Research, Nieuwegein, The Netherlands. [ Links ]
VAN DER MEULEN M (2004) Deeltjestellingen in Een Drinkwater Distributienet (in Dutch). Department of Water Management. Delft, Delft University of Technology, The Netherlands. [ Links ]
VERBERK JQJC, HAMILTON LA, O'HALLORAN KJ, VAN DER HORST W and VREEBURG J (2006) Analysis of particle numbers, size and composition in drinking water transportation pipelines: results of on-line measurements. Water Sci. Technol. Water Supply 6 35-43. [ Links ]
VERBERK JQJC, O'HALLORAN KJ, HAMILTON LA, VREEBURG JHG and VAN DIJK JC (2007a) Measuring particles in drinking water transportation systems with particle counters. J. Water Supply: Res. Technol. - AQUA 56 345-355. [ Links ]
VERBERK JQJC, VREEBURG JHG and VAN DIJK JC (2007b) Particles in drinking water treatment and distribution systems. Proc. IWA Particle Separation Conference. 9-11 July 2007, Toulouse, France. [ Links ]
VERSTEEGH JFM and DIK HHJ (2005) De Kwaliteit van het Drinkwater in Nederland, in 2005. Inspectiereeks VROM/VI, RIVM, Bilthoven, the Netherlands. [ Links ]
VREEBURG JHG (2007) Discolouration in Drinking Water Systems: A Particular Approach. Department of Water Management. Delft, Delft University of Technology, The Netherlands. [ Links ]
WOOLSCHLAGER JE, RITTMANN BE and PIRIOU P (2005) Water quality decay in distribution systems – problems, causes and new modelling tools. Urban Water J. 2 69-79. [ Links ]
ZACHEUS OM, LEHTOLA MJ, KORHONEN LK and MARTIKAINEN PJ (2001) Soft deposits, the key site for microbial growth in drinking water distribution networks Water Res. 35 1757-1765. [ Links ]
This paper was originally presented at the 2008 Water Institute of Southern Africa (WISA) Biennial Conference, Sun City, South Africa, 18-22 May 2008.
* To whom all correspondence should be addressed.
+31 15 2785838; fax: +31 15 2784918;
e-mail: J.Q.J.C.Verberk@TUDelft.nl

