


Services on Demand
Article
 English (pdf)
 Article in xml format
 Article references
Indicators

Related links
-
 Cited by Google
 -
 Similars in Google
Share

 Permalink
Water SA
On-line version ISSN 1816-7950
Print version ISSN 0378-4738
Water SA vol.35 n.2 Pretoria Jan. 2009
Challenges facing the implementation of water demand management initiatives in Gauteng Province
RS Mckenzie*; W Wegelin
WRP (Pty) Ltd, PO Box 1522, Brooklyn Square, South Africa 0075
ABSTRACT
Gauteng Province is the industrial heartland of South Africa and is one of the few large urbanised areas in the world that is not located adjacent to a major source of water. The demand for water in Gauteng outstripped the local resource of the Vaal River many years ago with the result that the area relies heavily on large water schemes which transfer water from adjacent river basins into the Vaal River basin. The water transfer schemes associated with the Vaal River basin are large by any international standards and the water resource system is one of the most complex and integrated anywhere in the world.
As the demand for water continues to grow in Gauteng, the Department of Water Affairs and forestry is investigating the various alternative water resource development options as well as the potential for reducing the growth in demand through water conservation (WC) and water demand management (WDM) measures. From the most recent investigations it has become clear that WDM is no longer considered a possible option but rather a necessity that must be implemented as a matter of urgency. It has been established that even if new water resource development options are implemented, it will still be necessary to introduce the WDM measures. In this regard, several of the large municipalities in Gauteng have already commenced with various WDM interventions, some of which are already in operation and showing significant savings.
The paper will highlight the need for WDM in Gauteng and provide details of the latest investigations into the potential savings that can be achieved. Some of the key problems that are hampering the implementation of WDM interventions in Gauteng will be discussed and the measures taken to overcome these difficulties will be explained. The benefits that can be obtained from a potent web-based data acquisition system which is already operational in several parts of Gauteng will also be highlighted.
The paper concludes with the clear message that wasting water in Gauteng province is a luxury that cannot be sustained and measures to eliminate the wastage must be introduced as a priority before the situation deteriorates to such an extent that water shortages become a common occurrence.
Keywords: WDM, practical implementation, problems in SA
Introduction
Total water losses from municipal water distribution systems are generally considered to be the sum of the apparent (often referred to as administrative) losses and the real (often referred to as physical) losses or leakage. The total losses from municipal reticulation systems for South Africa as a whole were recently (Seago and Mckenzie, 2007) estimated to be in the order of 1 150 x106 m3/a representing almost 30% of the system input of approximately 4 000 x106 m3/a. in 2005. It must be noted that these estimates are based on a sample of municipalities throughout South Africa which represented just under 70% of the water supplied to municipalities. It was not possible to examine all municipalities and the figures were therefore extrapolated to provide an estimate of the losses for the country as a whole. These preliminary estimates of water loss provide the first realistic estimate of water losses from municipalities throughout South Africa based on a pragmatic and realistic assessment of more than 300 individual water supply systems.
Using percentages to quantify water losses can be very misleading and is not recommended by the International Water Association, since the results are highly dependent on the consumption relative to the total water supplied. Percentages will always tend to suggest low losses in systems which have high unit consumption while the same volume of losses will show up as a high percentage value in systems where consumers use relatively little water. Having highlighted the potential problems with using percentages to quantify leakage and other losses from a water supply system, it is clear that many suppliers and government organisations will continue to use percentages both in South Africa and around the world. The estimated total water losses (30%) for the whole of South Africa is clearly a large portion of the water supplied to the municipalities but is not abnormally high. Although it is generally accepted that percentage losses should not be used for comparison purposes between systems, they are still widely used throughout the world water industry, as can be seen in Table 1.

Taking into account, the potential problems associated with percentages, the figures in Table 1 highlight the fact that percentages remain a commonly used indicator for measuring water losses throughout the world and that the South African leakage values are similar to those of many developed countries and much lower than those of most of the developing countries. This does not suggest that South Africa should be complacent about the current situation.
Many water audits have been undertaken throughout South Africa over the past 5 years, most of which were undertaken through projects supported by the South African Water Research Commission (WRC) or through the Department of Water Affairs and Forestry (DWAF). The most recent work on this issue is a project on The Assessment of Non-Revenue Water and Leakage in the Vaal River System which was undertaken through a joint initiative supported by both DWAF and the WRC.
Preliminary water audits were undertaken for the key demand centres in Gauteng and the surrounding areas which effectively involved developing water audits for 49 separate systems. This was one of the most comprehensive water audit assessments undertaken to date in South Africa and the results proved very useful and informative and are provided in the appropriate DWAF report (DWAF, 2006). The purpose of the study was to provide a realistic estimate of the potential savings that can be achieved through WDM interventions in the main urban areas of Gauteng. The assessment was based on a combination of the assessment of the overall water balance of an area together with practical knowledge of the area which in turn was supported by additional data from night-flow analyses and analyses of system pressures.
In order to carry out the assessment it was first necessary to agree on the terminology to be used. The notation used by the IWA for water balances has been recognised internationally as the most comprehensive and appropriate water balance worldwide and was adopted in this paper. The basic structure of the IWA water balance is shown in Fig. 1 (Seago and Mckenzie, 2007).

During the assessment of the potential savings from WC/WDM for the Gauteng area, it was found that the standard IWA water balance lacked certain information required by the project team to estimate realistic savings. The problem is particularly significant in South Africa and is due in part to the 'free basic water allowance' and in part to the high levels of non-payment for 'Billed Authorised' water – i.e. water that is metered and billed to consumers but no payment will ever be recovered due to the unusually high internal plumbing leakage and excessive garden irrigation. In many other countries, such wastage would not be tolerated and the consumers would be cut-off or forced to pay the outstanding accounts. In South Africa, however, this is not the case in many areas and such wastage continues unabated. In order to address this issue, the 'revenue water' component in the standard water balance as shown in Figure 1 was modified to that shown in Fig. 2 (Seago and Mckenzie, 2007) where it has been split into 3 components which have specific relevance in the South African situation.
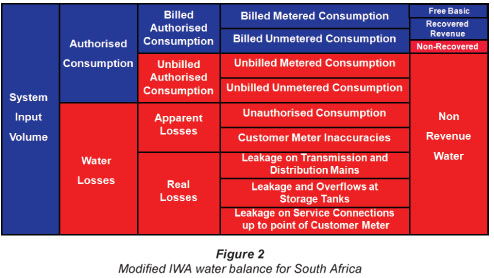
The modification was effectively achieved by splitting the 'revenue water' component into 3 components namely:
-
Free basic water – can be considered as billed and paid for at a zero tariff
-
Recovered revenue water which is billed and paid for by consumers
-
Non-recovered water which is reflected in the billing records as billed although there is no possibility of payment.
This last component is the key problem in many parts of South Africa and is very significant in some areas. For example, in a typical low income area with very high leakage where water is metered and bills are sent out in accordance with the metered consumption, the monthly consumption per property may be in the order of 50 kℓ. Of this 50 kℓ, the consumer receives 6 kℓ as the free basic allowance and a bill for the remaining 44 kℓ. Since it is a low income area, the residents are often unable to pay for the services and the accounts simply accumulate. Eventually, the water service provider decides to address the problem and installs either some form of restrictor or a pre-paid meter. If this intervention is implemented properly, the household leaks will usually be repaired as part of the process and the accumulated account will be written off as a 'once-off' gesture of goodwill by the water provider on the basis that the consumer agrees to pay for all water used from that date forward. Following the implementation of the cost recovery measures, the average consumption rarely remains at the pre-implementation levels and in most documented case studies the consumption drops significantly to approximately 12 kℓ/month (City of Johannesburg and City of Sao Paulo – personal communication). In effect, the interventions will result in a real reduction of approximately 38 kℓ/month per property.
The modification to the water balance is fully described by Seago and Mckenzie (2007) and has not been sanctioned by the IWA although it has been presented at several international conferences (e.g. Mckenzie, 2008 a; b and Mckenzie et al., 2007) and has survived any criticism to date.
This approach is required in many parts of South Africa to derive realistic estimates of what can be achieved through the implementation of various WDM interventions. If it is assumed that all water billed is in fact paid for and the demand therefore remains at the pre-intervention levels, there will be a serious discrepancy since the assumed increase in revenue water will not materialise. This can in turn alter the financial viability of the proposed interventions. It is therefore important to examine the payment levels carefully to ensure that the predicted savings and/or reductions in overall demand are realistic. It should be noted that the potential savings were assessed individually for each of the 49 areas mentioned previously and then added where appropriate to provide an indication of total potential savings per municipality.
The potential savings per municipality for one of the numerous scenarios analysed are shown in Table 2 (DWAF, 2007) from which it can be seen that the bulk of the savings are concentrated in the 4 main urban centres of Johannesburg, Ekurhuleni, Tshwane and Emfuleni. It should be noted that Emfuleni is the area where savings of almost 10 x 106 m3/a have already been achieved through the implementation of a large pressure management project (Mckenzie et al., 2007).
From Table 2 it can be seen that approximately one third of all water supplied to the areas is considered as non-revenue water. This is a combination of physical leakage and administrative losses which tend to vary from area to area. Based on the analyses of the 49 areas, it was estimated that approximately 161 x 106 m3/yr can be recovered or saved through the implementation of the various WDM interventions.
Cost of implementing WDM interventions
When considering the implementation of WDM interventions, the normal approach is to assess the unit reference value (URV) of the savings achieved and compare this to the unit reference value of the next major augmentation scheme. While it is possible to develop a realistic unit reference value for the water produced from the next major augmentation scheme, it is more difficult to develop such a number for the WDM interventions. When such values are provided, they are normally criticised by either the water resource managers or the water use efficiency managers and in most cases both have some valid reasons for the criticism.
For example in the case of the Vaal River System Analysis, considerable effort was spent trying to establish the costs associated with the implementation of the various WDM interventions in each of the 49 areas considered. In each area a range of WDM interventions were included and the capital expenditure (CAPEX) and operational expenditure (OPEX) associated with each were estimated based on the practical experience of the project team. Several different scenarios were considered and the costs and related savings from a typical scenario are provided in Table 3 (next page).

The values provided in Table 3 should not be taken out of context and are provided as indicative of what would be required in the scenario above in order to implement the full range of WDM interventions that would yield the savings provided previously in Table 2. While the actual figures have yet to be assessed in more detail, they provide an estimate of the level of funding that would be required in order to implement WDM initiatives throughout Gauteng. The costs are clearly significant and large-scale implementation of WDM initiatives should not be considered as a trivial investment. While considerable debate continues regarding how such costs should be calculated, it is clear that WDM interventions will require budgets of a similar magnitude to the capital-intensive water transfer schemes.
When considering the figures provided in it should be noted that the operational and maintenance costs are similar in magnitude if not higher than the capital costs of implementing the WDM interventions. This is an important and often overlooked aspect of many WDM interventions where the savings tend to be very significant after completion of the projects. If the projects are not properly maintained, however, they tend to collapse and any savings achieved initially are soon lost. This has been one of the key problems throughout South Africa which has led to the relatively poor perception surrounding WDM projects countrywide. There are many examples of failure where potentially successful WDM projects have collapsed completely due to the lack of maintenance. This is unfortunately one of the key problem issues associated with WDM in the South African context.
Another problem experienced when trying to provide the likely costs of WDM interventions to the water resource planners concerns the inclusion or exclusion of the maintenance backlog costs that should in theory be excluded from the calculations. In most areas with high leakage/losses, there tends to be a serious maintenance backlog in the water reticulation network which must be addressed before any new WDM interventions can be implemented. Such maintenance should be undertaken as normal practice by the municipalities, but this is often not the case. Before the proposed WDM interventions can be considered, significant expenditure will be necessary just to bring the system up to a normal level of operation. Such costs were included in the preceding example although they are not part of the subsequent WDM interventions. Such issues tend to complicate what is already a very complex issue and make it difficult to provide costs of the WDM interventions that are comparable to resource augmentation schemes.
With regard to the cost of possible WDM interventions in the Vaal River system, the costs associated with saving water through the WDM interventions are similar in magnitude to the costs associated with providing water from a new inter-basin transfer scheme. This is a bold and controversial statement which is based on certain assumptions regarding the maintenance costs and the manner in which the various unit reference values are calculated. Even if the maintenance costs (which should in theory be carried by the municipalities as a matter of their normal business) are excluded from the calculations, the average costs associated with the WDM interventions are high and remain in the same order as those of the most economical augmentation scheme.
One key difference between WDM interventions and augmentation schemes is that not all WDM interventions have the same payback ratio and in many cases, the payback for certain interventions can be as low as a month or two while for others it may be a matter of many years. In this regard it is often possible to select the most cost-effective WDM interventions to be undertaken first after which the less favourable options can be considered according to the available budgets.
Water resources situation in Gauteng
South Africa is fortunate to have a progressive water resource planning department within DWAF and the country has developed one of the most complex water resource networks in the world. Some of the major water transfer schemes associated with the Vaal River system are shown in Figure 3.
The Vaal River system is widely recognised as the most important river basin in Southern Africa as it supports the bulk of the industrial water demands in Gauteng and the adjacent provinces. The complex network of dams and inter-basin transfer schemes is managed by DWAF using software developed over a period of almost 25 years to suit the local situation. The South African software can compete with any international software and can handle many additional aspects which are rarely included in other packages.
The success of the South African water resource management expertise is evident from the fact that the system has been providing a safe and reliable supply to all residents and businesses in Gauteng for the past 25 years with very few interruptions or shortages. This is a very impressive record in a semi-arid country that must handle severe drought periods which can be in excess of 10 years in duration.
In order to provide sufficient water for the future, it is essential to undertake proper planning and appropriate development in time to support the ever growing demands for water. Such development will involve a combination of both WDM as well as supply side management. In the case of the Vaal River system, considerable work has been undertaken through DWAF to assess the growing demands and to ensure that sufficient resources are available to support them. In this regard, DWAF commissioned a new study to assess the demand and supply situation in the Vaal River basin and the preliminary results have been released through a series of open public meetings. While the results of the study are still being refined and adjusted, the key finding highlights the need for both WDM interventions as well as the construction of a new inter-basin transfer scheme. WDM is no longer considered to be one of several options but is now an essential component of the overall water resource planning process.
Figure 4 provides the results from a typical water resource assessment in which a new dam and transfer scheme are considered. It should be noted that this is one of approximately 20 possible scenarios that were investigated as part of a separate project and the figure is presented to demonstrate the planning process.
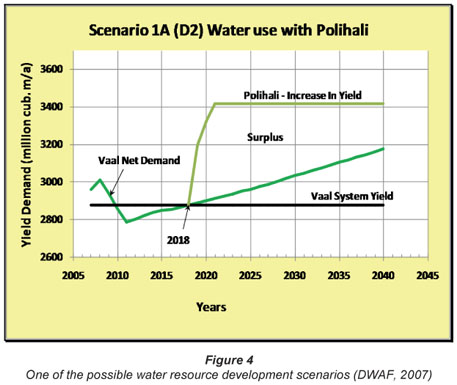
In Figure 4 it can be seen that the current yield available from the Vaal River system is in the order of 2 900 x106 m3/a as indicated by the horizontal black line. This yield is currently provided by the Vaal River system which includes over 30 major dams and associated transfers. The largest reservoirs in the system are the Vaal Dam, Sterkfontein Dam, Katse Dam, Grootdraai Dam, Bloemhof Dam, and Mohale Dam. Between them, they have a combined storage capacity in the order of 9 000 x 106 m3 or approximately 3 years' water supply.
The demand curve represents the projected water demand in the Vaal River system which in this case includes the potential savings from WDM. As can be seen, there is already a slight deficit between the supply and demand although it is unlikely to cause any problems and is already being addressed as indicated by the sharp drop in demand expected to occur between 2009 and 2011.
The 3rd line which starts in the year 2018 represents the total system yield that will be available should this particular water resource transfer scheme be implemented. Clearly it will be sufficient to provide for future growth for many years to come. In the case of this particular demand scenario, the new scheme will be required by the year 2018 and this target date will change according to the actual growth in water demands. In other words, the success or failure of the WDM measures will have a major impact on the timing of the next augmentation scheme. This is a very important issue since any new water transfer scheme will take many years to plan and construct particularly in view of the environmental and legislative requirements that must be addressed.
The analyses undertaken by DWAF were based on numerous possible demand scenarios and were matched up against several possible water transfer schemes. Figure 4 represents the results from one specific demand scenario and one specific water resource transfer scheme. The Polihali transfer scheme shown in the figure was recently (December 2008) selected by DWAF as the preferred next augmentation scheme and it will be constructed and commissioned in Lesotho in due course.
Problems experienced when implementing WDM measures
While it is generally accepted that WDM is essential and in many cases the most cost- effective solution to addressing water shortfalls, it is often regarded as unpopular by the water resource planners. The key reason for the negative perception surrounding WDM, is due to its poor track record and the fact that in numerous case studies, the projected savings through a range of WDM interventions have either not been achieved or have proved to be unsustainable. The managers responsible for providing a reliable supply of water are therefore reluctant to delay future augmentation schemes on the basis of predicted savings that may not be achieved. Unfortunately, WDM's poor track record in South Africa is a fact that cannot be ignored and in many cases the predicted savings are not achieved. Little if any research or papers are delivered on such projects and valuable lessons which should not be repeated are often ignored. The key problems hindering the successful implementation of WDM include the following:
-
Poor maintenance of the reticulation system – both prior and following the implementation of WDM interventions
-
Lack of support at the political level in the municipalities
-
Lack of consumer support.
Poor maintenance
Poor maintenance is a massive problem throughout many parts of South Africa and especially the previously disadvantaged areas where maintenance of water supply infrastructure has been neglected for many years in some cases. In cases where the water supply infrastructure has not been maintained properly, it is often virtually impossible to implement effective WDM interventions before the maintenance backlog has been addressed. It is an unfortunate fact, that the areas which have experienced a lack of proper maintenance are often the areas most in need of effective WDM measures and are the areas where the greatest savings could theoretically be achieved. It is often found that large scale infrastructure refurbishment or replacement is necessary in order to bring the system up to a reasonable level of service. Defining the appropriate level of service in South Africa is outside the scope of this paper. Only after the system is operating properly, however, can proper water demand management interventions be successfully introduced.
Lack of political support
Lack of political support is hampering the successful implementation of WDM interventions in many areas and is a major cause for failure of interventions which could arguably have been successful in a different political environment. In many cases it is found that the politicians, particularly at the municipal level do not support WDM interventions despite the growing pressure being placed upon them by DWAF. Without proper support from the local politicians, it could prove difficult to implement many of the obvious and highly effective WDM measures. A classic example is the lack of support for implementing and enforcing any form of garden watering restrictions in many areas. There are numerous municipalities throughout South Africa that experience intermittent supply in certain parts of their distribution system due specifically to garden watering. This problem occurs each year in many parts of Gauteng particularly towards the end of August and September when the temperatures heat up and before the first summer rains occur. Many systems fail to supply the sudden increase in demand and certain residents in the higher lying areas experience severe water shortages.
The solution to the problem is simple and can be achieved with the necessary political support, however, it is rarely considered acceptable to restrict garden watering and as a result the residents must endure a poor level of service. The significance of garden watering has been reported before (Jacobs, 2007; Jacobs and Haarhoff, 2007), with a water saving in some residential user categories exceeding 40% in the case of Cape Town (Jacobs et al., 2007) when outdoor use was curtailed during a period of water restrictions.
Lack of consumer support
Another key problem experienced in South Africa is the lack of consumer support. This is highlighted by the fact that the per capita water consumption in many areas is significantly higher than in many other countries which have greater natural water resources than South Africa. For example the average per-capita consumption in Sebokeng and Evaton is estimated to be more than 200 ℓ/cap·d. This can be compared to Brisbane in Australia where a figure of 130 ℓ/cap·d has been achieved. A major shift in the habits of all South Africans will be required in future to protect the existing water resources and to ensure that systems are not allowed to degenerate into those experienced by many other developing countries. Some progress is being made to educate consumers and to change their perceptions and habits with regard to water use. It is, however, a slow process and more effort will be required if significant progress is to be made.
Summary and conclusions
Water losses from municipal reticulation systems for South Africa as a whole were recently (Seago and Mckenzie, 2007) estimated to be in the order of 1 150 x106 m3/a representing almost 30% of the total system input of approximately 4 000 x106 m3/a in 2005. This water is lost through a combination of physical leakage (e.g. burst pipes) and commercial losses (e.g. admin errors, meter errors, etc.). The breakdown between the physical and commercial losses is not known and will differ from area to area. Although these losses are high, they are similar in magnitude to the losses experienced in many developed countries and well below the losses experienced in much of the developing world.
DWAF in association with the WRC are undertaking several studies to investigate the losses experienced throughout South Africa. One of the most intensive studies is being undertaken in the Vaal River system which supplies water to Gauteng and several of the adjacent provinces. The current reconciliation assessment of the Vaal River system represents the first study of its type in which an assessment of both WDM interventions and new augmentation schemes have been undertaken in such detail.
The potential savings and costs associated with the WDM interventions were assessed in a detailed and pragmatic manner in which both capital costs as well as operational costs were included. This paper reports on the preliminary findings and it is already clear that the costs associated with the WDM interventions are much higher than previously anticipated for various reasons and are likely to be in a similar magnitude to the resource augmentation options. It should be noted, however, that some of the specific WDM interventions will be more cost effective than others. It is likely that the more cost effective WDM options will be implemented first in which case the costs can be significantly lower than the corresponding costs of water delivered from the next augmentation option.
One of the key problems experienced with the actual implementation of new WDM measures is the fact that many water reticulation systems are currently not functioning properly due to many years or even decades of poor maintenance. In such systems it is often not possible to successfully commission new WDM interventions until the underlying problems have been addressed. Such maintenance should technically not be included in the cost of the new WDM interventions but unfortunately it is often necessary to take one step back before any forward progress can be achieved. The worrying aspect of the assessment is the fact that WDM is no longer one of the several options being considered in the Vaal River System but an essential component of the future planning process. In this regard it will therefore be necessary to address the maintenance backlog issue as a pre-requisite to the WDM interventions.
Another key aspect that has been identified in the assessment is the necessity of including a maintenance budget for any new WDM interventions. Such maintenance may well exceed the original capital costs of the WDM interventions but is an essential component of any new WDM project.
From the practical experience of the authors, it is clear that there is currently insufficient political will in many municipalities to address water wastage in the key problem areas. The key problem areas are considered to be those areas where water is not being paid for based on metered consumption. In such areas where sufficient water is available, it is the experience of the authors that the average household use tends to vary from an average of 30 kℓ/month to over 60 kℓ/month. Based on the evidence gathered through numerous site inspections, much of this 'consumption' is due to a combination of internal plumbing leakage and over-irrigation of lawns outside the houses. In the one or two cases where the municipality has managed to address the problem through some form of proper billing, metering and enforcement, the monthly demand drops to approximately 12 m3/month (City of Johannesburg, personnel communication).
The above water use figures clearly demonstrate a serious problem that exists in many parts of South Africa. What is not generally publicised and has not been researched, is the fact that the gross wastage often results in water shortages in some parts of a large reticulation system where residents experience intermittent supply. Such intermittent supply causes damage to the reticulation system and represents a direct health hazard to the residents due to the fact that polluted groundwater can enter the pipes during the periods when they have insufficient water and pressure to maintain the supply. It is therefore essential in such areas to restore a continuous supply even if it can only be achieved through a ban on garden watering.
Acknowledgements
The authors wish to acknowledge the South African WRC and DWAF for their continued support and permission to publish this paper. In particular Mr J Bhagwan, the Director: Water Use and Waste Management at the WRC without whose support and assistance this paper could not have been completed.
References
DWAF (2006) Potential Savings through WC/WDM in the Upper and Middle Vaal Water Management Areas. Department of Water Affairs and Forestry, South Africa, Report No. P RSA C000/00/4405/02, compiled by WRP Consulting Engineers (Pty) Ltd, DMM Development Consultants, and PD Naidoo on behalf of the Directorates: Water Use Efficiency and National Water Resource Planning, DWAF, Pretoria, South Africa. [ Links ]
DWAF (2007) Vaal River System: Large Bulk Water Supply Reconciliation Strategies. Department of Water Affairs and Forestry Report No. P RSA C000/00/4405/07, compiled by WRP Consulting Engineers (Pty) Ltd, DMM Development Consultants, and PD Naidoo on behalf of the Directorates: Water Use Efficiency and National Water Resource Planning, DWAF, Pretoria, South Africa. [ Links ]
JACOBS HE (2007) The first reported correlation between end-use estimates of residential water demand and measured use in South Africa. Water SA 33 (4) 549-558, July 2007. http://www.wrc.org.za/downloads/watersa/2007/Jul%2007/2053.pdf [ Links ]
JACOBS HE, FAIR F, GEUSTYN LC, DANIELS J and DU PLESSIS JA (2007) Analysis of water savings: A Case study during the 2004-2005 water restrictions in Cape Town. J. S. Afr. Inst. Civ. Eng. 49 (3) 16-26, July 2007. [ Links ]
JACOBS HE and HAARHOFF J (2007) Prioritisation of parameters influencing residential water use and wastewater flow. J. Water Supply: Res. Technol. – AQUA 56 (8) 495-514 http://www.iwaponline.com/jws/toc.htm [ Links ]
MCKENZIE R (2007) 'Aqualite: Water Balance Software – User Guide. WRC Report No TT 315/07. South African Water Research Commission, Pretoria, South Africa. [ Links ]
MCKENZIE RS, WEGELIN W, MOHAJANE P and SHABALALA S (2007) Hidden benefits of small scale performance based public private partnerships. Proc. Int. Water Assoc. Spec. Conf.: Leakage. September 2007, Bucharest, Romania. [ Links ]
SEAGO CJ and MCKENZIE RS (2007) An Assessment of Non Revenue Water in South Africa. Report prepared for DWAF and the WRC by WRP (Pty) Ltd. WRC Report No TT 300/07. ISBN 978-1-77005-529-2. Water Research Commission, Pretoria, South Africa. [ Links ]
MCKENZIE RS (2008a) ILI and performance indicators. Proc. Water Loss Asia 2008 Conf. 15-16 July 2008, Sunway Pyramid Convention Centre, Kuala Lumpur, Malaysia. [ Links ]
MCKENZIE RS (2008b) Assessment and Characterisation Criteria for Quantifying Total System Losses. Global Water Leakage Summit, Thistle Marble Arch, London, 17 June 2008. [ Links ]
MCKENZIE RS, SEAGO, C and LIEMBERGER R(2007) Leakage benchmarking- an update from the IWA water loss task force. Proc. Int. Water Assoc. Spec.Conf.: Leakage. September 2007, Bucharest, Romania. [ Links ]
This paper was originally presented at the 2008 Water Institute of Southern Africa (WISA) Biennial Conference, Sun City, South Africa, 18-22 May 2008.
* To whom all correspondence should be addressed.
+2712 346 3496; fax: +2712 346 9956;
e-mail: ronniem@wrp.co.za

