


Serviços Personalizados
Artigo
 Inglês (pdf)
 Artigo em XML
 Referências do artigo
Indicadores

Links relacionados
-
 Citado por Google
 -
 Similares em Google
Compartilhar

 Permalink
Water SA
versão On-line ISSN 1816-7950
versão impressa ISSN 0378-4738
Water SA vol.35 no.1 Pretoria Jan. 2009
Nitrogen dynamics in land cleared of alien vegetation (Acacia saligna) and impacts on groundwater at Riverlands Nature Reserve (Western Cape, South Africa)
NZ JovanovicI, *; S IsraelI; G TredouxI; L SoltauI; D Le MaitreI; F RusingaI, **; A RozanovII; N van der MerweII
ICSIR Natural Resources and the Environment, PO Box 320 Stellenbosch 7599, South Africa
IIDepartment of Soil Science, University of Stellenbosch, Private Bag X1, Matieland 7602, South Africa
ABSTRACT
Woody invading alien plants, many of which are nitrogen-fixing legumes (Fabaceae family), are currently cleared in South African catchments to reduce water loss and preserve streamflow, and for the restoration of the ecosystem. This study tested the hypothesis that clearing invasive alien vegetation may disturb the vegetation-micro-organism-soil N cycling system by producing a large once-off input of fresh tree litterfall rich in N and by eliminating a large N sink. Three experimental plots were established at the Riverlands Nature Reserve (Western Cape, South Africa): a site invaded by Acacia saligna to be used as control; a site cleared of Acacia saligna; and a site with natural vegetation to be used as background. Nitrogen concentrations in soil and groundwater, volumetric soil water contents, root density and weather conditions were measured during 2007. Oxidised forms of nitrogen, in particular NO3-, were dominant in the system. Recharge and leachate were simulated with the HYDRUS-2D model and used as inputs into Visual MODFLOW to predict the spatial distribution of nitrate plus nitrite (NOx) in groundwater. NOx levels in soil and groundwater were higher in alien-invaded areas compared to fynbos-covered land. A quick release of NOx into groundwater was observed due to high residual N reserves in the rooting zone, decreased evapotranspiration and increased recharge in the treatment cleared of alien vegetation. In the long run, high NOx concentrations in groundwater underlying cleared land will last only until all the excess nitrogen has been leached from the soil. A decrease in NOx concentration in groundwater can be expected thereafter. Clearing land of alien invasive legumes may therefore have a beneficial effect by reducing groundwater contamination from NOx and reducing water losses in catchments.
Keywords: Acacia saligna, forest clearing, groundwater contamination, nitrate leaching, Riverlands Nature Reserve
Introduction
It is recognised that invasive alien plants have become a threat to biodiversity and ecosystem services like water purification, soil generation, waste decomposition and nutrient cycling (Levine et al., 2003; Le Maitre et al., 2004). Alien invasives in South Africa are species that are well adapted to climatic conditions, grow fast, they are high water users and they impact on streamflow reduction through incremental water use (additional water use compared to natural vegetation) (Le Maitre et al., 2000). As a result, the Working for Water Programme (WfW) was initiated by the Department of Water Affairs and Forestry in October 1996 with the aim of controlling woody invading plants (DWAF, 1997). Extensive areas of land are currently being cleared under this programme (Marais et al., 2004). Many alien invasive species that are being targeted by WfW are nitrogen-fixing legumes (Fabaceae family). For example, Port Jackson (Acacia saligna), Black wattle (Acacia mearnsii) and rooikrans (Acacia cyclops) are commonly found in Western Cape landscapes.
The nitrogen-fixing invasive alien plants cause the N-cycling regimes within ecosystems to shift from low to high N-cycling (Stock et al., 1995; Ehrenfeld, 2003; Yelenik et al., 2004). Similarly, impacts on the nitrogen cycle occur when N-fixers are cleared (Vitousek and Melillo, 1979; Browaldh, 1997). The disturbance to the nutrient cycling due to forest clearing manifested itself with increased N losses in some ecosystems (Vitousek and Melillo, 1979; Swank et al., 2001; Yelenik et al., 2004; Fukuzawa et al., 2006) and decrease in mineral N in others (Jussy et al., 2004). Vitousek and Melillo (1979) and Vitousek (1981) ascribed these variable responses to process-level mechanisms and factors (biotic, abiotic, forest management) that stimulate N mineralisation and/or inhibit N loss. The individual processes of nitrogen cycling in the plant-micro-organism-soil system were widely discussed in review publications by Stevenson (1982), Haynes (1986), Havlin et al. (1999) and Ma and Shaffer (2001).
The hypothesis in this study was that clearing invasive alien vegetation may disturb the alien vegetation-micro-organism-soil N cycling system by producing a large once-off input of fresh Acacia litterfall rich in N and by eliminating a large N sink (Vitousek, 1981; Yelenik et al., 2004). In addition, changes to local microclimate as well as soil chemistry and physics may result in increased net N mineralisation beyond the N requirements of the remaining biota (Dominski, 1971; Stone, 1973; Aber et al., 1978; Conrad et al., 1999). There is thus a distinct risk that clearing alien vegetation may lead to nitrate contamination of groundwater and eutrophication of surface water bodies. Colvin (1999) indicated that methaemoglobinaemia or blue baby syndrome may become a risk for infants when N concentrations are > 10 mg · ℓ-1 (45 mg · ℓ-1 NO3-) in drinking water (DWAF, 1993), which may also represent a problem to livestock.
While it is generally accepted that clearing invasive alien vegetation in South Africa will have significant benefits in enhancing runoff from catchments, thus increasing the volumes of water available to people and ecosystems, there have been no studies on the associated impact on groundwater and surface water quality. The leaching of nitrogen from cleared areas into groundwater and surface water is likely, but its true extent is unknown. The main objectives of this study were to quantify N accumulation in soils, leaching and groundwater contamination from land invaded by, and cleared of alien vegetation.
Materials and methods
A one-year field experiment was carried out during 2007 at Riverlands Nature Reserve and the neighbouring Burgerspost farm (Fig. 1), about 10 km south of Malmesbury (Western Cape Province). The site is located in the catchment of the Groen River, which drains into the Diep River. Mean annual rainfall is about 440 mm, most of it occurring from May to August. Daily temperatures vary from a monthly minimum of 7.0°C in July to a monthly maximum of 27.9°C in February, and there are about 3 d of frost per year. The mean annual evaporation is about 2 150 mm and daily evaporation exceeds rainfall for about 70% of the time. The coarse sandy Vilafontes soil (Soil Classification Working Group, 1991) or Luvic Cambisol (FAO, 1998) of marine and aeolian origin is deep, well-leached and generally acidic. The dominant vegetation type in the Riverlands Nature Reserve is Atlantis Sand Plain Fynbos (Rebelo et al., 2006), one of the 11 forms that occur on the coastal plains of the western and southern parts of the Western Cape. The average canopy cover measured with an AccuPar (Decagon Inc., USA) was 69% (±20%) in the range of photosynthetically active radiation. The Burgerspost farm is separated by a barbed wire and track from the fynbos site in the reserve, and invaded by Acacia saligna. The Acacia trees occurred in clumps with open spaces in between them, the average cover over the entire plot being about 45% (± 34%). The Burgerspost farm was within the boundaries planned for clearing by WfW and free of human activities, except occasional cattle grazing. The total invaded area of the Burgerspost farm was approximately 20 ha with extensive invasions occurring also on surrounding land.
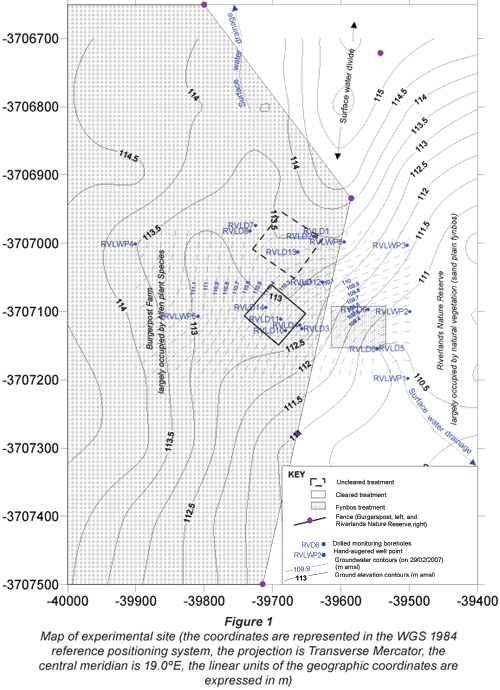
Intensive data collection and modelling took place from May to October 2007, which represents the winter rainfall season in the Western Cape when most leaching occurs. Three monitoring treatments were established (Fig. 1), namely:
- A site invaded by Acacia species to be cleared. This site was cleared of alien invasives by the WfW Programme on 18 June 2007, and it will be further referred to as 'cleared' treatment.
- A site invaded by Acacia species to be used as control, further referred to as 'uncleared' treatment.
- A site with natural vegetation to be used as background, further referred to as 'fynbos' treatment.
The treatments were positioned based on a topographical survey with Real-Time Kinematic (RTK) Geographical Positioning System (GPS) on East-West lines 100 m apart, a deep resistivity survey with LUND imaging system to determine the underlying geologic framework, and initial borehole drilling to establish the direction of groundwater flow. Fourteen mechanically drilled boreholes and six shallow hand-augered well points were used to monitor water level and quality (Fig. 1). Figure 1 also shows the elevation contours and groundwater level contours as at 28 February 2007. Groundwater flow direction is generally from North-West to South-East.
Based on a resistivity survey and borehole logs, the site is underlain by a homogeneous and isotropic sandy aquifer. A clay layer was consistently observed at depths of between 5 and 7 m below ground level. A comparison of water levels in boreholes showed that the water level in the upper sandy layer was consistently higher than that of the underlying clay layer (aquitard) suggesting possible downward flux across the clay layer into the underlying aquifer(s). Boreholes RVLD1, RVLD 3, RVLD5 and RVLD7 were drilled into the deeper aquifer, whilst all other boreholes were drilled into the upper sandy aquifer (Fig. 1). Manual measurements of groundwater levels were taken approximately bi-weekly. Monthly concentrations of N (NO2-+NO3-, NH4+ and Kjeldahl nitrogen) were measured with standard laboratory methods, after water samples were collected following purging at each borehole.
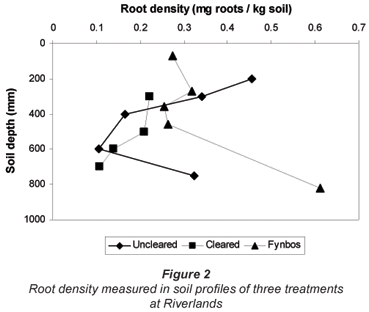
Soil physical and hydraulic properties were determined for the three treatments, in particular texture by sieving, bulk density, porosity and soil water retention characteristics of undisturbed soil cores with an Eijkelkamp soil water retention system (sand box and clay box; Eijkelkamp, The Netherlands). Root density was determined in disturbed soil samples collected at approximately 50, 200, 400, 600 and 800 mm depth in three soil profiles of each treatment. Soil samples of about 5 kg were taken at distances of 1 to 2 m from tree trunks and bushes. The soil samples were sieved and washed to separate roots from mineral particles. The roots were then dried in the oven at 40ºC for at least 2 d. Root density was expressed as mg of dry roots per kg of soil.
In each of the treatments, hourly measurements of volumetric soil water content were carried out with Echo-systems (Decagon Inc., USA). Five Echo-TE sensors were installed and connected to one EM20 logger at representative sites in each treatment. Three sensors were installed in a profile adjacent to the stem of bushes/trees (close to the main root system and below the bulk of the vegetation canopy), at depths of 50, 400 and 800 mm. The other two sensors were installed in a profile 1 to 2 m away from the stem of bushes/trees and on patches clear of vegetation canopy, at depths of 50 and 800 mm. The calibration supplied by the manufacturer for mineral sandy soils was used and data were managed with DataTrac software (Decagon Inc., USA). The point measurements obtained with the Echo-sensors were deemed suitable for the purpose of this experiment, where negligible overland flow was expected due to the sandy nature and spatial uniformity of the soil.
Nitrogen concentrations in soil samples collected in each treatment were measured approximately every 2 weeks during 2007. Three soil profiles (representing three replications to account for spatial variations occurring under field conditions) were augered manually in each treatment and soil samples were collected at depths of 0 to 50 mm (further referred to as 50 mm), approximately 400 and 800 mm. Chemical analyses were done on 1:5 soil: water ratio extracts that were prepared by shaking 10 g of air-dried soil in 50 mℓ of distilled water for 15 min and filtering through a Whatman's filter paper. Standard AutoAnalyzer methods were used to measure NO2-, NO3- and NH4+ in the extracts of the soil samples. The chemical analysis results of the three replicated samples were averaged.
Weather data were obtained from the Malmesbury station managed by the South African Weather Services. Manual rainfall measurements were taken with standard rain-gauges on a daily basis by Riverlands Nature Reserve.
All field and laboratory measurements served to collect data related to nitrogen leaching, interpret them and/or use them as inputs for modelling. A step-wise procedure was used in the modelling exercise. Firstly, empirical functions were developed to describe transformation processes of N in top-soils using field measurements. Nitrogen in top-soils represented the source of nitrogen in the system and input to the unsaturated zone model HYDRUS-2D (Simunek et al., 1999). The 2nd step consisted of simulating water and nitrogen fluxes with HYDRUS-2D. The HYDRUS-2D model was deemed suitable for simulating a system of predominantly rapid vertical fluxes in the unsaturated zone of the sandy soil at Riverlands. This model was therefore used to estimate recharge and nitrogen leaching to groundwater. In the 3rd step, Visual MODFLOW, including MODFLOW (McDonald and Harbaugh, 1988) and MT3DMS code (Zheng and Wang, 1999; Zheng et al., 2001), were used to predict the spatial distribution of nitrogen concentration in groundwater, based on input data of recharge and nitrogen leaching obtained with HYDRUS-2D. Calibration of the water fluxes in the unsaturated zone was done by comparing HYDRUS-2D model outputs to Echo-sensor measurements of volumetric soil water content. Calibration of the nitrogen fluxes in the system was done by comparing the Visual MODFLOW spatial outputs of nitrogen concentrations to those measured in the boreholes.
Experimental results
All soil samples analyzed fell in the category of sandy soil. The largest portion of soil particle sizes is in the range of medium sand (between 19.0 and 39.2%) to fine sand (between 19.6 and 56.1%). In some instances, a large fine gravel fraction (up to 31.3%) was measured in layers deeper than 1.3 m. The portion of clay and silt is between 0.3 and 1.9%. Bulk densities are between 1 420 and 1 580 kg·m-3 whilst porosities are between 0.26 and 0.36. The water release from the soils in the 'cleared' and 'uncleared' treatments (fine sand is predominant fraction) is slower and more gradual than in the 'fynbos' treatment (medium sand is the predominant fraction).
Groundwater levels were between 2 and 5 m depth at the beginning of 2007 and rising with the onset of the rainy season (May 2007). The shallowest groundwater depths (between 1 and 4 m) were reached during the months of August and September 2007. The range of rise in groundwater level was therefore about 1 m. Groundwater levels started falling after September 2007. Although the patterns of root density profiles were typical for the top-soil (higher root density close to the surface compared to deeper layers), high root densities were also recorded at about 800 mm soil depth for the 'fynbos' and 'uncleared' treatments (Fig. 2). This may indicate phreatophytic behaviour of both fynbos and Acacia species, with enhanced root development close to the water table.
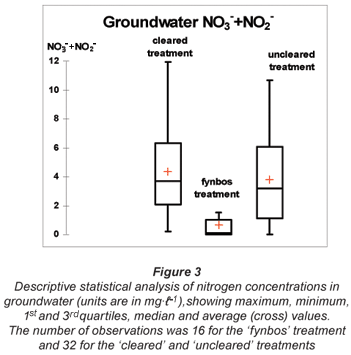
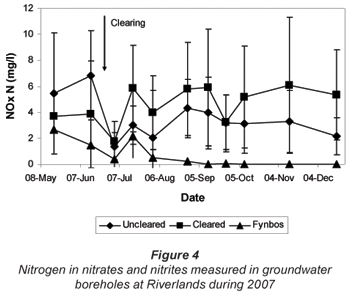
Total nitrogen in nitrate plus nitrite (N in NOx) measured in groundwater boreholes during 2007 is shown in Fig. 3. Data represent seasonal averages of N in NOx measured in shallow boreholes located within or adjacent to the treatment plots. These boreholes were RVLD2, RVLD8, RVLD12 and RVLD13 for the 'uncleared' treatment, RVLD4, RVLD 10, RVLD11 and RVLD14 for the 'cleared' treatment, and RVLD6, RVLD 9, RVLWP1 and RVLWP2 for the 'fynbos' treatment (Fig. 1). Average water quality data are therefore represented for groups of boreholes, each grouping representing a treatment. Total N in NOx in groundwater tended to increase during the rainy winter period, although the average values were always < 7 mg · ℓ-1 (Fig. 4). Leaching occurred mainly from the 'cleared' and 'uncleared' treatments. Concentrations of N in NOx in groundwater of the 'cleared' treatment were generally higher compared to the 'uncleared' treatment, especially after clearing occurred on 18 June 2007. These differences, however, were not statistically significant (Fig. 3). The absolute maximum groundwater concentration of N in NOx was 12 mg · ℓ-1 (Fig. 3) measured on 12 September 2007 in the RVLD10 borehole ('cleared' treatment, Fig. 1). Total N in NOx measured in the 'fynbos' treatment, used as background, was always low (Fig. 3), and significantly lower in the latter part of the season compared to the invaded sites (Fig. 4). The highest background value of N in NOx was 3.3 mg·ℓ-1 in borehole RVLD9 on 17 July 2007. The water quality target for domestic use is N in NOx < 6 mg·ℓ-1, with a maximum value of 10 mg·ℓ-1 (DWAF, 1993).
Oxidised forms of N were dominant in the soil-groundwater system, mainly due to the predominantly aerobic conditions of the well-drained sandy soil. Concentrations of Kjeldahl N (reduced nitrogen as ammonia plus nitrogen derived from organic matter) were always < 4.5 mg·ℓ-1 for all boreholes, whilst seasonal average N in NH4+ was about one order of magnitude lower than oxidised forms of N, namely 0.15 mg·ℓ-1 in the 'uncleared' treatment, 0.39 mg·ℓ-1 in the 'cleared' treatment and 0.18 mg·ℓ-1 in the 'fynbos' treatment boreholes. Kjeldahl N and ammonia were often below detectable levels. It was therefore decided to consider only the oxidised forms of N in the modelling exercise.
Modelling
The 1st step of the modelling procedure was to quantify the source of leachable nitrogen in the soil-groundwater system to be used as input in the HYDRUS-2D model. The concentrations of nitrate plus nitrite measured in 1:5 soil: water ratio extracts were converted into concentrations in the soil solution using soil water content values measured with the Echo-TE soil water sensors. It should be noted that the concentrations of NO2- as well as NH4+ in the soil extracts were generally measured to be one order of magnitude smaller than the concentrations of NO3- (Jovanovic et al., 2008). The dominant trends of N in NOx concentrations over time are visible in the graphs in Fig. 5. Soil concentrations of N in NOx were much lower in the 'fynbos' treatment compared to invaded land (measured data points in Fig. 5). The concentrations of N in NOx tended to be lower in deeper soil layers compared to the top-soil. The depth of 0 to 50 mm was the shallowest sampling depth and it represented top-soil nitrogen concentrations. Therefore, measurements of N in NOx at this depth represented the source of leachable nitrogen in the soil-groundwater system described with the models. Both HYDRUS-2D and Visual MODFLOW were run on a daily time-step, and they read the time dimension as days after the beginning of the simulation. For this reason, a polynomial fit was drawn through the measured data points representing N in NOx concentrations in the top-soil (50 mm soil depth, Fig. 5). The polynomial equation was found to be the most suitable trendline depicting daily changes in N in NOx concentrations over time for the period of intensive data collection (rainfall season from May until October 2007).
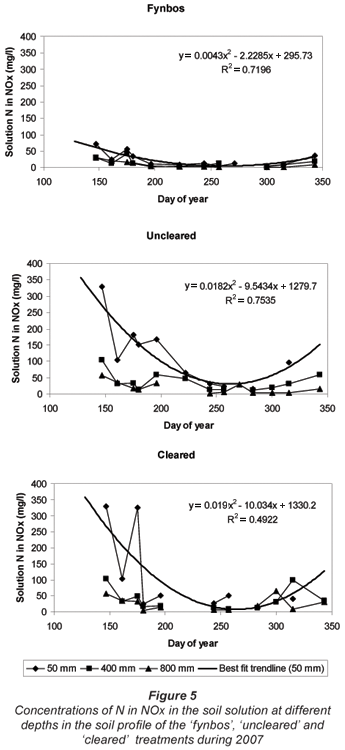
The 2nd step of the modelling procedure was to estimate the amount and quality of leachate travelling along the soil profile and reaching groundwater. Data of N in NOx concentrations were used as input in the HYDRUS-2D model. In particular, initial concentrations at the three depths of measurement in the soil profile were used for each treatment. The polynomials describing N in NOx concentrations at 50 mm soil depth (top-soil) over time were used in the HYDRUS-2D model to represent concentrations at the atmospheric boundary condition (soil surface), e.g. the source of N salts for rain water infiltrating into the soil. Extreme peaks in NOx concentrations in the soil solution were measured occasionally during the rainy season, possibly due to dry spells with high temperatures that sped up the mineralisation processes. Inorganic nitrogen was then leached by rains after these dry spells through preferential flow paths, possibly along plant roots. These extreme peak values were excluded from Fig. 5 and the calculation of the polynomials because they were considered localised occurrences due to micro-climatic conditions (Jovanovic et al., 2008).
Simulations with HYDRUS-2D were run from 15 May 2007, which represented the beginning of the rainy season, to 31 December 2007 for all 3 treatments. The main processes simulated were water flow, solute transport and root water uptake. A vertical plane in rectangular geometry was simulated with a homogeneous profile. The initial condition in water pressure head was established by setting pressure head = 0 at the bottom nodes with equilibrium from the bottom nodes upwards. The hydraulic properties model was Van Genuchten-Mualem with no hysteresis. The soil hydraulic parameters were obtained from textural analyses, soil water retention properties and average bulk density. The Feddes' water uptake reduction model incorporated in HYDRUS-2D was used with no solute stress, and parameters from the database of vegetation characteristics were chosen to be the closest possible to the type of vegetation in the three treatments. In this study carried out on very sandy soils, the bulk of the solute transport occurred by convection and the molecular diffusion coefficient in free water was assumed to be 0.001 m2·d-1. No sorption of nitrates and nitrites was considered as it was assumed to be negligible in the very sandy soil. The vertical rectangular dimension of the simulated geometry was 1.5 m. The boundary conditions were:
- Atmospheric top boundary flux (rainfall, transpiration and evaporation)
- No flux at all other boundaries (the bottom boundary was also set at no flux to simulate the build-up of the water table during the rainy season). Root distribution was set down to the water table, as such root densities in the soil profile were measured (Fig. 2).
The time-variable boundary conditions linked to the atmospheric boundary were rainfall, N in NOx concentrations at 50 mm soil depth (Fig. 5) and potential evapotranspiration. In order to calculate potential evapotranspiration, grass reference evapotranspiration (ETo) was first calculated from weather data obtained for Malmesbury from the South African Weather Services using the Penman-Monteith equation (Allen et al., 1998). Reference evapotranspiration was then converted into potential evapotranspiration of fynbos and Acacia spp. stands by multiplying ETo by a factor Kc, commonly known as crop coefficient because the methodology is mainly used to predict crop water requirements (Allen et al., 1998). As evapotranspiration was not measured in the study area and no literature data were available, the value of Kc was estimated to be 1.5 for fynbos and 1.8 for Acacia spp. (Jovanovic et al., 2008). Potential evaporation from bare soil in the 'cleared' treatment was calculated using the method recommended by Allen et al. (1998).
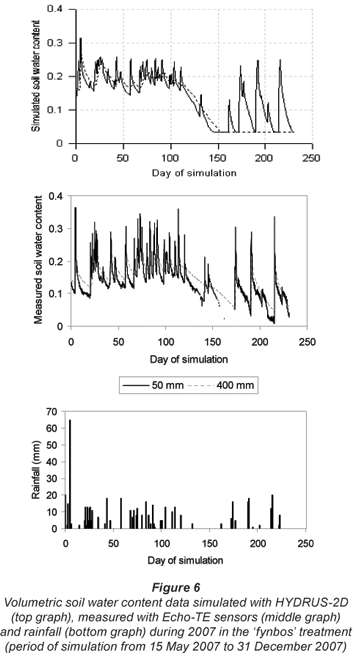
Volumetric soil-water content data measured with the Echo-TE sensors were used to calibrate the HYDRUS-2D model for the unsaturated zone, and ensure a reliable simulation of recharge and leaching in a system where the dominant mode of solute transport is by convection. An example of measured and simulated soil water content data are shown in Fig. 6 for the 'fynbos' treatment. It is clear from the data that all soil water content sensors, as well as the model's water contents responded to rainfall during the 2007 winter season. In general, volumetric soil water content had a tendency to increase during the winter months and it started decreasing from day 120 of the simulation (11 September 2007). In the first 20 d of simulation, simulated values were higher than measurements, in particular in the top-soil (50 mm depth). This could have been due to disturbance that occurred at installation of the sensors. Some time is required for the soil to settle and regenerate hydraulic connectivity after digging and re-packing the soil profile. The initial simulated soil water contents depended on equilibrium conditions in relation to the free water table set at the bottom of the profile. Simulated soil water contents matched measured data very well thereafter. An extensive discussion on the calibration of HYDRUS-2D for this study can be found in Jovanovic et al. (2008).
Upon completion of calibration, HYDRUS-2D was used to estimate cumulative water fluxes (evapotranspiration and recharge) and cumulative solute fluxes at the bottom nodes (N leaching below 800 mm soil depth) for the three treatments. The output data obtained with HYDRUS-2D are summarised in Table 1. Seasonal rainfall was 454 mm.
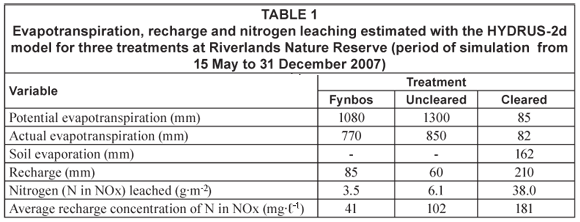
Evapotranspiration was higher in the 'uncleared' compared to the 'fynbos' treatment, because of the higher Kc used. High water uptake was predicted during the summer dry season for both treatments, with the deep root system tapping into the water table. As a result of higher water use by alien invasive vegetation, lower recharge (about 60 mm or 13% of rainfall) was calculated compared to fynbos (Table 1). Due to the higher concentrations of N in the soil solution (Fig. 5), more solutes (6.1 g·m-2) were predicted to be leached from the 'uncleared' treatment compared to the 'fynbos' treatment (Table 1). This also resulted in a more concentrated leachate compared to fynbos. The 'cleared' treatment had plants only for about a month (from 15 May 2007 to 18 June 2007, when the trees were cleared). From then on, root water uptake was not simulated and only soil evaporation represented losses at the atmospheric boundary. Due to the absence of root water uptake and plant transpiration for most of the season, the soil profile in the 'cleared' treatment was wetter compared to the other two treatments. As a result, more recharge occurred, totalling about 210 mm (46% of rainfall). Leaching was also much higher, totalling about 38 g·m-2, as was leachate concentration. This indicated that, immediately after clearing land of alien vegetation, an increase in recharge, leachate and leachate concentrations was predicted compared to the 'uncleared' treatment. The values of evapotranspiration, recharge and average recharge concentration of N in NOx (Table 1) are subject to a certain degree of uncertainty depending on the accuracy of input data, spatial variability as well as the assumption made in the process model. They were, however, used further in the spatial predictions of groundwater contamination because they represented the best available estimates as well as to ensure consistency in the modelling procedure.
The third step in the modelling procedure was to determine the spatial distribution of nitrogen in groundwater. The outputs of HYDRUS-2D, namely evapotranspiration, recharge and concentration of N in NOx in recharge, were used as inputs in Visual MODFLOW in order to predict the nitrogen spatial distribution occurring in the shallow sandy aquifer at Riverlands. A 10 m x 10 m grid size was configured in MODFLOW. This grid was dense enough to locate each observation borehole in a different cell of the grid. Ground elevations, bottom layer of the aquifer (clay layer for which elevation data were obtained from borehole logs), initial heads measured on 28 February 2007 and observed groundwater concentrations of N in NOx were imported into Visual MODFLOW. The neural network prediction of HYDRUS-2D calculated a saturated hydraulic conductivity of 11.46 m·d-1, given the soil properties at the experimental site. This value of saturated hydraulic conductivity was used in MODFLOW for the entire area. Specific storage was assumed to be 0.0001 m-1 and specific yield was 0.25 (Saayman et al., 2007). Porosity was assumed to be 0.35 based on soil measurements. Initial groundwater concentrations of N in NOx were entered in the grid for areas representative of each treatment, based on the measured concentrations in borehole water sampled at the beginning of the season. The initial concentrations of N in NOx for groups of boreholes within each treatment were averaged. The average values were 1.60 mg·ℓ-1 for the 'uncleared' treatment, 1.78 mg·ℓ-1 for the 'cleared' treatment and 0.75 mg·ℓ-1 for the 'fynbos' treatment. Default values were used for longitudinal dispersivity (10 m), horizontal to longitudinal dispersivity ratio (0.1), vertical to longitudinal dispersivity ratio (0.01) and molecular diffusion coefficient (0.001 m2·d-1). No sorption and kinetic reactions were simulated for N. A constant head and a constant groundwater concentration of N in NOx (1.60 mg·ℓ-1) were assigned as boundary conditions to the top left edge of the grid, based on the interpolated initial and output values of groundwater head in the vicinity of this boundary, as well as the initial N concentration measurements in the 'uncleared' treatment.
Steady-state simulations were carried out with the Visual MODFLOW package. Groundwater flow was simulated with MODFLOW, whilst groundwater concentrations of N in NOx were simulated with MT3D. In the calibration analysis between observations and predictions of groundwater head, a mean absolute error of 0.55 m was calculated for all boreholes. This error was considered to be within an acceptable range. In many ways, the type of problem dealt with in this study is of a transient nature, as it deals with pulses of solutes entering groundwater through recharge. However, a much more detailed and localised data set would be required for transient simulations compared to the spatial data set collected for this study. Figure 7 (top map) presents the predicted spatial distribution of groundwater concentrations of N in NOx. The values were just above 4 mg·ℓ-1 in groundwater underlying the 'cleared' treatment plot, about 2.0 mg·ℓ-1 on invaded land and about 1.0 mg·ℓ-1 on fynbos land. These simulated values of groundwater concentrations of N in NOx approached the seasonal average values measured in boreholes within each treatment. The measured values were 4.40 mg·ℓ-1 for the 'cleared' treatment, 2.72 mg·ℓ-1 for the 'uncleared' treatment and 0.66 mg·ℓ-1 for the 'fynbos' treatment. The predicted values were also well within the 1st and 3rd quartiles of seasonal measurements in each treatment (Fig. 3) that may be seen as ranges of natural uncertainty. This gave confidence that, given the uncertainties of inputs and the assumptions made in the process modelling system, the predictions were within an acceptable range of natural variability. It is interesting to note that abrupt changes in groundwater concentrations were predicted at the interfaces between treatments, in particular at the edge of the 'cleared' treatment plot and along the fence of the nature reserve (Fig. 7). It should be noted that the configured grid of Visual MODFLOW did not match perfectly these interfaces in the background map.
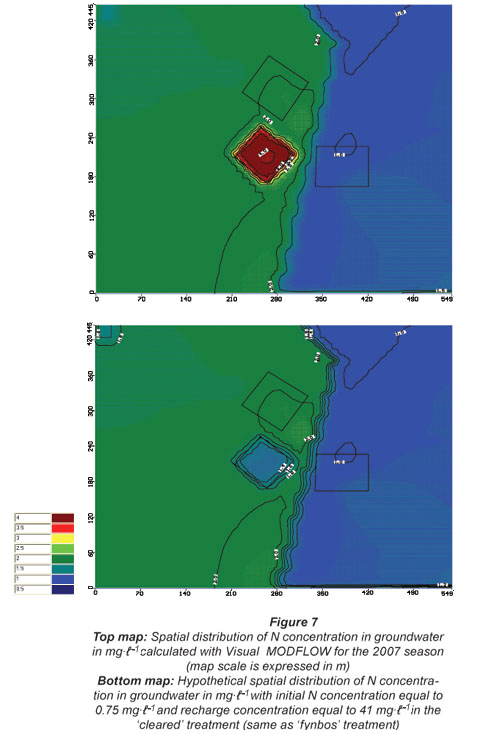
The main outcome of the field measurements and modelling exercise was that clearing alien Acacia species induces a fast release of nitrogen due to decreased evapotranspiration and increased recharge. However, in the long run, the increased N concentrations in groundwater underlying cleared land will continue only until all the leachable nitrogen has been depleted from the soil. Total leachate and leachate concentrations are therefore expected to decrease over time to background levels. A hypothetical simulation with Visual MODFLOW was run using the same initial groundwater concentration (0.75 mg·ℓ-1) and recharge concentration (41 mg·ℓ-1) in the 'cleared' treatment plot as for the 'fynbos' treatment (Table 1). The predicted N concentration in groundwater underlying cleared land was about 1.4 mg·ℓ-1 (Fig. 7, bottom map), still higher than the value predicted on fynbos land, because of the lower evapotranspiration and higher recharge compared to fynbos, as well as the effect of invaded land surrounding the 'cleared' treatment plot.
Conclusions
Based on the experimental data and modelling, the main research findings were:
- Nitrogen levels in soil and groundwater were higher in alien-invaded areas compared to fynbos land
- A quick release of NO3- into groundwater occurred after clearing land from alien invasive legumes, due to high residual N reserves in the rooting zone of invasive legumes, decreased evapotranspiration and increased recharge
- The long-term effect of clearing alien invasive legumes is the reduction of N concentrations in groundwater.
Increases in N concentrations in groundwater underlying cleared land will occur only until all the leachable nitrogen has been depleted from the soil. A decrease in N concentration in groundwater can be expected thereafter. Clearing land of alien invasive legumes may therefore have a beneficial effect on reduced groundwater contamination from nitrate, besides reducing water use in catchments. The time required to reach these conditions after clearing will depend on weather, in particular rain water percolating down the profile as the main leaching agent, with soil moisture and temperature being the main factors for mineralisation, as well as the plant species composition of the re-colonising fynbos. Concentrations of N will also depend on conditions conducive to denitrification. It will be beneficial to test the outcomes of this study through monitoring longer than one year, and what are the seasonal patterns of nitrogen mineralisation and leaching.
Elevated N concentrations in groundwater due to Acacia invaded land may have implications on water purification costs because groundwater is the main source of water supply to Atlantis and areas on the West Coast plains of South Africa. In this study, groundwater concentrations of oxidised nitrogen peaked at 12 mg·ℓ-1, although the values were generally well below 10 mg·ℓ-1, which is the South African maximum permissible level for drinking water (DWAF, 1993). However, the true magnitude of the risk to human health will depend on the extent of invaded land as well as the dilution capacity of the water systems.
Acknowledgements
The authors acknowledge the funding by the Water Research Commission (Pretoria, South Africa) and the Department of Water Affairs and Forestry (Working for Water Programme), Riverlands Nature Reserve and Burgerspost farm for providing the experimental site, the South African Weather Services for supplying weather data, Roburgh Geotechnical Engineering CC for drilling boreholes, Tritan Survey CC for the topographical survey and Mr Alan Hon (CSIR, Natural Resources and Environment) for groundwater level measurements and sampling.
References
ABER JD, BOTKIN DB and MELILLO JM (1978) Predicting the effects of different harvest regimes on forest floor dynamics in northern hardwoods. Can. J. For. Res. 8 306-315. [ Links ]
ALLEN RG, PEREIRA LS, RAES D and SMITH M (1998) Crop Evapotranspiration: Guidelines for Computing Crop Water Requirements. United Nations Food and Agriculture Organization, Irrig. Drain. Paper 56. Rome, Italy. [ Links ]
BROWALDH M (1997) Change in soil mineral nitrogen and respiration following harvesting form an agrisilvicultural system in Sweden. Agrofor. Syst. 35 131-138. [ Links ]
COLVIN C (1999) Increased risk of methaemoglobinaemia as a result of bottle feeding by HIV positive mothers in South Africa Proc. Int. Assoc. Hydrogeol. Congress. 6-10 September, Bratislava, Slovakia. [ Links ]
CONRAD JE, COLVIN C, SILILO O, GORGENS A, WEAVER J and REINHARDT C (1999) Assessment of the Impact of Agricultural Practices on the Quality of Groundwater Resources in South Africa. WRC Report No. 641/1/99. Water Research Commission, Pretoria, South Africa. [ Links ]
DOMINSKI AS (1971) N transformations in a northern-hardwood podzol on cutover and forested sites. Ph.D. thesis. Yale University, Diss. Abstr. 32 6775-B, 156 pp. [ Links ]
DWAF (1993) South African Water Quality Guidelines. Volume 1 Domestic Use (1st edn.) Department of Water Affairs and Forestry, Pretoria, South Africa. [ Links ]
DWAF (1997) The Working for Water Programme: Annual Report 1996/97. Department of Water Affairs and Forestry, Pretoria, South Africa. [ Links ]
EHRENFELD JG (2003) Effects of exotic plant invasions on soil nutrient cycling processes. Ecosyst. 6 503-523. [ Links ]
FAO (1998) World Reference Base for Soil Resources. United Nations Food and Agricultural Organization. Rome, Italy. [ Links ]
FUKUZAWA K, SHIBATA H, TAKAGI K, NOMURA M, KURIMA N, FUKAZAWA T, SATOH F and SASA K (2006) Effects of clear-cutting on nitrogen leaching and fine root dynamics in a cool temperate forested watershed in Northern Japan. For. Ecol. Manage. 225 257-261. [ Links ]
HAVLIN JL, BEATON JD, TISDALE SL and NELSON WL (1999) Soil Fertility and Fertilizers: An Introduction to Nutrient Management. Prentice Hall, New Jersey. [ Links ]
HAYNES RJ (1986) Mineral Nitrogen in the Plant-Soil System. Physiological Ecology, a Series of Monographs, Texts, and Treatises. Academic Press, New York. [ Links ]
JOVANOVIC NZ, HON A, ISRAEL S, LE MAITRE D, RUSINGA F, SOLTAU L, TREDOUX G, FEY MV, ROZANOV A and VAN DER MERWE N (2008) Nitrate Leaching from Soils Cleared of Alien Vegetation. WRC Report No. K5/1696, Water Research Commission, Pretoria, South Africa. [ Links ]
JUSSY JH, RANGER J, BIENAIME S and DAMBRINE E (2004) Effects of a clear-cut on the in situ nitrogen mineralisation and the nitrogen cycle in a 67-year-old Douglas-fir (Pseudotsuga menziesii (Mirb.) Franco) plantation. Ann. For. Sci. 61 (5) 397-408. [ Links ]
LE MAITRE DC, RICHARDSON DM and CHAPMAN RA (2004) Alien plant invasions in South Africa: driving forces and the human dimension. S. Afr. J. Sci. 100 103-112. [ Links ]
LE MAITRE DC, VERSFELD DB and CHAPMAN RA (2000) The impact of invading alien plants on surface water resources in South Africa: A preliminary assessment. Water SA 26 (3) 397-408. http://www.wrc.org.za/archives/watersa%20archive/2000/July/1220.pdf. [ Links ]
LEVINE JM, VILÀ M, D'ANTONIO CM, DUKES JS, GRIGULIS K and LAVOREL S (2003) Mechanisms underlying the impacts of exotic plant invasions. Proc. R. Soc. Lond. B 270 775-781. [ Links ]
MA L and SHAFFER MJ (2001) A review of carbon and nitrogen processes in nine US soil nitrogen dynamics models. In: MJ Shaffer, L Ma and S Hansen (eds.) Modeling Carbon and Nitrogen Dynamics for Soil Management. Lewis Publishers, Boca Raton, Florida. 55-102. [ Links ]
MARAIS C, VAN WILGEN BW and STEVENS D (2004) The clearing of invasive alien plants in South Africa: a preliminary assessment of costs and progress. S. Afr. J.Sci. 100 97-103. [ Links ]
McDONALD MG and HARBAUGH AW (1988) A Modular Three-Dimensional Finite Difference Ground-Water Model. US Geological Survey Techniques of Water Resource Investigations, Book 6, Reston, Virginia. [ Links ]
REBELO AG, BOUCHER C, HELME N, MUCINA L and RUTHERFORD MC (2006) Fynbos biome. In: L Mucina and MC Rutherford (eds.) The Vegetation of South Africa, Lesotho and Swaziland. South African National Biodiversity Institute, Pretoria, South Africa. [ Links ] Strelitzia 19 53-219. [ Links ]
SAAYMAN IC, BEEKMAN HE, ADAMS S, CAMPBELL RB, CONRAD J, FEY MV, JOVANOVIC N, THOMAS A and USHER BH (2007) Assessment of Aquifer Vulnerability in South Africa. WRC Report No. TT 1432/1/07. Water Research Commission, Pretoria, South Africa. [ Links ]
SIMUNEK J, SEJNA M and VAN GENUCHTEN MTh (1999) The HYDRUS-2D Software Package for Simulating Two-Dimensional Movement of Water, Heat, and Multiple Solutes in Variably-Saturated Media, Version 2.0. U.S. Salinity Laboratory, USDA, ARS, Riverside, California. [ Links ]
SOIL CLASSIFICATION WORKING GROUP (1991) Soil Classification. A Taxonomic System for South Africa. Dept. of Agricultural Development, Pretoria, South Africa. [ Links ]
STEVENSON FJ (1982) Nitrogen in Agricultural Soils. American Society of Agronomy, Madison, Wisconsin. [ Links ]
STOCK WD, WIENAND KT and BAKER AC (1995) Impacts of invading N2-fixing Acacia species on patterns of nutrient cycling in two Cape ecosystems: evidence from soil incubation studies and 15N natural abundance values. Oecol. 101 375-382. [ Links ]
STONE E (1973) The impact of timber harvest on soil and water. In: President's Advisory Panel Report on Timber and Environment. US Government Printing Office, Washington DC, 427-467. [ Links ]
SWANK WT, VOSE JM and ELLIOTT KJ (2001) Long term hydrologic water quality responses following commercial clear-cutting of mixed hard woods on Southern Appalachian catchment. For. Ecol. Manage. 43 163-178. [ Links ]
VITOUSEK PM (1981) Clear-cutting and the N cycle. In: FE Clark and TR Rosswall (eds.) Terrestrial N Cycles. Processes, Ecosystem Strategies and Management Impacts. Ecological Bulletins, Stockholm, Sweden. 631-642. [ Links ]
VITOUSEK PM and MELILO JM (1979) Nitrate losses from disturbed forests: Patterns and mechanisms. For. Sci. 25 605-619. [ Links ]
YELENIK SG, STOCK WD and RICHARDSON DM (2004) Ecosystem level impacts of invasive Acacia saligna in the South African fynbos. Restoration Ecol. 12 (1) 44-51. [ Links ]
ZHENG C and WANG PP (1999) MT3DMS: A Modular Three-Dimensional Multi-Species Model for Simulation of Advection, Dispersion and Chemical Reactions of Contaminants in Groundwater Systems: Documentation and User's Guide. SERDP-99-1, U.S. Army Engineer Research and Development Centre, Vicksburg, Massachussets. [ Links ]
ZHENG C, HILL MC, HSIEH PA (2001) MODFLOW-2000, the U.S. Geological Survey Modular Groundwater Model User Guide to the LMT6 Package, the Linkage to MT3DMS for Multi-Species Mass Transport Modelling. US Geological Survey Open-File Rep. 01-82, Denver, Colorado. [ Links ]
Received 7 July 2008; accepted in revised form 12 November 2008.
* To whom all correspondence should be addressed
+2721 888 2506; fax: +2721 888 2682;
e-mail: njovanovic@csir.co.za
** Current address: Ninham Shand Consulting Services PO Box 1347, Cape Town 8000, South Africa

