Serviços Personalizados
Artigo
Indicadores
Links relacionados
-
 Citado por Google
 -
 Similares em Google
Compartilhar
Water SA
versão On-line ISSN 1816-7950
versão impressa ISSN 0378-4738
Water SA vol.35 no.1 Pretoria Jan. 2009
A catchment-scale irrigation systems model for sugarcane part 2: model application
NG MoultI; Nl LeclerI, II, *; Jc SmithersI
ISchool of Bioresources Engineering and Environmental Hydrology, University of KwaZulu-Natal, Private Bag X01, Scottsville, 3209, South Africa
IISouth African Sugarcane Research Institute, Private Bag X02, Mount Edgecombe, 4300, South Africa
ABSTRACT
In the face of growing uncertainty regarding water availability to irrigated agriculture in South Africa, a computer simulation model, ACRUCane, has been developed to provide management information to irrigators of sugarcane and catchment water managers. ACRUCane can be used to simulate catchment hydrology, sugarcane yield, irrigation water requirement and water supply. The development and verification of the model is described in a companion paper. In order to illustrate the application of the model, it was configured to represent a catchment in northern KwaZulu-Natal (Pongola) with runoff feeding into a dam which supplied water for a dragline irrigation system. Various 'what if' scenarios representing potential changes to the irrigation system or management practice were assessed. Analysis of the simulated scenarios showed the interdependencies between irrigation application uniformity and irrigation scheduling. Improved application uniformities needed to be combined with improved scheduling to obtain maximum benefit, estimated to be approximately R3 000/ha. Improved scheduling resulted in fewer seasons with water shortages and crop yield reductions. Replacing the dragline system with subsurface drip (SSD) resulted in gains in the proportion of applied water used beneficially and a small increase in crop yields. However, the amount of water applied using both types of irrigation system and the impacts on the dam storage levels were very similar. The increased capital cost of the SSD system relative to the dragline system resulted in marginally lower profits.
Keywords: ACRUCane, irrigation systems, water management, modelling, hydrology, water resources, sugarcane, irrigation economics
Introduction
In light of the increasing pressure facing sugarcane irrigation farmers in South Africa to use water more effectively and to justify existing water use, reliable integrated water management information for both irrigators and water managers is necessary. Many modelling tools have been developed to model the growth of sugarcane and/or to manage water resources. However, until recently no models used in South Africa were capable of providing the necessary management information in an integrated fashion. For this reason, ACRUCane (Moult et al., 2009), a catchment-scale agro-hydrological model for sugarcane, was developed. This model was developed to operate as a sub-model within the ACRU model (Schulze, 1995) and has the capacity to account for the impact of different soils, seasonal weather, irrigation systems and water management strategies on the profitability of irrigated sugarcane, in an integrated catchment context.
The development and results of a verification study for the ACRUCane model are described in a companion paper (Moult et al., 2009). In this paper, a case study is used to illustrate how the ACRUCane model can be used to provide decision support information to irrigators and water resource managers, by being able to account for different types of irrigation systems performing at different levels of efficiency, with different scheduling strategies and different water supply constraints. In order to illustrate this, a scenario consisting of a dragline irrigation system with supply constraints, assumed to be in northern KwaZulu-Natal (Pongola) was simulated using observed climatic data for a hypothetical catchment. The irrigator, wanting to improve profit, could utilise and potentially benefit considerably from economic comparisons of his current system with alternative irrigation scenarios. The new scenarios, representing potentially beneficial changes which could be implemented, were simulated by changing:
- Application uniformity, represented by an improvement in distribution uniformity (DU)
- Scheduling, represented by using an improved demand-based schedule
- Irrigation system type, represented by changing to a subsurface drip irrigation system.
Description of hypothetical catchment and irrigated area
The primary objective of the work reported in this paper was to illustrate the potential of the ACRUCane model as a decision support tool. The model development and verification is reported in another companion paper by Moult et al. (2009). It was thus decided to create a hypothetical catchment based on realistic input parameters, rather than configuring a real catchment and irrigation systems for the ACRU modelling system. Several simplifying assumptions were made and are presented below.
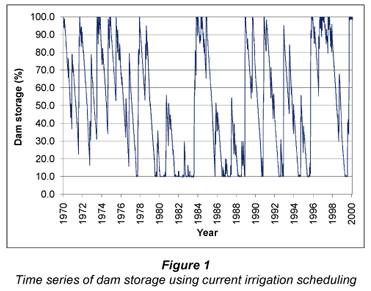
The land cover of a hypothetical 200 km2 catchment was assumed to be veld in good condition. Daily values of maximum and minimum temperature, relative humidity, rainfall, and radiation data from Pongola (27º24'S, 31º18'E) were used to represent the climate of the catchment. The soil type, assumed to be uniform throughout the catchment, was a sandy clay loam with a depth of 0.75 m. Stormflow and baseflow generated by this catchment flow were assumed to flow into a dam constructed at the outlet of the catchment. The dam was assumed to have a capacity of 14 000 000 m3 with a dead storage of 10% of the full supply capacity. This dam was assumed to supply water to an 800 ha irrigation scheme located outside of the catchment. No other abstractions from the dam were assumed. Thus, although the dam was at the outlet of the catchment, the position of the irrigated area was such that stormflow and baseflow generated by the irrigated area did not return to the dam. The soil in the irrigated area was also assumed to be a sandy clay loam with a depth of 1.2 m. The entire 800 ha of irrigation is assumed to be planted to sugarcane with a row spacing of 1.5 m. It was assumed that once the sugarcane had been planted it was harvested for a further 6 ratoons before being replanted. The sugarcane was assumed to be irrigated with a dragline sprinkler system, using fixed summer and winter cycles to irrigate, viz.: 48 mm each week in summer, and 48 mm every two weeks in winter, which is a typical irrigation schedule used by farmers in Pongola (Lecler, 2005). It was assumed that spray evaporation and wind-drift losses were approximately 10% of the irrigation depth applied. Under the specified conditions, the supply of water to the irrigated fields was frequently inadequate to meet the irrigation requirement as the level of water in the dam was often below the dead storage level. A time series of 30 years of daily storage in the dam simulated for the current scenario outlined above is shown in Fig. 1.
Methodology
Input information (menus) for the ACRUCane model was generated to represent the abovementioned hypothetical catchment and irrigation scenario, which is subsequently referred to as the 'current scenario'. By making adjustments to the current scenario, such as irrigation system uniformity, irrigation system type or scheduling, new input menus were created to represent potentially beneficial changes that the irrigator could implement in his operation. A description of each scenario follows.
Scenario 1 uniformity
It was assumed that an infield evaluation of the dragline system revealed the current system to have a DU of 50%, caused primarily by low operating pressures, poor dragline spacing and nozzle wear. By performing the necessary maintenance, for example by replacing worn nozzles, it could be possible to have the system operating at the recommended value of DU, i.e. 75%, as specified by Pitts et al. (1996). Scenario 1 was thus used to represent a system that was essentially identical to the current scenario, except for the improved DU.
Scenario 2 scheduling
Alternatively, if the irrigator did not wish to finance the changes required to obtain the recommended DU, the irrigation scheduling could be improved through the use of a water budgeting model such as CANESIM (Singels et al., 1998) or SAsched (Lecler, 2004). This was represented by scheduling the irrigation such that 40 mm was applied once the soil water had reached a depletion of 45 mm below the field capacity (FC), leaving 5 mm storage to be filled by potential precipitation.
Scenario 3 scheduling and uniformity
In Scenario 3, the improvements in both DU and scheduling of the previous two scenarios were combined to represent an 'ideal' dragline system, viz. DU = 75% and 40 mm applied once the soil water had been depleted to 45mm below FC.
Scenario 4 subsurface drip irrigation
A further option available to the irrigator was to change the system type, for example, to subsurface drip which is often perceived to be more efficient. Application of water directly to the root zone has the potential to optimise irrigation water applied, as very little water is lost to evaporation from the soil surface. For this scenario, an "ideal" subsurface drip irrigation system was simulated by using a DU of 85%, as recommended by Pitts et al. (1996), and by scheduling irrigation such that 6 mm of water was applied once a depletion of 15 mm below FC was reached. Importantly, spray evaporation and wind drift losses were assumed to be zero for this form of irrigation. Furthermore, the fraction of soil wetted by irrigation was assumed to be 3% for the subsurface drip system, whereas it was assumed to be 100% for all dragline scenarios.
Techniques to compare scenarios
By comparing Scenarios 1 to 4 to the current scenario, the feasibility of making the suggested change could be assessed. Scenarios were compared in four ways, viz. impact on dam storage, on estimated recoverable crystals (ERC) yield, on seasonal irrigation efficiency (SIE, as a percentage) and as net return per hectare (NRH in t·ha-1) using 30 years of historical data from Pongola.
SIE is defined in Eq. (1) as the ratio of accumulated transpiration (mm) to the total irrigation and rainfall (Ascough and Lecler, 2005):

where:
ΣT = transpiration accumulated over the course of the season (mm)
ΣI = irrigation accumulated over the course of the season (mm)
ΣR = rainfall accumulated over the course of the season (mm)
SIE represents the fraction of water reaching the crop that was used 'beneficially' by the crop. It is often a valuable way to represent what proportion of different irrigation applications is used beneficially.
Net return per hectare per annum (NRH) is defined in Eq. (2) (Lecler et al., 2005):

where:
R = revenue (R·ha-1)
BPC = base production cost (R·ha-1)
IWC = irrigation water cost (R·ha-1)
EC = electricity cost (R·ha-1),
HC = haulage cost (R·ha-1),
LC = labour cost (R·ha-1),
CapC = capital cost (R·ha-1) and
MC = maintenance cost (R·ha-1).
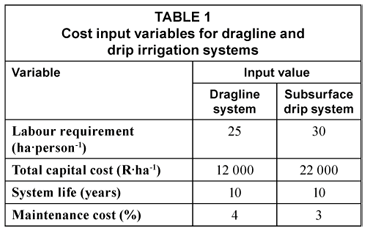
R was computed as the product of ERC yield (t·ha-1) and the ERC price, assumed to be R1 350·t-1 in this study. BPC, which includes fertiliser and seed cane, was assumed to be equal for all scenarios and a value of R4 000·ha-1 was used, based on values presented by Lecler et al. (2005). IWC was assumed to be comprised of a constant water price of R0.123.m-3 and a constant catchment management agency (CMA) levy of R0.01·m-3. EC represents the cost of pumping, and a constant cost of electricity of R0.3·kWh-1 was assumed. The power used was calculated from the total volume of water pumped, the required operating head and the pump efficiency, assumed to be 70% in all cases. The required operating head was determined assuming a static head of 5 m, a 500 m of pipe, a friction loss of 1.5 m per 100 m, i.e. 1.5% and a pressure requirement of 350 kPa for dragline and 110 kPa for drip emitters (Ascough and Lecler, 2004). HC represents the cost of harvesting and transporting cane. This parameter was determined from the product of sugarcane yield and the fixed haulage cost of R45·t-1 derived from Lecler et al. (2005). LC was determined using system specific values of ha·person-1 obtained from Koegelenberg and Breedt (2003), and a fixed labour salary of R8 803·year-1 (Gillit, 2005). CapC was computed using Eq. (3) (Koegelenberg and Breedt, 2003).

where:
int = current interest rate, assumed to be equal to 10.5%
Kk = total capital costs (R·ha-1), with system specific value extracted from Koegelenberg and Breedt (2003)
n = term of repayment (year), taken as the life of the system, obtained from Koegelenberg and Breedt (2003)
MC was estimated as the product of total capital costs and a system specific maintenance percentage which was extracted from Koegelenberg and Breedt (2003). Economic differences associated with different systems and scenarios are accounted for in Eq. (2), thus making NRH a means of assessing the viability of different irrigation options.
The assumed system specific inputs required such as system life and labour requirements are shown in Table 1.
Results
Graphical comparisons of the current scenario with Scenarios 1 to 4 are shown and discussed in Scenarios 1 to 4 respectively.
Scenario 1 uniformity
Percentiles of exceedance for annual periods were determined for ERC yield, SIE and NRH and are shown in Figs. 2, 3 and 4 respectively. Note that the levels of dam storage of the two systems are not included as changes in uniformity have no impact on water supply.
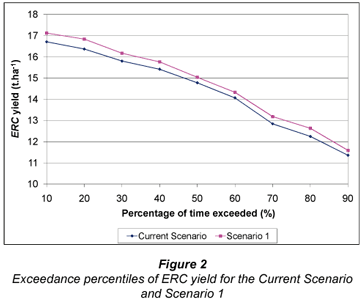
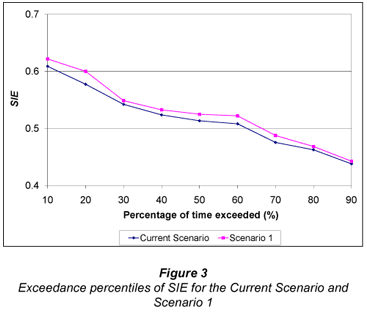
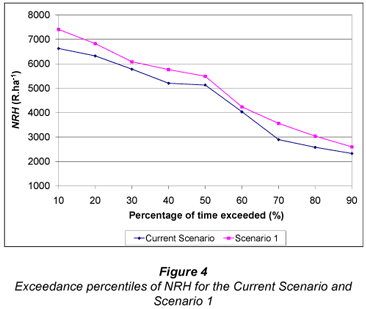
Examination of Figs. 2 to 4 shows that improving DU to the recommended value of 75% resulted in a relatively small increases in yield (3.1% increase on average), SIE (2.2% increase on average) and NRH (10.5% increase on average). More uniform irrigation applications resulted in higher transpiration per mm of water applied, which is reflected in the increase in SIE. As the ERC yield algorithm is a transpiration-based algorithm, the increase in transpiration is reflected in the increase in yield. Apart from a minor increase in harvest and haulage costs due to increased yield, all other costs were identical when comparing the two systems. Consequently, the revenue generated from the increased ERC yield resulted in an irrigation practice that generated, on average, R502 more profit per hectare which translates to R401 600 for the 800 ha system. This provides valuable information to the irrigator, who can compare the cost of making the required maintenance to achieve a DU of 75% with the expected profitability associated with these changes.
Scenario 2 scheduling
In this instance two different scheduling scenarios were being compared, making it necessary to compare the impact of improved scheduling on dam storage and water usage in addition to a comparison of ERC, SIE and NRH. For illustrative purposes, a time series graph of the 30 years of simulated dam storages is shown in Fig. 5.
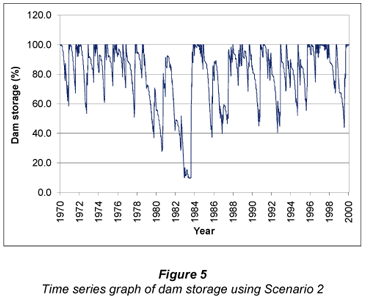
Using the improved scheduling practice of Scenario 2, significantly less water was used each season and as a result the dam only reached the dead storage level once in the 30-year period of simulation. This represents a significant improvement on the dam storage shown in Fig. 1 for the current scenario. The seasonal irrigation water applications for the two scenarios are compared in Fig. 6.
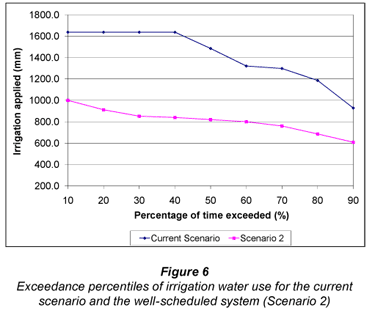
Figure 6 illustrates the considerable difference in water applied per season when comparing Scenario 2 and the current scenario. With the current scenario, 1 638 mm is applied on average per season if water supply is not restricted by supply from the dam, which occurred 40% of the time. With water supply constrained by simulating the dam hydrology, 1 428 mm of irrigation water was applied on average per season. In comparison, the Scenario 2 used only 816 mm on average per season, which equates to a water saving of R 815·ha-1 or R652 000 for the 800 ha irrigated area. A major implication of the improved water usage shown in Figs. 5 and 6 is that the irrigator can potentially irrigate a much larger area without suffering severe water shortages. Comparisons of ERC yield, SIE and NRH are shown in Figs. 7, 8 and 9 respectively.
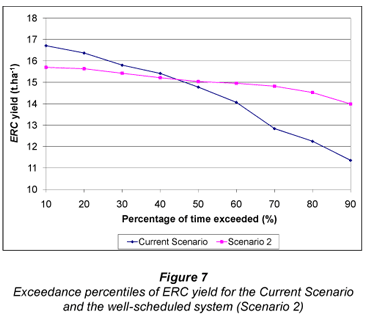
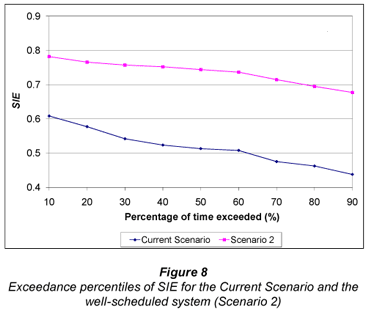
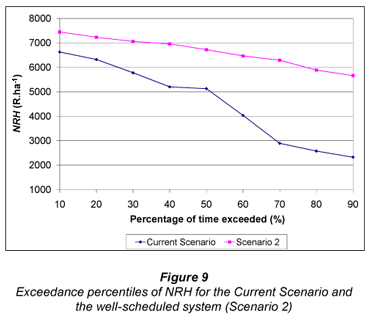
Examination of Figs. 7 to 9 shows that higher yields were obtained with the Current Scenario on 40% of the years compared to yields obtained using the Scenario 2. On average however, marginally higher yields (2.5%) were obtained with Scenario 2. This is explained by the irrigator using more water with the current scenario than with the improved schedule and yields frequently suffered as a result of the dam emptying in the current scenario. Furthermore, the potential benefits of improved scheduling are somewhat negated by the poor DU. Portions of the field were frequently under-irrigated, resulting in stress and reduced yield, whereas the current system applied excessive amounts so that even the drier portions of the field received adequate water. However, the improved timing of the irrigation applications resulted in a much higher SIE (40% on average) for Scenario 2, as is shown in Fig. 8. The slightly higher average yields and considerable reduction in water use resulted in an NRH that was, on average R1 850·ha-1 higher per season which translates into R1 480 000 for the 800 ha irrigated area. As was concluded in the previous section, the potential improvement in profit can be used assess the feasibility of making the associated improvements in scheduling.
Scenario 3 scheduling and uniformity
Comparisons between Scenario 3 and the current scenario of ERC yield, SIE and NRH are shown in Figs. 10, 11 and 12 respectively. Comparison of water use/dam storage is not necessary in this case as the amount of water used by this system is identical to that used in Scenario 2.
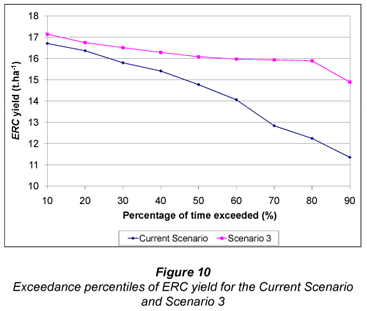
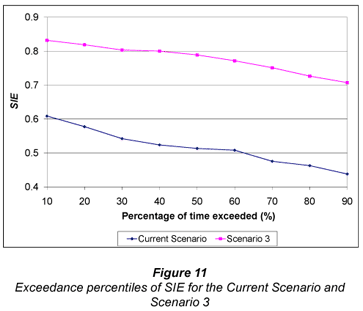
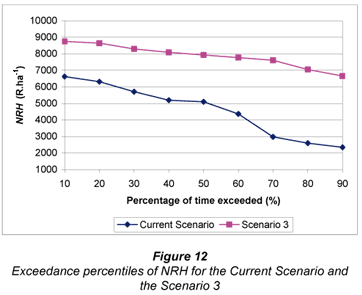
It was shown in Scenario 2 that the benefits of the well-scheduled system were somewhat negated by poor uniformity. Furthermore, in Scenario 1 the effects of uniformity were also, albeit to a lesser extent, negated by a poor irrigation schedule. However, this comparison shows that the ideal system (Scenario 3) performed significantly better in all aspects when compared to the current scenario. Yields were higher and more consistent. Although yields (represented by values with a low exceedance probability) obtained with the current system are only marginally lower than for Scenario 3, yields were generally considerably lower for all percentiles >50%. This can be attributed partially to the fact that in the current scenario the dam was frequently unable to supply the irrigation requirement. Importantly, as was shown in Scenario 2, much less water was used to obtain higher yields. The improved timing and uniformity of application resulted in more beneficial water use, reflected in Fig. 11, where SIE was on average 48% higher than the current scenario. The consistent, high yields and more efficient water use obtained with Scenario 3 resulted in an NRH that was, on average, R3 067.40 per ha higher than the current scenario. This equates to a R2 453 920 increase per annum for the entire 800 ha of irrigated area.
Scenario 4 subsurface drip irrigation
As with Scenario 1, it was necessary to compare the impact of the different irrigation system scenarios on water supply/water usage, as well as ERC, SIE and NRH. Exceedance percentiles of seasonal irrigation applications were compared for all three systems, the results of which are shown in Fig. 13.
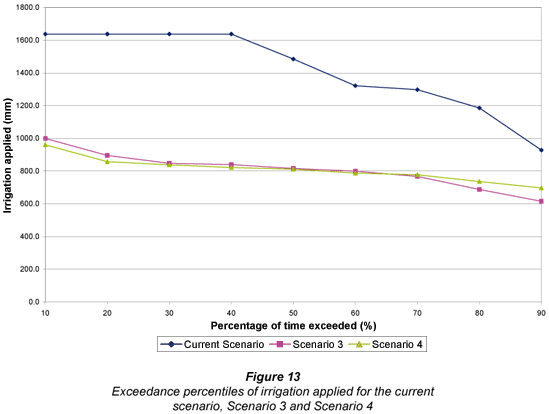
The results in Fig. 13 indicate that the ideal subsurface drip system (Scenario 4) used marginally less water than the ideal dragline (Scenario 3) and considerably less water than the current scenario. Intuitively, a greater difference in water use between Scenario 3 and 4 would be expected as subsurface drip irrigation has the advantage of minimising evaporation of water from the soil surface and there are no spray evaporation and wind-drift losses. However, Scenario 4 was scheduled to refill the soil profile at a much lower depletion than Scenario 3. Consequently, crops grown under Scenario 4 were never subjected to soil water stress and consistently transpired at potential rate. In Scenario 3 the crop was occasionally subjected to mild stress in order to meet the specified depletion level, thus utilising slightly less water during those periods. Since the equation to estimate ERC yield is transpiration based, this deduction is confirmed by the higher yields obtained by the Scenario 4, shown in Fig. 14. A comparison of SIE and NRH is shown in Figs. 15 and 16 respectively.
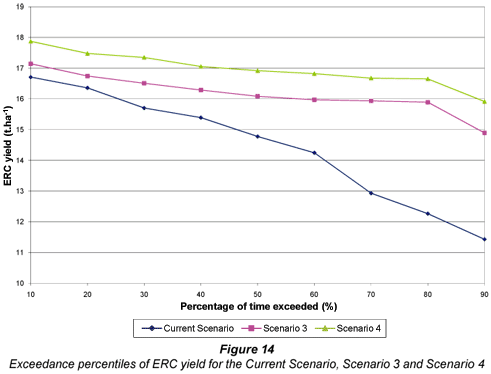
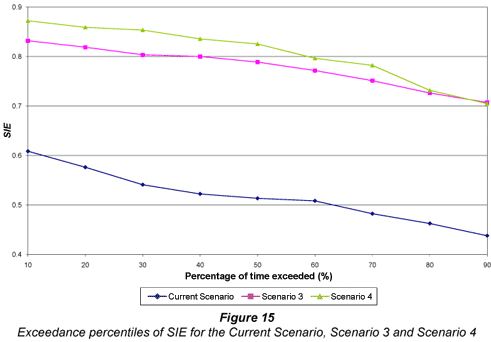
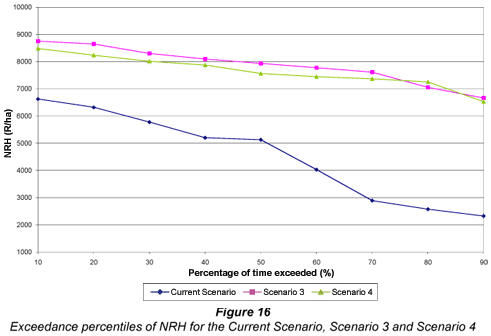
Examination of Figs. 14 to 15 indicates that the ideal drip system (Scenario 4) provided the highest yields with a seasonal average of 16.92 t·ha-1, compared with 16.08 t·ha-1 and 14.62 t·ha-1 obtained for the two dragline systems. Furthermore, Scenario 4 used water more efficiently as is reflected in the highest SIE values shown in Fig. 15. Ultimately this indicates that Scenario 4 made the most beneficial use of applied irrigation water, as it utilised the least amount of water and obtained the highest transpiration per season. As was deduced from Fig. 13, this can be attributed to the fact that the irrigation in Scenario 4 was scheduled at a much lower depletion level than that of Scenario 3. As a result, transpiration in Scenario 3 was occasionally reduced below the potential rate before the soil profile was refilled.
Even though Scenario 4 obtained the highest yields and used irrigation water most beneficially, the increased capital costs associated with a subsurface drip system negated these benefits and resulted in the system being marginally less profitable than Scenario 3. In this instance, the average NRH obtained using Scenario 4 was R7 561.9·ha-1, slightly lower than the R7 841.0·ha-1 obtained using Scenario 3.
Conclusions
In this study the results from several simulated scenarios are used to illustrate the economic benefit of making improvements to irrigation system hardware and/or management. The results can be used to assess the feasibility of implementing the simulated changes. It was shown in Scenario 1 that a large improvement in uniformity resulted in only small improvements in yield, SIE and NRH. However, it is postulated that the benefits of improving uniformity are masked by the poor irrigation schedule used to compare the two systems. Comparison of Scenario 2 and Scenario 3 highlights the impact of uniformity on well scheduled systems. Although these two scenarios were not compared graphically, the mean yield obtained for Scenario 2 was 14.9 t·ha-1 is considerably lower than the mean yield of 16.1 t·ha-1 obtained for Scenario 3. Thus for well-scheduled systems, it can be concluded that considerable benefits can be obtained by improving application uniformity.
The reduction in water costs gained as a result of improved scheduling resulted in significant potential financial gains, as was illustrated in Scenario 2. However, it is argued that the benefit of improved scheduling was somewhat negated by poor uniformity, as average yields were only marginally higher for Scenario 2. Savings made by large reductions in water use resulted in a considerable increase in NRH.
The combined effects of improving scheduling and uniformity are illustrated in Scenario 3. Major improvements in yield, SIE and NRH were noted when compared with the Current System and clearly illustrate the benefit of running a well-managed and maintained irrigation system.
In the comparisons with Scenario 4, Scenario 3 was shown to be the most viable option of all the scenarios that were simulated. Although the ideal drip system (Scenario 4) provided higher yields and utilised applied irrigation more effectively, the high capital costs associated with Scenario 4 made it less financially viable. However, both scenarios out-performed the Current Scenario and resulted in considerable financial gains to the irrigator. Furthermore, all the scenarios that were simulated in the study resulted in financial benefits to the irrigator. Ultimately, the model has provided financial information (NRH) that can be used to evaluate the benefit of making improvements to irrigation systems.
It is concluded that the simulated results presented in this paper have shown that the ACRUCane model, in combination with the ACRU model, has the capacity to provide valuable decision support information to irrigators. It is recommended that the model be used to assess hydrological and economic impacts of potential water conservation and demand management scenarios.
Acknowledgements
Funding provided by the South African Sugarcane Research Institute (SASRI) is gratefully acknowledged.
References
ASCOUGH GW and LECLER NL (2004) Benefits from performing irrigation system evaluations. In: Proc. S. Afr. Sugar Technol. Assoc. 78 263-272. Durban, RSA. [ Links ]
ASCOUGH GW and LECLER, NL (2005) Accounting for uniformity of applied irrigation water using multiple water balances in ZIMSCHED 2.0. Paper presented at the South African National Committee on Irrigation and Drainage Conference. SANCID, RSA. [ Links ]
GILLIT C (2005) Personal communication. South African Sugarcane Growers' Association, Durban, RSA, 10 October 2005. [ Links ]
KOEGELENBERG FH and BREEDT HT (2003) Irrigation Design. Agricultural Research Council, Institute for Agricultural Engineering, Pretoria, RSA. [ Links ]
LECLER NL (2004) SAsched: a water conservation and demand management tool for irrigated sugarcane. Paper presented at the South African National Committee on Irrigation and Drainage (SANCID) Conference, SANCID, South Africa [ Links ]
LECLER NL (2005) Personal communication. South African Sugarcane Research Institute, Mount Edgecombe, Durban, RSA, 24 August 2005. [ Links ]
LECLER NL, ZARTMANN M and SCHULZE RE (2005) Strategic irrigation design and water management decisions: a case study on centre pivots. In: Proc. S. Afr. Sugar Technol. Assoc. 79 447-451. SASTA, Mount Edgecombe, Durban, RSA. [ Links ]
MOULT NG, LECLER NL, SMITHERS JC and CLARK DJ (2009) A catchment scale irrigation systems model for sugarcane Part I: Model development. Water SA 35 (1) 21-28. [ Links ]
PITTS D, PETERSON K, GILBERT G and FASTENAU R (1996) Field assessment of irrigation system performance. Appl. Eng. Agric. 12 307-313. [ Links ]
SCHULZE RE (1995) Hydrology and Agrohydrology: A Text to Accompany the ACRU 3.00 Agrohydrology Modelling System. WRC Report No TT 69/95. Water Research Commission, Pretoria, RSA. [ Links ]
Received 28 March 2008; accepted in revised form 28 November 2008.
* To whom all correspondence should be addressed
+2731 508 7431; fax: +2731 508 7597;
e-mail: Neil.Lecler@sugar.org.za


