


Serviços Personalizados
Artigo
 Inglês (pdf)
 Artigo em XML
 Referências do artigo
Indicadores

Links relacionados
-
 Citado por Google
 -
 Similares em Google
Compartilhar

 Permalink
Water SA
versão On-line ISSN 1816-7950
versão impressa ISSN 0378-4738
Water SA vol.34 no.6 Pretoria Jan. 2008
Integrated monitoring of water allocation reform in South Africa#
AJ AndersonI, *; MS MahlanguII; J CullisIII; S SwartzIV
IIndependent Researcher, London School of Economics and Political Science, Department of Management, LSE, Houghton Street, WC2A 2AE, UK
IIManager, Water Allocation Directorate, Department of Water Affairs and Forestry, Private Bag, X313, Pretoria, 0001, South Africa
IIIIndependent Researcher, University of Colorado at Boulder and Ninham Shand Consulting Services, 81 Church Street, Cape Town, 8001, South Africa
IVGIS technician, Ninham Shand Consulting Services, 81 Church Street, Cape Town, 8001, South Africa
ABSTRACT
South Africa faces significant inequities in the allocation of water for productive purposes. Water allocation is one component of a wider government mandate to address the inequities of the past. Water allocation reform is being implemented by the South African Department of Water Affairs and Forestry (DWAF), through the Water Allocation Reform (WAR) Programme. This paper presents an approach for determining indicators that can be used to monitor targets for WAR and for prioritising areas for specific WAR interventions. The approach integrates water use data with environmental, economic and equity data to provide a holistic picture of the progress and benefits of WAR. Limitations of the approach are discussed, specifically related to the data on which the indicators are based. The development of data for the equity indicator presents specific challenges which are discussed through examples from its application in four case study areas.
Keywords: monitoring, water allocation reform, equity, indicators, South Africa
Introduction
Integrated water resource management (IWRM) is not an end in it itself but a means to achieve the objectives of efficiency, equity and environmental sustainability in water resource management. Anderson et al. (2008) outlined some of the difficulties in defining and using the term IWRM but it is generally agreed that IWRM supports a flexible and adaptable process, promoting the 'coordinated development and management of water, land and related resources in order to maximise the resultant economic and social welfare in an equitable manner without compromising the sustainability of vital eco-systems' (Global Water Partnership, 2003). If an IWRM approach reflects a process and not an outcome, it is important to develop a means of monitoring how effective certain water resource management decisions are in achieving the desired outcomes of efficiently managed, equitably allocated and environmentally sustainable water resources. To this end, water resource management initiatives, that adopt an IWRM approach, should include appropriate indicators, supported by well managed information monitoring systems. Traditional water resource monitoring paradigms have focused predominantly, and with varying degrees of success, on monitoring water quantity and quality. Undertaking water resource management within an IWRM framework now faces the challenge of continuing to improve the traditional hydrological focus areas, while concurrently developing more holistic, cross-disciplinary approaches that have a greater emphasis on 'the air and land phases of the hydrological cycle and the various human impacts'(Nomquphu et al., 2007). This includes social equity, economic benefits and environmental sustainability.
This paper considers IWRM in the context of water allocation reform (WAR). South Africa faces significant inequities in the allocation of water for productive purposes. The South African national government, as public trustee of the nation's water resources, is required to give effect to its legal obligation to ensure equitable access to water. WAR is one component of a wider government mandate to address the inequities of previous access to natural resources, including land and water. WAR is being implemented by the Department of Water Affairs and Forestry (DWAF), through the WAR Programme. The WAR Programme aims to implement the objectives of the National Water Act (NWA) by ensuring the 'efficient and beneficial use of water in the public interest' (NWA, S 27.1.a). In accordance with the NWA, there is a requirement to redress the effects of previously discriminatory legislation, while minimising the impacts on existing users and the economy of the country. The overall outcomes of the Programme should further the key principles of the National Water Resource Strategy (NWRS) (DWAF, 2004):
-
To achieve equitable access to water: that is, equitable access to water services, water resources, and associated benefits
-
To achieve sustainable use of water, by making progressive adjustments to water use to achieve a balance between water availability and legitimate water requirements, and by implementing measures to protect water resources
-
To achieve efficient and effective water use for optimum social and economic benefits.
Compulsory licensing (CL) is one of the main legal instruments in the NWA that can be used to give effect to WAR. CL is a mechanism to reconsider all water-use authorisations in an area so as to potentially achieve significant reform of existing legal access to water (NWA, S 43 to 48). All unlicensed users within an area are required to reapply for their water use entitlement, existing licensed users are subject to the general review of their licence conditions and new water users are invited to apply. The NWA then describes a fairer process of allocation between competing types of users and sectors. The process involves a set of water resource management decisions, leading to a reallocation, with the primary intention of achieving race and gender equity, as well as to meet international obligations and the requirements of the Reserve. While CL is the main legal instrument to implement WAR, the Programme also includes a range of other approaches, such as voluntary transfers and trading.
Over the last few years there has been increasing political pressure in South Africa to show progress in achieving redress. This has been most pronounced within land reform where the government has set a target to transfer 30% of land to Black South Africans by 2014 (Economist, 2007). This pressure has also been transferred to the water sector and WAR has faced increasing pressure to demonstrate progress. In 2006, in order to adequately show progress, DWAF (the project was funded by the UK Department of International Development (DFID) and is hereafter referred to as the DFID project) commissioned a project to develop an approach for estimating allocations to Black users and to test the approach in four pilot water management areas (WMAs). South Africa is divided into 19 WMAs. At the time of the study water management functions were in the process of being delegated to 19 CMAs (catchment management agencies). However, recently DWAF had decided to reduce the number of CMAs that should be established so that each CMA would be responsible for more than one WMA. The DFID project did not consider other aspects of WAR such as economic efficiency or environmental sustainability. In 2007, as a follow-up to the DFID project, DWAF launched a separate project (hereafter referred to as the DWAF project) to consider a more comprehensive framework for monitoring WAR which included economic and environmental indicators. The DWAF project would also expand the approach developed in the DFID project to obtain baseline equity data for the remaining 15 WMAs. Consideration for auditing and evaluating WAR were also included in the project, however; this paper is concerned only with the monitoring component of the framework. These individual indicators are then combined into a composite index, called the Water Allocation Monitoring Index (WAMI). The WAMI values can then be evaluated against specified benchmarks or in comparison to other areas of the country. More importantly, the values for a specific area can be compared over time to demonstrate progress and impacts of WAR. The DWAF project was on schedule to conclude in 2009 with the presentation of WAMI values for all 19 WMAs. However, in May 2008 the project was suspended by DWAF. Much of the raw data supporting the indicators are available but will be analysed once the project is reprioritised by DWAF. This paper outlines the approach and indicators that were approved by DWAF as an initial approach for monitoring WAR. Initial results from the DFID project, as a means of providing data for the equity indicator, are also presented and discussed.
Indicators for water resource management
Indicators provide a summary of conditions and are an ideal means for measuring progress towards a goal (Walmsey et al., 2004). The challenge of a good indicator is to be able to create an index which is characteristic of a whole region, using a relatively small sample (Sullivan et al., 2002). They should provide a convenient way of summarising large amounts of data into a single value, which can then be compared over time or between regions. Well known examples of indicators include using temperature and blood pressure to measure human health, or using the Gross National Product to measure economic trends, or using the Human Development Index, which is an average of three indicators, to measure development. Nomquphu et al. (2007) argue that indicators are a useful means of gauging the sustainability and efficiency of a systems approach to water resources management. An appropriate combination of indicators should be able to assess how well WAR is meeting the objectives of the NWRS, and should provide a tool to shape interventions and activities. Given the complexity of the issues involved in WAR, the development of a good set of indicators is particularly challenging.
Data to support the indicators
The selection of indicators is further complicated by the lack of available data on water use. The Water Authorisation Registration and Management System (WARMS) is a national register of water users that provides information to DWAF's SAP (Systems, Applications and Products in Data Processing) system to assist with billing water users. All authorised water use should be registered on WARMS, which therefore provides valuable information on how much water is being used by different users. WARMS is the only available national data set of water use in South Africa but there are several limitations with using the WARMS data as a basis for water use, these will be discussed below.
-
Firstly, WARMS is based on data collected from water users and, in most cases, these data have not yet been validated or verified by DWAF. Consequently, a number of studies have shown that WARMS does not accurately reflect current water use patterns in the country. Throughout this paper the term allocation is used to refer to registered users in WARMS, although it is acknowledged that there is a disjuncture, in certain, areas between water allocation and water registration. WARMS will become more accurate once the information is verified and validated, a process that DWAF is currently actively supporting in strategic water use areas. Until this process is complete, WARMS can only provide information on broad patters of water use to support national or WMA level planning. Although the indicators are produced at quaternary level, WARMS is not accurate enough to support small scale water use planning.
-
Secondly, water use defined as Schedule 1 use is not required to be registered in WARMS. WARMS therefore does not include small-scale, non-registered users. Schedule 1 use is defined in the NWA as water used for reasonable domestic purposes, small gardening, and the watering of livestock (excluding feedlots). Schedule 1 use can be taken up anywhere in the country without registration. In addition to Schedule 1, General authorisations (GAs) may not always be captured in WARMS. GAs are tools provided in the NWA to cater for the demands of users who use more water than is allowed under Schedule 1 but who, under specific conditions, may be able to avoid the administrative burden of applying for a licence. GAs are required to be registered but they are not always captured in WARMS. Using WARMS as a basis for the indicators means that they can only monitor productive use of water for large-scale commercial activities and therefore cannot monitor changes in small-scale subsistence use or water use for micro enterprises.
-
Thirdly, WARMS does not accurately allow for a division between all water use sectors. Water allocated to municipalities is usually defined in WARMS as water allocated to water service providers (WSPs). Each WSP would then allocate a portion of that water for different users such as industry or domestic use. Without water use information from each WSP, it is not possible to determine the percentage of water allocated to different sectors such as industry. Water that is allocated directly to a specific industry, and not through a WSP, can be identified in WARMS but this is mostly only applicable outside of urban areas. Limiting industrial water use to water use outside of urban areas does not accurately reflect water use within the sector as a whole. Without more information on water allocation to WSPs, the indicators are restricted to monitoring WAR in agriculture and streamflow reduction activities (SFRA). In South Africa, commercial forestry is the only activity that has been defined as an SFRA and so the terms SFRA and commercial forestry are used interchangeably. Although only using commercial agriculture and forestry is a limitation of the data, the agricultural sector alone accounts for in excess of 50% of the water use in South Africa (DWAF, 1999), making it one of the priority areas for WAR. Monitoring within this sector is therefore of particular value.
Objectives of the Indicators
The indicators have been developed to assist with strategic planning within the DWAF National Office, the DWAF regional offices and the future CMAs. More specifically, the objectives of the indicators are to:
-
Use available data to broadly track the progress and impact of WAR across the country.
-
Identify areas of severe inequality in water allocation, which may require priority intervention such as prioritisation for CL.
-
Assist in coordinating planning activities with other relevant departments such as Department of Land Affairs (DLA) or the Department of Agriculture (DoA).
Indicators for monitoring Water Allocation Reform
The indicators selected to monitor WAR cover socio-political, economic and environmental aspects in support of the principles of the NWA. The indicators are presented in Fig. 1 and further defined in Table 1. The indicators attempt to capture the fundamentals of WAR and to support the objectives defined above.

Equity indicators
The equity indicator estimates the percentage of water allocated to Black users and to female individual users. The equity indicator is made up of two components:
-
The percentage volume of female individual allocations The indicator is derived directly from WARMS and is based on an analysis of the 'customer title' field. Entries in the customer title field that were listed as 'Ms', 'Miss' 'Mrs' were defined as female. The data excluded titles that were not gender specific such as 'Dr' or 'Col'. The indicator is only able to assess percentage allocations for individual users and does not include allocations that do not have a title field, such as bulk users and companies.
-
The percentage of water allocated to Black users Data on allocations to Black users are fundamental to measuring progress with WAR but these data are not available in WARMS. Although WARMS has been updated to include a 'race' field, most of these fields have not been completed and it will take several years to obtain this information from all users. The DFID project developed and tested an approach for estimating allocations to Black users. The approach will be introduced below and the results of applying the approach to four WMAs will be discussed in a later section.
Estimating allocation to Black users based on the DFID study
The approach involved identifying registrations in WARMS that are on a property that is also listed by the DLA as a property associated with a land restitution or land redistribution project. The methodology assumed that water registrations on these properties will be transferred to Black individuals or Black-owned entities when the land is transferred. The linking was based on the Surveyor General Code (SG Code). In addition, registrations in WARMS that were located in tribal areas were assumed to be registered to Black users. Tribal areas are often unsurveyed (no SG code available) and so linking was done through the spatial coordinate for the abstraction point which is provided in WARMS. These points were then intersected with a spatial overlay of the tribal areas. Information on land reform and tribal areas was also supplemented with additional information on registered allocations to Black users that was obtained from discussion with regional office staff and Irrigation Boards (IBs)/Water User Associations (WUAs).
Issues and concerns with this indicator
There are a several concerns with the approach used to estimate allocations to Black users.
-
Firstly, the land reform data do not provide information on whether a land restitution claim had been settled financially or through a transfer of land. In many cases, land claims are settled with financial compensation and the existing owner remains on the property. In these instances no transfer of water would take place.
-
Secondly, the indicator assumes that water will be transferred with the land. In some instances the water use entitlement could be sold off the land before the land is transferred. Recently, DWAF and the DLA have been working together to prevent this occurring and they now have a policy to ensure that transfers of land include water. The implementation of this policy will require ongoing coordination and communication between the departments to ensure that land transfers include transfers of water use entitlements.
-
Thirdly, the approach is unable to determine the gender breakdown of estimated Black users. The WARMS data provide a means of estimating gender through the title field, but the DLA data do not currently provide information on the gender of the recipients of DLA projects. One can presume that the land claim recipient is a Black user but one cannot make presumptions about the gender of the claimant. Once WARMS is updated with information on the title holder of new land reform claims, the approach will allow one to determine the gender breakdown of Black users.
-
Fourthly, the approach is dependent on obtaining good spatial data from the DLA. In many parts of the country these data are not available nor do they adequately reflect the actual areas that are under claim.
-
Fifthly, the approach is unable to determine the race or gender of individual users that form part of an allocation to bulk users, such as to IB/WUAs. IB/WUAs receive a bulk allocation and they then allocate the water to different users on properties which cannot be identified in WARMS with an SG code. It is therefore not possible to identify which properties that obtain water from an IB/WUA are also under a land claim. In some regional offices, such as the KwaZulu-Natal (KZN) Regional Office, this limitation does not apply. In KZN, all users, regardless of whether they receive water from an IB/WUA are not, are individually registered. This is a difficult and timely process and most regional offices have not followed this approach. In all areas, excluding KZN, the only way of estimating Black use is to obtain information on percentage allocations to Black users from each IB/WUAs in the area. This involves an equally timely process of individual meetings with IB/WUAs secretaries to obtain their estimated percentage of allocations to Black users. The percentage allocation to Black users within the IB/WUAs can then be spatially interpolated over the IB/WUA area.
- Sixthly, within the agricultural sector there is a growing trend towards engaging in share equity schemes. For example, a White farmer may be sharing the equity of an agricultural initiative with Black labourers but this would not be captured in WARMS because the water use and land are still registered under the White user. In the longer term, this information will need to be included in WARMS by including an ownership or equity share field in WARMS.
These limitations, with the exception of first three, generally indicate that the percentages obtained through this approach represent a minimum value for Black use. If all data on land claims were included, as well as share equity schemes, bulk allocations and small-scale subsistence use, the percentages could increase. This indicator will be further discussed by discussing the results obtained from the application of the approach in four WMAs.
Efficiency indicator
The 2nd key objective of the NWA is to ensure the efficient and effective use of water. While the WAR programme recognises the importance of addressing the inequities of the past, it also recognises the importance of water in the national economy. In order for the economy to grow, it is important that limited resources are used effectively and efficiently to increase the gross domestic product (GDP) of the country and to create employment. The efficiency indicator monitors how many jobs and GDP are created within a specific WMA. The fact that the data only reflects large-scale commercial use means that the indicator does not consider the benefits of small-scale water use as a contributor to poverty alleviation and micro- enterprise activities. The indicator is made up of two components:
-
Contribution to GDP per cubic meter of water registered
-
Contribution to employment per cubic meter of water registered.
Economic data on employment and GDP was obtained from the Quantec Database. Quantec Research (Pty) Ltd is a South African based consultancy who focuses on the marketing, distribution and support of economic and financial database solutions, country intelligence and quantitative analytical software. Urban-Econ purchased the Quantec Database, and extracted the data required as part of the DWAF project. The data were available at local municipal scale, while water allocation data were available at quaternary catchment scale. To address this, aerial interpolation was used to convert economic data at local municipal scale to quaternary catchment scale based on unit area weighting by land cover type. This was possible by using data from the National Land Cover Database. Data on estimated economic contribution for each sector (most importantly for agriculture and forestry) was then determined for each quaternary catchment.
The indicator is then calculated by dividing the total allocation of water to a given sector (only agriculture and forestry were included) by the total contribution to GDP and to employment for that same sector. The indicator provides a means of highlighting the relationship between successful water allocation reform (i.e. significant volumes of water transferred to Black users) and the resulting economic activity (reflected by changes in employment or GDP within that sector). However, it is important to note that one cannot directly attribute changes in economic activity to water reform activities as there may be unrelated factors (such as market forces) that could lead to a reduction in GDP or employment. The efficiency indicator can be used to highlight areas for which additional analysis is required to determine the reason for the reduction or increase in economic activity.
Sustainability indicators
The 3rd key principle supporting the NWA is the sustainable allocation of water. The sustainability indicator reflects whether there is enough unallocated water available to meet the requirements of the ecological Reserve. The purpose of this indicator is to give an indication of the level of compliance with the Reserve, given the current allocation of water in a catchment. A comparatively high indicator is interpreted as having enough water available to meet the requirements of the Reserve once it is implemented. The indicator is calculated by subtracting the total allocation in WARMS (at 98% assurance) from the total yield in the NWRS and considering this as a percentage of the Reserve requirement as listed in the NWRS. It is important to note that this indicator deals with water quantity only and doesn't consider whether the quality aspects of the Reserve are being met, or whether seasonal flow patterns are being achieved.
The Water Allocation Monitoring Index (WAMI)
In order to present an integrated perspective on WAR, the indicators are combined into a single WAMI score. The WAMI is a complex indicator similar to the Human Development Index (HDI) and the Water Poverty Index (WPI). While it is important that each of the key output indicators be considered independently, a combined index presents a general overview that is relevant for communicating WAR progress with politicians and other stakeholders.
Developing indicator scores
One of the critiques of composite indicators is that they often combine different variables for different indicators. To address this, the value of each indicator is first converted to an equivalent score out of 100. This is done by first considering the upper and lower ranges of the values. Values equivalent to 0 and 100 are set. These values can be determined based on a required target. For example, 50% of water allocated to women could be given an equivalent score of 100 for the equity indicator. Alternatively a value could be selected after consideration of the total range of values. Each indicator is thereby scored against itself, removing the concern that one is combining different variables to produce a composite index. Weighting of the individual indicators is also possible and this can significantly affect the outcome of the final indicator.
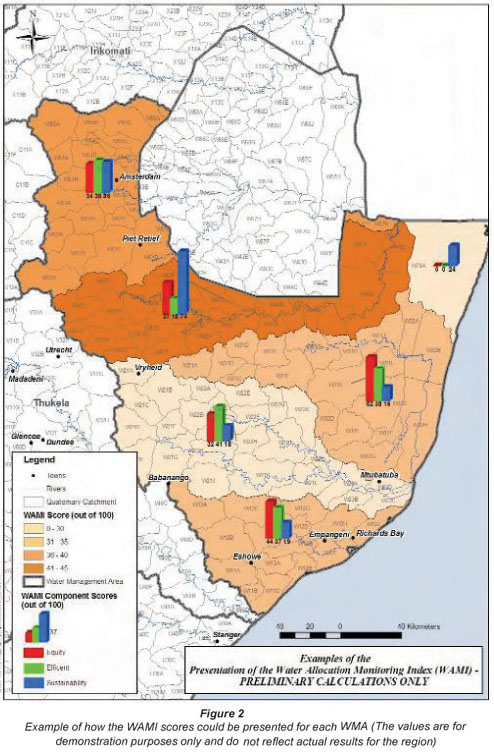
The individual indicator scores, as well as the key component scores should be presented individually so that stakeholders that are interested in a particular aspect, such as equity or efficiency, can easily interpret this aspect from the overall WAMI score. Figure 2 provides an example of how the WAMI score could be presented. The data used in this example are preliminary based on rough estimates of data from the Usutu to Mhlatuze WMA. The data were compiled merely to illustrate how they could be presented once the correct data for each WMA is collected and compiled into the WAMI index.
Results of the DFID Project to monitor equity
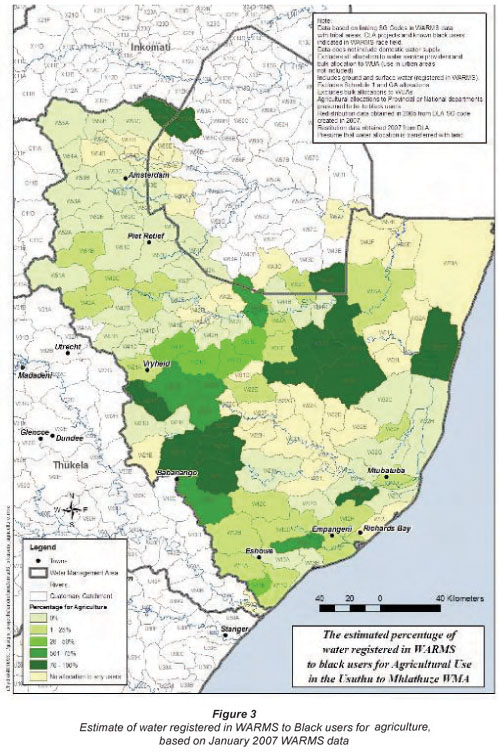
As stated in the introduction, the DFID project developed an approach for measuring existing allocations to Black users and to test the approach in four WMAs. The results of the DFID project would then be used as a basis for the equity indicators used in the WAMI index. At the conclusion of the project, the results were discussed at two workshops with the regional offices responsible for the four WMAs. The results of the DFID project are presented in Table 2 and displayed in Fig. 3. The data are based on DLA data that was obtained in March 2007 and WARMS data obtained in January 2007. The results indicate that 21% to 31% of water across the four WMAs is in Black hands.

Discussion of results
Based on feedback from the regional offices, it was felt that the results provided an adequate estimation of water-use patters within the WMAs. The regional offices emphasised the value of these data as a means of measuring local initiatives to support WAR. Considering the fact that, the regional offices are placed under significant pressure to show progress with WAR, these data provide a baseline against which progress can be measured. The data also assist in determining appropriate targets for reform. Future WAR target in the Inkomati WMA (with a current percentage of 31%) should be different from targets set in the Mvoti to Umzimkulu WMA (with a current percentage of 21%). The differences are even more evident in other provinces. For example, initial estimates for current allocations to black users within the Western Cape WMAs are likely to be below 10%. Setting a 30% target for reform in any of the Western Cape WMAs would require different strategies, timelines and resources compared with WMAs that are already at or above 20%. The results emphasise the importance of setting regionally appropriate targets for each area. The data also provide insight into areas where DWAF should focus more of its attention. For example, in certain parts of the country that do not have significant land reform projects (such as in the Western Cape), DWAF will have to be more proactive in promoting WAR and cannot rely on the WAR benefits associated with land reform. Such areas may need to be considered as priority areas for CL.
The results emphasise the importance of promoting coordination and data sharing between national departments so that common strategic objectives can be understood and shared. The high percentages obtained in the Inkomati area were attributed to the prevalence of land reform activities in this area. In fact, at the regional workshops, DWAF officials indicated that updated 2008 DLA data could increase the percentage beyond 31%. However, it must be clearly noted in interpreting these figures that the DLA data do not distinguish between areas under claim and those already transferred. This means that the 31% reflects the status of WAR once all the DLA claims have been transferred. This has strategic significance for DWAF because it means that in order to ensure the 31%, DWAF should work closely with the DLA to ensure the success of land reform initiatives and to ensure that water and land transfers occur concurrently.
In terms of data coordination between departments, the authors faced significant difficulties in obtaining updated spatial DLA data. The DLA data obtained for the four WMAs listed in Table 2 was fairly accurate but initial investigations in other regions indicates that, in some areas, only 5% of claims have been captured spatially (the DLA is currently in the process of updating all of its spatial data and much of this could be available by 2009). The quality of the DLA data reflects directly on the accuracy of the results obtained in this approach.
The results emphasise some of the difficulties already discussed related to obtaining data on allocations to bulk users, most notably to IB/WUAs. In the DFID project, estimated percentage allocations to Black users were obtained from each IB/WUA through individual meetings with IB/WUA secretaries. This was particularly important for the Inkomati WMA where 58% of the agricultural water in the WMA is allocated to IB/WUAs. In the other three WMAs (all within the KZN Region), the regional office have registered all users individually and little water is registered in WARMS to bulk users. Out of the 19 WMAs, initial estimates indicate that at least 11 WMAs have more than 10% of agricultural water allocated to bulk users. This means that in order to complete the analysis for all WMAs, significant coordination and data sharing would be required between Regional Offices and IB/WUAs.
Finally, it must be acknowledged that the indicators reflect volumetric allocations and do not consider the number of beneficiaries that are involved in a particular project. For example, the results imply that a sugar cane project with a large volumetric water registration to a single Black user is better than a registration for a smaller volume of water that could be benefiting several users. This is particularly relevant in forestry were small scale commercial forestry may be benefiting many users but only using a small volume of water. Furthermore, WARMS currently only makes provision for the registration of 1 individual per water use, when in reality there may be others that are also using the water for commercial activities. Making provision in WARMS for additional users and beneficiaries could provide more data in this regard.
Conclusion
Currently there is no system in place to reliably measure the impact that WAR has on the allocation of water in South Africa. Similar to land reform, WAR, is an essential component in redressing the inequities of the past and ensuring that water is allocated and used in a way that is of greatest benefit to society. These objectives are clearly stated in the NWA and the NWRS. Effective implementation of these objectives requires an appropriate approach to monitoring the impact of WAR, as well as a means of measuring progress over time and between WMAs. This paper introduces an approach for monitoring WAR through the use of indicators that integrate water use data with environmental, economic and equity data. Indicators for each of these three components are then combined into a composite WAMI index. The results could be displayed graphically to easily track progress and impacts of WAR initiatives. Although the national project to complete the WAMI index in all WMAs has been stalled, initial discussions with regional offices indicate that such results would be useful to show progress in meeting targets for which an increasing amount of political pressure is being placed.
Furthermore, the results obtained from estimates of equity data in four WMAs, outline the importance of determining regionally specific targets which reflect existing progress with WAR. The results can also assist in identifying the type of strategies that should be employed to meet WAR targets. For example, the data indicate the percentage of water that could be transferred to Black users if land reforms are successful. By working with the DLA, DWAF could be most effective in reaching WAR targets if it focuses its attention on ensuring that land reform project are successful and that water transfers do take place within those projects. Areas that do not have significant DLA projects would require a different strategy to achieve WAR targets and may be considered as priority areas for CL.
Finally, the results outline the importance of coordinating data collection between national departments and with other entities such as IB/WUAs. In order to complete the WAMI index for the entire country, DWAF will have to promote coordinated sharing of data that will ultimately lead to more accurate estimates of the current status of WAR. As with many IWRM approaches, this will not only require additional resources, but will also involve a high degree of communication between the various directorates within DWAF and with other spheres of government. Overcoming these challenges will provide valuable lessons for other water management initiatives that seek to promote an integrated approach for monitor progress towards IWRM objectives.
Acknowledgement
The authors would like to thank the DWAF Steering Committee as well other members of the project team, including staff at Batseta Consulting, Ninham Shand Consulting Services, Emzantsi Systems, and UrbanEcon
References
ANDERSON A, KARAR E and FAROLFI S (2008) Synthesis: IWRM lessons for implementation. Water SA 34 (6) 665-669. [ Links ]
CULLIS J and VAN KOPPEN B (2007) Applying the Gini Coefficient to Measure Inequality of Water Use in the Olifants Water Management Area. IWMI Research Paper 113.: International Water Management Institute, Colombo, Sri Lanka and Ninham Shand Pty (Ltd). [ Links ]
DEPARTMENT OF WATER AFFAIRS AND FORESTRY (2004) National Water Resource Strategy, First Edition. Available at: ttp://www.dwaf.gov.za/Documents/Policies/NWRS/Default.htm [ Links ]
DEPARTMENT OF WATER AFFAIRS AND FORESTRY (1999) National Water Conservation and Demand Management Strategy Framework. Available at: http://www.dwaf.gov.za/WaterConservation/Doc_AS.htm GLOBAL WATER PARTNERSHIP (2003) Sharing Knowledge for Equitable, Efficient and Sustainable Water Resources Management. Toolbox for IWRM. [ Links ]
GLOBAL WATER PARTNERSHIP (2003) Sharing Knowledge for Equitable, Efficient and Sustainable Water Resources Management. Toolbox for IWRM. Available at: http://www.gwpforum.org/servlet/PSP?iNodeID=215&itemId=210. [ Links ]
NOMQUPHU W, BRAUNE E and MITCHELL S (2007) The changing water resources monitoring environment in South Africa. S. Afr. J. Sci. 103 (1) 306-310. [ Links ]
SOUTH AFRICA (1998) National Water Act, 36 of 1998, Sections 43 to 48. [ Links ]
SULLIVAN CA, MEIGH JR and FEDIW TS (2002) Derivation and Testing of the Water Poverty Index Phase 1: Final Report. DFID, Wallingford, United Kingdom Available: http://www.wca-infonet.org/servlet/BinaryDownloaderServlet?filename=1062148788070_OCC43.pdf&refID=101613. [ Links ]
WALMSEY D, HAVENGA T, BRAUNE E, SCHMIDT C, PRASAD K and VON KOPPEN B (2004) An evaluation of proposed World Water Programme Indicators for Use in South Africa. IWMI Working Paper No. 90. International Water Management Institute, Colombo, Sri Lanka. [ Links ]
THE ECONOMIST, May 3 (2007) Land Reform in South Africa. Available at: http://www.economist.com/world/mideast-africa/displaystory.cfm?story_id=E1_JTNQSRD. [ Links ]
# Revised version. Originally presented at the International Conference on Integrated Water Resource Management (IWRM) entitled: Lessons from Implementation in Developing Countries which took place from 10 to 12 March 2008 in Cape Town, South Africa, at the Cape Town International Convention Centre.
* To whom all correspondence should be addressed.
+44 (0) 20 7837 8888; fax: +44 (0) 20 7713 5158;
e-mail: a.j.anderson@lse.ac.uk

