


Servicios Personalizados
Articulo
 Inglés (pdf)
 Articulo en XML
 Referencias del artículo
Indicadores

Links relacionados
-
 Citado por Google
 -
 Similares en Google
Compartir

 Permalink
Water SA
versión On-line ISSN 1816-7950
versión impresa ISSN 0378-4738
Water SA vol.34 no.5 Pretoria oct. 2008
Determination of selected organochlorine pesticide (OCP) compounds from the Jukskei River catchment area in Gauteng, South Africa
Linda L SibaliI, *; Jonathan O OkwonkwoII; Rob I McCrindleIII
IScientific Services, Rand Water, Vereeniging 1930, South Africa
IIDepartment of Environmental, Water & Earth Sciences, Tshwane University of Technology, Tshwane 0001, South Africa
IIIDepartment of Chemistry, Faculty of Science, Tshwane University of Technology, Tshwane 0001, South Africa
ABSTRACT
Organochlorine pesticides (OCPs) are continually detected in the environment due to their increasing applications in agriculture and industry. The presence of OCPs in the environment is not desirable since they are well known to have negative impact in humans, animals and birds. Thus, there has been a continual demand to monitor the presence of OCPs within the environment. Liquid-liquid extraction (LLE) and Soxhlet extraction (SE) methods (using dichloromethane as the extracting solvent,) were optimised and evaluated for the determination of these compounds in surface water (unfiltered and filtered) and sediment samples. The crude extracts obtained were subjected to column chromatography for clean-up. Thereafter, 1 µℓ of the cleaned extracts were injected into the GC equipped with ECD.
Percentage recoveries obtained for OCPs ranged from 98.90±7.32 (2,4'-DDE) - 124.1±8.23 endosulfan II (ENDO II) % and from 98.99±5.30 (2,4'-DDE) - 121.1±0.38 (4,4'-DDE) % in spiked triply distilled water and sediment samples respectively. The levels of OCPs obtained in unfiltered environmental water samples ranged from 0.631±0.03 (γ-HCH) - 1 540±0.19 ng·mℓ-1 (4,4'-DDT) while levels in filtered water samples ranged from 0.895±0.01 (γ-HCH) - 9 089±0.08 ng·mℓ-1 (HEPTA). Levels of analysed OCPs obtained in sediments ranged from 0.266±0.01 (δ-HCH) - 22 914±2.85 ng·gdw-1 (2,4'-DDE). Analytes adsorbed on the sample bottles used for water samples collection gave levels which ranged from 0.01±0.01 - 1.06±0.02 ng·mℓ-1 for OCPs.
The levels obtained from the catchment were significantly higher than the water criteria values recommended by USEPA and DWAF for the protection of the aquatic environment. Levels obtained were also higher than those of other studies conducted so far in South African aquatic environments. There is, therefore, a definite pollution of the Jukskei River catchment by the OCPs studied.
Keywords: OCPs, surface water, sediments, liquid-liquid extraction, GC-ECD
Introduction
The release of various organic pollutants from different sources such as runoff or effluent discharges into the environment is an issue of great concern in many countries. The sea, rivers, dams or lakes have become the immediate environmental reservoirs for all possible organic pollutants (Chee et al., 1996). These include organochlorine pesticides (OCPs) such as lindane, endosulfan (ENDO), dichlorodiphenyltrichloroethane (DDT) and its degradation products, DDD and DDE (Tomkins et al., 1992). Some OCPs have contributed greatly to the increase in food production and at the same time have improved human and animal health. However, these successes have been marred by the revelation of their side-effects on non-target species (Barlas, 2002).
Some OCPs are highly resistant to degradation by biological, photochemical or chemical means. They are also liable to bioaccumulation and are prone to long range transport (Tanabe et al., 1994). Many of these compounds have already been listed as top-priority pollutants owing to their carcinogenic, hepatoxic and mutagenic effects (USEPA, 1984 and WHO, 2004). These compounds are also typically characterised as having low water solubility and high lipid solubility. They have been associated with significant environmental impact in a wide range of species and at virtually all tropic levels. Many organochlorines have been implicated in a broad range of adverse human health and environmental effects, including impaired reproduction, endocrine disruption and immunosuppression. Exposure to organochlorines has been correlated with population decline in a number of marine mammals (Tanabe et al., 1994).
Due to the toxic effects of organochlorines in aquatic organisms, the use and/or sale of most organochlorine pesticides has been banned or restricted in many developed countries such as United States of America and Sweden since the mid 1970s (Tanabe et al., 1997). Studies conducted on OCPs in aquatic environments in South Africa (Weaver, 1993; Grobler, 1994; Naude et al., 1998; London et al., 2000; Fatoki and Awofolu 2003; Okonkwo et al., 2007), Europe (Blair et al., 1997 and Fernandez-Alba et al., 1998), Asia (Iwata et al., 1994 and Xue et al., 2006) and America (Dorothea and Muir, 1991; Guillette et al., 1998) have shown a widespread occurrence of residues of these pesticides in environmental aquatic systems, despite the fact that they have been banned for decades. In developing countries such as South Africa, DDT is still used officially for malaria vector control in some parts of the country. It is believed that some group of OCPs may still be in use clandestinely under unknown trade names in agriculture due to their low cost and effectiveness for pest control.
Liquid-liquid extraction (LLE) is a common method used for the determination of organic compounds in water. The study by Awofolu and Fatoki (2003) has shown this method to be more reliable than solid phase extraction (SPE) cartridges during sample preparation since the latter method is prone to interferences, especially when gas chromatography-electron capture detector (GC-ECD) is used. SE is also an established technique that has been used for the extraction of organic pollutants such as OCPs from marine sediment and soil samples (Snyder et al., 1992). The use of gas chromatography (GC) with electron capture detector (ECD) for the detection of OCPs is common because of its high resolution and good sensitivity in the nanogram range. However, gas chromatography-mass spectrometry (GC-MS) is also widely employed for the determination of OCPs in complex matrices (Awofolu and Fatoki, 2003).
Studies conducted to date in some South African waters have shown the presence of OCPs. Grobler (1994) investigated the presence of chlorinated hydrocarbon pesticides and PCB residues in water, fish and sediment from Olifants River. PCBs and OCPs investigated were not detected in water and sediments except DDT in fish samples. Naude et al. (1998) studied the comparison of supercritical fluid extraction (SFE) and soxhlet extraction (SE) for the determination of DDT, DDD and DDE in sediment samples from the Pongolo floodplain in KwaZulu-Natal and the Letaba River in Mpumalanga Province. London et al. (2000) investigated the quality status of surface and groundwater in the rural Western Cape for OCPs. Also in the same year, Meintjies et al. (2000) analysed water samples from the Vaal River in the vicinity of Vereeniging and Vanderbijlpark for organochlorine pesticides using SPE and GC-ECD. Awofolu and Fatoki (2003) determined OCPs in water and sediment samples respectively in the Eastern Cape. Okonkwo et al. (2007) as part of the present study investigated the extraction efficiency of activated carbon with respect to the occurence of DDT and its metabolites (DDD and DDE) in the Jukskei River catchment area. However, in most of these studies the possible analyte losses through retention on sample bottles and differences between filtered and unfiltered environmental water samples were not given adequate attention. Smith et al. (2001) reported that filtered water samples tend to show evidence of lower levels compared to unfiltered water samples. It is still impossible to present a complete picture of OCPs distribution in South Africa waters since their levels within bigger catchments such as the Jukskei River catchment has not been adequately reported.
The objectives of this study were to use LLE and SE methods with different solvent combinations and varied GC-ECD conditions for the determination of 13 OCPs in water (filtered and unfiltered) and sediment samples. In addition, analyte losses through analyte retention on sample bottles and seasonal variation at different sampling sites were studied.
Experimental
Apparatus and reagents
Thoroughly washed glassware was soaked overnight in dilute HNO3 solution and rinsed three times with distilled water and then with pure acetone. Sample bottles (2.5 ℓ Winchester bottles) were used to collect water samples and wide-mouth 500 mℓ brown glass Winchester sampling bottles for the collection of sediment samples. All reagents were of analytical and GC grade (Merck, South Africa). Anhydrous sodium sulphate, 99.5% pure was deactivated by drying in the muffle furnace at 400ºC for 3 h before use. All solvents were subjected to distillation three times before use and were in a range of 99.0 to 99.5% pure. OCP standards were obtained from Supelco (Supelco, Belle-fonte, PA, USA). Silica gel, Kieselgel Merck Typ 77754, 70 to 230 mesh 100 µm was purchased from Sigma-Aldrich, South Africa. All the gases used were 99.9% pure obtained from Afrox, South Africa. Analytical grade sulphuric acid was purchased from Merck.
Preparation of stock standard solutions
1000 mg·ℓ-1 of each OCP standard was prepared with hexane in a 5 mℓ volumetric flask. Lower working concentrations of OCP standards were prepared from the stock solution. Thereafter, 1.0 µℓ of each was injected into the GC-ECD until the instrument could not show any peaks. Ten injections of the last detected concentration were made and the injection error calculated. Internal standard method of analysis was chosen because it is more accurate and reliable due to the adjusting and correcting mechanisms it performs from unavoidable errors that are likely to emanate from measurement of syringe volumes of the standards and processed samples.
Determination of instrument detection limits (IDLs) and retention times (RT)
The instrument detection limits (IDL) is the lowest detectable amount of each analyte that the instrument can detect and record. The IDL was computed using the method described by Miller and Miller (1998).

where:
Yb = blank value
Sb = standard error of the regression line
The noise and thresholds were set during column background run so as to eliminate noise spikes from being registered as peaks. Each standard was injected into the GC to determine its retention time.
Determination of response factors (Rf)
Response factor (Rf) is a ratio of signal-to-sample size used to characterise a detector. It can also be explained as the measure of the sensitivity and responsiveness of the analytes relative to the instrument. Rf of the OCP standards relative to the internal standard (IS), pentachloronitrobenzene (PCNB) were carried out by injecting the mixture of OCPs within the concentration range 2 to 10 µg· ℓ-1. Ten replicate injections were made. The Rf was calculated from Eq.(2):
Silica gel column chromatography (clean-up)
The chromatographic column (20 cm x 8 mm I.D.) was packed with 5.0 g of activated silica gel, which was made into slurry with 1.5% (v/m) petroleum ether and then stirred well before use. About 1 mℓ of anhydrous sodium sulphate was placed at the top of the column to absorb any water in the sample or the solvent. The column was pre-eluted with 15 mℓ of petroleum ether and before exposure to sodium sulphate. The reduced 5 mℓ extract from extraction processes was placed in the column and allowed to sink below the sodium sulphate layer. OCPs extracts were eluted with 2 x 10 mℓ portions of the extracting solvents. The eluant was collected, bubbled with nitrogen gas to dryness and reconstituted with 2 mℓ of extracting solvent. Then 1.0 µℓ was injected into the GC.
Sampling protocol
Description of the study area
The study area for this research work was the Jukskei River catchment area, which is in Gauteng and Northwest Provinces of South Africa. The Jukskei River catchment was chosen for this study because it receives effluent from industries and runoff in vast amounts from illegal, unmanaged waste dumps and agricultural practices (DWAF, 2003). The Jukskei River passes through the northern part of the densely populated and industrialised Witwatersrand complex before flowing into the Crocodile River, as shown in Fig. 1. The Crocodile River drains into the Hartbeespoort Dam, which is used for recreational purposes and as a source of raw water for Magalies Water Board. The Jukskei River catchment is largely urbanised and industrialised (DWAF, 2003).
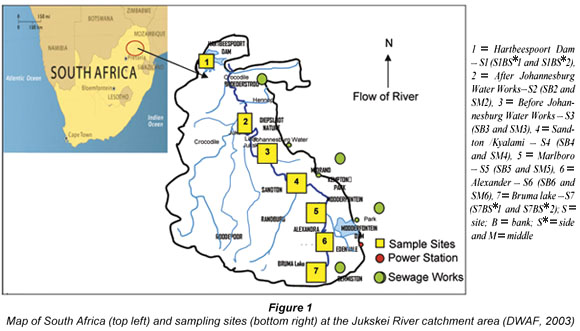
Sampling sites
Water and sediment samples were collected from sampling points during 2005 summer and winter seasons. Sampling points were chosen randomly from most accessible sites in the designated area of study. Six water samples were collected from each site (three from the banks and three from the middle except samples S1 and S7 which were taken from the opposite side of the banks). The 6 water samples from each point were collected to make composite samples. Sampling sites which were selected from downstream to upstream for possible sources of pollution are as shown in Fig. 1.
Water sampling
All water samples were collected in triplicate in 2.5 ℓ pre-cleaned Winchester glass bottles from identified 7 sampling points within the Jukskei River catchment area. Prior to use, the bottles were first rinsed with the water samples and then immersed to about 5 cm below the surface. 5 mℓ of concentrated sulphuric acid was added to the water samples for preservation and tightly sealed. Samples were then transported in a cooler box with ice to the laboratory where they were stored in a cold room at 4°C until they were analysed.
Sediment sampling
Sediment samples were collected from about 0 to 5 cm below the surface from the same locations as water samples using a stainless grab. These samples were placed into pre-cleaned wide-mouth 500 mℓ glass bottles and closed immediately after sampling. The samples were kept cool during transportation in a cooler box to the laboratory. At the laboratory they were kept frozen at -18°C prior to extraction and analysis.
Extraction of environmental water and sediment samples
Several extraction methods have been employed in determining OCPs in water samples. These methods include solid phase extraction (SPE), liquid-liquid extraction (LLE) (Moeder et al., 2000), on-line solid phase extraction (OLSPME) (Brossa et al., 2003) and solid-phase micro-extraction (SPME). SPE is routinely used in many different areas of analytical chemistry. It is used in the analysis of both polar and non-polar analytes where the matrix and the analyte of interest are usually dissolved in a liquid. It is applied to pesticide analysis in water samples since it is an easy and fast process (Hatrík and Tekel, 1996). The growth of SPE has largely been at the expense of LLE where the perceived advantages of SPE over LLE are that it consumes fewer organic solvents and that a wider range of extraction mechanisms can be utilised (Olsen, 1998). However, the study by Tan (1992) and, Awofolu and Fatoki (2003) showed that the SPE method is not as reliable as the LLE method. The use of commercial SPE cartridges or disks during sample preparation has also shown to give interferences, especially when GC-ECD is used for analysis. In a study, extraneous peaks which appeared in the gas chromatograms were attributed to phthalate esters contained in the housing materials of the cartridges used (Awofolu and Fatoki, 2003). In the case of SPME, the coated fibres employed can become unstable in complex matrices such as plasma or urine (Eisert and Levsen, 1996). Analyte recovery with SPME is between 0.5 to 10% and therefore sensitivity is low. Supercritical fluid extraction (SFE), microwave extraction (ME) and Soxhlet extraction (SE) are used for the extraction of solid samples followed by gas chromatography (GC) or high-performance liquid chromatography (Petrovic et al., 2001). The main disadvantages of ME are the use of a single extraction vessel which needs to cool to room temperature which might take some time before filtration and this can cause re-adsorption issues (Smith, 2001), and it also requires microwave absorbing solvent. SFE is described to provide cleaner extracts, less solvent handling, and equivalent or better recoveries than conventional solvent extraction technique. Supercritical CO2 has been the most commonly used fluid for SFE because of its low critical constants, its low toxicity and cost and its ability to extract quantitatively a wide range of relatively non-polar organics from a variety of matrices (Rochette et al., 1993). The use of SFE techniques for the extraction of OCPs from aquatic systems has been widely reported in the literature (Snyder et al., 1992 and Barnabas et al., 1994). Despite the fact that SFE of OCPs from aqueous samples has shown remarkable advantages over solvent extraction techniques, there are indications that this technique is not completely successful especially for biotic matrices (Awofolu and Fatoki, 2003).
Unfiltered water
100 mℓ of acidified unfiltered environmental water samples was measured into a 500 mℓ separating flask and extracted with 3 x 15 mℓ of dichloromethane (DCM) for OCP analysis. The extract was taken through the silica gel column clean-up. The eluates were concentrated to about 5 mℓ before GC analysis.
Filtered water
100 mℓ of acidified filtered water samples from sites S1, S4 and S7 were subjected to the method used by Koh et al. (2002) and separated into particulate matter and then dissolved fraction by using pre-combusted GF/F (0.7 µm nominal) glass-fibre filters (Whatman, Maidstone, England) under vacuum and were extracted with DCM. The extraction procedure was carried out as described earlier.
Extraction test for adsorbed analytes from sampling bottle
Sample bottles used for collecting water samples from sites S1, S4 and S7 were rinsed with 3 x 10 mℓ of extraction solvent. The extracts were taken through the same procedure as described above before GC analysis.
Sediment samples
Sediment samples were thawed and air-dried in a dark cupboard for 3 to 4 d. These samples were ground and homogenised using a clean mortar and pestle and then sieved before subjected to further treatment. 10 g of air-dried, sieved and pre-extracted sediment samples were weighed into a pre-extracted Whatman extraction thimble in a Soxhlet extraction apparatus using dichloromethane as the extracting solvent. The reduced 5 mℓ extract was carried through the chromatographic clean-up process as described above before GC analysis.
Quality assurance
The spiking method with 4 mℓ of (2 to 10 mg·ℓ-1) of OCP standard mixture and homogenised certified reference material (CRM) as described by Ariese (2001) were used in the quality assurance process for the validation of the analytical methods. Several quality assurance measures were also routinely used in this study and included running blanks with each sample set and analysing samples as triplicates. Gas chromatographic conditions were monitored daily by checking the range of response factors of the calibration standards and the recoveries of a test standard that was included in each run.
Gas chromatography analysis
1 µℓ each of processed sample was injected into the GC (split mode – 1 min) for analyses. The injector and detector temperatures were maintained at 260°C and 300°C respectively. The oven temperature was initially maintained at 100°C, and then programmed to increase at 20°C/min to 150°C and ramped to 280°C at 10°C/min. Helium was chosen and used as a carrier gas due to the fact that it exhibits a flat Van Dempter profile. The make-up gas (nitrogen) was maintained at 28 mℓ·min-1 whilst carrier gas was kept at the flow rate of 3 mℓ·min-1.
Statistical analysis
All statistical analyses were carried out using the Statistical Package for Social Scientists (SPSS) Software (Version 11.0). One-Way ANOVA and Pearson's Correlation Index were used to test for significant differences (95% confidence) and the relationship between the results of water and sediments; summer and winter and among the lower (S1BS1, S1BS2, S2B and S2M), middle (S3B, S3M, S4B, S4M, S5B and S5M) and upper (S6B, S6M, S7BS1 and S7BS2) streams to identify possible sources of pollution with respect to OCPs studied.
Results and discussions
The gas chromatogram of OCPs standard mixture is shown in Fig. 2. Thirteen OCPs were identified and these are fairly well resolved. Unidentified peaks can be linked to the 4,4'-DDT technical grade standard used which is known to contain series of contaminants.
In the case of the isomers of HCH (α-,γ- and δ), α–HCH eluted first leading other isomers as tabulated in Table 1. The RT ranged from 6.12±0.05 (α-HCH, 290.83 g·mol-1) to 14.2±0.23 min (4,4'-DDT, 354.59 g·mol-1). RT reported in the literature for 4,4'-DDT are 52.42 and 19.91 min (Brossa et al., 2002; Fatoki and Awofolu, 2003). Analysis time of 21.50 min was also reported for this compound (Awofolu and Fatoki, 2003). Rf range of 0.34±0.05 and 5.59±0.95 was obtained for ENDO II and γ-HCH, respectively. In this case, as in the case of RT, it was also noted that Rf followed no pattern in respect to physicochemical properties of OCPs. However, γ-HCH produced Rf greater than 1.0.
Instrument detection limits (IDLs)
The IDLs of OCPs are presented in Table 2. The IDL values were calculated from linear regression equation of the calibration curve of the OCPs standards as generated by the Star Chromatograph Work Station Version 6 coupled to the gas chromatography and as described by (Miller and Miller, 1998). IDLs of the analysed OCPs ranged from 6.00 (2,4'-DDD) to 17.2 ng·ℓ-1 (ENDO I). Results obtained in the present study are lower than those reported for the same compounds are (Fatoki and Awofolu, 2003; Awofolu and Fatoki, 2003; Basheer et al., 2005).
Quality assurance
Mean percentage recoveries of OCPs in water and sediment samples
The mean percent recoveries for triplicate analyses of OCPs from spiked doubly distilled water and sediment samples are presented in Table 3. Results from spiked water samples using hexane gave percentage recoveries of 14.50%±0.81 (γ-HCH), 69.05%±3.33 (2,4'-DDE), 45.92%±7.49 (ENDO I), 28.75%±3.28 (endrin) and NR (ENDO I and 2,4'-DDT) all below the acceptable recovery value of 70%. For solvent 1:1 dichloromethane and methanol (DCM/MET) recovery, the values below 70% were 9.950%±0.52 (α-HCH), 12.73%±0.93 (γ-HCH), 67.10%±5.38 (2,4'-DDD) and 69.01%±6.93 (4,4'-DDD). From the results, solvent combination of 1:1 DCM/HEX and DCM gave better recoveries above 70% in all the compounds of interest. Xue et al. (2006) using SPE reported recoveries ranging from 72% (endosulfan sulphate) to 103% (ENDO II). Fatoki and Awofolu (2003) and Awofolu and Fatoki (2003) using LLE also reported recoveries from 71.03%±8.15 (dieldrin (C12H8Cl6O)) to 101.25%±2.17 (α-BCH).
Table 3 (next page) also shows mean percentage recoveries of OCPs from spiked sediment samples. Although three other evaluated solvents gave good results in most compounds of interest in sediment samples, solvents, hexane, 1:1 DCM/HEX and 1:1 DCM/MET did not recover (2,4'-DDT and 4,4'-DDT) and (2,4'-DDT). The best recoveries were obtained with DCM where all analytes were detected. Two analytes (2,4'-DDT and 4,4'-DDT) were not detected with hexane and 1:1 DCM/HEX. Xue et al. (2006) reported recoveries ranging from 71% (p,p'-DDT) to 103% (endrin (C12H8OCl6)). Fatoki and Awofolu (2003) and Awofolu and Fatoki (2003) using SE also reported recoveries ranging from 88.22%±7.85 (endrin) to 109.63%±5.10 (β-BCH). The high percentage recoveries obtained in all the compounds validated the extraction methods used in the present study.
Background analysis
Blank samples analysed were found to contain no target analytes. Both water and sediment samples did not show any peak that might have had any influence on the results.
Methods validation
The results obtained for the analysis of certified reference materials (CRMs) for OCPs are shown in Table 4. A reference wastewater (NIST QCM–200, North Kingstown, USA) for OCPs was analysed to test the accuracy of proposed methods. As can be seen in Table 4, the results were generally in good agreement with NIST certified values, indicating validity of methods used in this study for analysis of water and sediment samples.
Analysis of environmental water and sediment samples
Identification of the OCPs in water and sediment sample extracts were confirmed by comparing their RT (time taken for each compound to elute in a chromatogram) with those of their standards. Concentrations were calculated using the following equation: (USEPA, Method 515.3)

where:
Ca = concentration of the analyte (ng·mℓ-1 and ng·gdw-1 for water and sediments respectively)
Cis = concentration of the internal standard
Aa = peak area of the analyte
Ais = peak area of the internal standard
RRF = relative response factor
Analysis of OCPs during summer and winter season
A typical gas chromatogram obtained from OCP analysis of environmental samples is presented in Fig. 3. From the gas chromatogram obtained, a fair number of peaks were clearly resolved and the compounds studied could be identified. Un-identified peaks were also shown from the gas chromatograms and these may be attributed to noise levels during analysis. The results (mean levels) obtained from analysed OCP summer water and sediment samples from the same sites are presented in Tables 5 and 6; and the levels of OCPs detected in water varied from 0.981±0.16 (γ-HCH) to 3 068±0.56 (2,4'-DDE) ng·mℓ-1. The levels of OCPs studied in sediments ranged from 0.226±0.01 ng·gdw-1 (δ-HCH) to 5963±18.6 ng·gdw-1 (ENDO II).
High levels were found at different points without any particular pattern. Site S1BS1 from Hartbeespoort Dam showed high levels of α-HCH, heptachlor, 2,4'-DDD and 4,4'-DDT at 195.6±1.10 ng mℓ-1, 1 067±9.01 ng·mℓ-1, 117.8±3.02 ng·mℓ-1 and 1 554±0.38 ng·mℓ-1 respectively. Other high levels of 4,4'-DDE, endrin and ENDO II were recorded from Site S3B at 96.01±4.01 ng·mℓ-1, 65.87±4.01 ng·mℓ-1 and 629.3±14.1 ng·mℓ-1. Site S6M also showed high levels at 182.0±4.06 ng·mℓ-1 (δ-HCH), 3 086±0.56 ng·mℓ-1 and 76.00±6.02 ng·mℓ-1 (4,4'-DDD). γ-HCH showed low levels in most sites at 3.759±0.20 ng·mℓ-1 (S1BS1), 3.593±0.40 ng·mℓ-1 (S1BS2), 10.29±1.08 ng·mℓ-1 (S2B), 2.395±0.34 ng·mℓ-1 (S2M), 4.577±0.30 ng·mℓ-1 (S3B), 1.733±0.04 ng·mℓ-1 (S3M), 1.286±0.06 ng·mℓ-1 (S4B), 0.981±0.16 ng·mℓ-1 (S4M), 1.316±0.06 ng·mℓ-1 (S5B), 4.638±0.40 ng·mℓ-1 (S5M), 13.94±2.18 ng·mℓ-1 (S6B), 2.754±0.11 ng·mℓ-1 (S6M), 2.369±0.05 ng·mℓ-1 (S7BS1) and 9.900±1.80 ng·mℓ-1 (S7BS2).
The results of analysed OCPs in water and sediment collected during the winter period are tabulated in Tables 7 and 8. The levels of water varied between 0.631±0.01 to 1540.2±0.19 ng·mℓ-1 (4,4'-DDT) and those of sediments ranged from 4.261±0.11 to (γ-HCH) to 22 914±4.85 ng·gdw-1 (2,4'-DDE).
Some of the reported levels of OCPs in similar studies were lower than those obtained in this study. Xue et al. (2006) studied 21 OCPs in surface water and sediments from Beijing Gaunting reservoir. Total levels of OCPs studied were reported and ranged from 16.7 to 791 ng·ℓ-1, 275 to 1 600 ng·ℓ-1 and 5 250 to 33 400 ng·kg-1 in surface water, pore water and sediment (dry weight), respectively. Kishimba et al. (2004) carried out a study to assess the levels of OCPs in water, sediment, soil and some biota collected from different parts of Tanzania. Generally, low levels of residues were found in areas associated with agricultural pesticide use but the levels in the former storage areas were substantially high. DDT and HCH were dominant in all the studied areas. In the former areas, levels of ΣDDT in water, sediments and soil were up to 2 µg·ℓ-1, 700 µg·kg–1 and 500 µg·kg-1, respectively, while those of ΣHCH were up to 0.2 µg·ℓ–1, 132 µg·kg–1 and 60 µg·kg–1, respectively. Fatoki and Awofolu (2003) and Awofolu and Fatoki (2003) studied water and sediment samples from marine and freshwater sources in the Eastern Cape Province of South Africa that receive runoff from agricultural lands and effluents from industries. The levels of OCPs reported ranged from 5.5 (2,4-DDD) to 450±0.10 ng·ℓ-1 (β-BHC) in water samples and from 0.6 (aldrin and 2,4-DDD) to 184±0.12 ng·g-1 (β-BHC) in sediments for triplicate analyses. Some endocrine disrupting OCPs such as DDT, DDE, heptachlor, ENDO and chlordanes were also detected. Osuna-Flores and Riva (2002) investigated surface water and sediments from the Bay of Ohuira, Mexico. The highest levels were observed for ENDO I (0.0472 to 2.005 µg·g-1) and the lowest range of levels were for DDE with 0.019 to 0.021 µg·g-1 and were lower than those obtained in this study from environmental water and sediment samples.
Analysis of results of water and sediment samples in this study showed that levels of most OCPs detected were above the maximum acceptable levels for water, e.g. heptachlor (USEPA, 1984). These high levels give cause for concern because this could expose some of the primary users of water to these pollutants with potential health effects. Thus the community and the environment in the catchment area could be at risk if the trend is not monitored. USEPA water quality guidelines to protect the aquatic ecosystems are 0.00083 ng·mℓ-1 (4,4'DDD), 0.00059 ng·mℓ-1 (4,4'DDE), (4,4'DDT), 0.00021 ng·mℓ-1 (heptachlor), 0.0092 ng·mℓ-1 (α-HCH), 0.0186 ng·mℓ-1 (γ-HCH), and chronic values are 0.056 ng·mℓ-1 (ENDO I and II) and 0.0023 ng·mℓ-1 (endrin) (USEPA, 1995). High levels of OCPs obtained in this study could be because of the runoff from agricultural activities around the catchment, e.g. farms and domestic gardens.
Similarly, the average OCP levels observed in the sediment samples (1 176.12 ng·gdw-1) was significantly higher than that observed for water samples (142.310 ng·mℓ-1) at p < 0.05. This is not surprising since sediments are known to act as sinks for pollutants in the aquatic environment (Chee et al., 1996). The average levels were observed to be higher in winter (1 032.37) than in summer (286.06) and this could be attributed to the impact of precipitation. This difference was observed to be significant (p < 0.05). No significant correlation was, however, observed between compounds during the two seasons.
Comparing the levels of OCPs in the downstream, midstream and upper-stream river, the average levels in the downstream (731.210 ng·mℓ-1) and midstream (721.923 ng·mℓ-1) gave significantly higher values than the upper-stream (237.672 ng·mℓ-1) at p < 0.05. Higher levels obtained in the downstream and midstream river might be due to runoff from golf courses and surrounding agricultural fields. Xue et al. (2006) reported that the observed variation in OCP levels in the reservoir (both in water and the sediments) can be expected to be caused by several reasons such as high rates of influx of contaminants into the reservoir through tributary rivers and drainage of contaminated water from the surrounding agricultural fields. The accumulation and the inflow from the Crocodile River which joins the catchment downstream might have also contributed to high levels. Lower levels in the upper stream compared to other streams are attributed to the absence of agricultural fields in the area.
Analysis of filtered water samples
The results of filtered water samples for OCP analyses are represented in Table 9. As can be seen from Table 9, the results obtained did not show any appreciable differences compared to the results obtained from unfiltered water samples, although filtered water samples have been reported to have slightly lower levels (Smith et al., 2001). The higher levels reported for unfiltered water samples were attributed to the high adsorption affinity of OCPs for particulate material in the water samples.
Analysis of OCPs adsorbed on sampling bottle
Table 10 shows the results obtained from the rinsed sampling bottles to recover possible analyte losses through analyte retention on sample bottles. From Table 10, all compounds studied were detected from the samples. 4,4'-DDT (1.06±0.02 mg·mℓ-1) from Site S1BS1 recorded the highest value and ENDOI (0.01±0.01 mg·mℓ-1) the lowest detected compound from S4M. The percentage levels of OCPs in environmental water samples (98.90 to 121.10%) were much higher than those recovered on the sampling bottles (0.02 to 5.18%). Therefore, the results show that analytes studied were capable of adsorbing on the sampling bottle.
Conclusions
The conditions of GC-ECD were successfully optimised and the method developed was applied in the determination of OCPs studied. The analysis times were shortened and peak resolution was good in most cases.
From the results of the quality assurance/control carried out for the analysis of OCPs in this study, it was revealed that LLE with DCM as a solvent system was the best for the determination of OCPs in environmental water samples. Using the Soxhlet extraction method the same solvent system gave good results for OCPs in sediment samples. Good results were achieved and the method used in this study was validated with certified reference materials of OCPs in wastewater.
Water samples (filtered and unfiltered) from the catchment show no appreciable difference from the results, although levels of filtered water samples were slightly lower than unfiltered water samples.
The analyte loss through analyte retention on sample bottle proved that OCPs of interest were recovered from the sampling bottles. Therefore, it was confirmed that these compounds are adsorbed on sampling bottles or glass.
The levels obtained from the catchment were higher than the water criteria values recommended by USEPA and DWAF for the protection of the aquatic environment. Levels obtained were also higher than those of other studies conducted in South African aquatic environments. During this study the occurrence of OCPs also showed some seasonal variations. This would indicate that there is a definite pollution of the OCPs studied in the Jukskei River catchment. OCPs studied have serious health implications on man and biota. Continual and regular monitoring of the OCPs is highly desirable and recommended. This monitoring also becomes very important considering the runoff from agricultural activities (e.g. farms) and recreational grounds (e.g. golf courses and parks) around the catchment.
Acknowledgement
The authors would like to thank Tshwane University of Technology and National Research Foundation (Scarce Skills Scholarship), South Africa, for financial assistance during this study.
References
ARIESE F (2001) New sediment reference material for the quality control of butyltin and phenyltin analysis. TrAC 20 207-218. [ Links ]
AWOFOLU RO and FATOKI OS (2003) Persistent organochlorines pesticides residues in freshwater systems and sediments from the Eastern Cape, South Africa. Water SA 29 (3) 323-330. http://www.wrc.org.za/archives/watersa%20archive/2003/july/12.pdf [ Links ]
BARLAS NE (2002) Determination of organochlorine pesticides residues in water and sediment samples in Inner Anatolia in Turkey. Bull. Environ. Contam. Toxicol. 69 236-242. [ Links ]
BARNANAS IJ, DEAN JR, HITCHEN SM and OWEN SP (1994) Supercritical fluid extraction of organochlorine pesticides from aqueous matrix. J. Chromatogr. A 665 307-315. [ Links ]
BASHEER C, OBBARD JP and LEE HK (2005) Analysis of persistent organic pollutants in marine sediments using a novel microwave assisted solvent extraction and liquid-phase micro extraction technique. J. Chromatogr. A 1068 221-228. [ Links ]
BELTRAN J, LOPEZ FJ and HERNANDEZ F (2000) Solid-phase micro-extraction in pesticides residues analysis. J. Chromatogr. A 939 13-21. [ Links ]
BLAIR A, COCCO P, CONGIA P, SABA G, FLORE C, ECCA MR and PALMAS C (1997) Proportional mortality of dichlorodiphenyltrichloroethane (DDT) in workers: a preliminary report. Arch. Environ. Health Perspect. 52 299-303. [ Links ]
BROSSA L, MARCE RM, BORRULL F and POCULL E (2003) Determination of endocrine disrupting compounds in water samples by on line solid phase extraction programmed temperature vaporization gas chromatography mass spectrometry. J. Chromatogr. A 998 41-50. [ Links ]
CHEE KK, WONG MK and LEE HK (1996) Microwave assisted elution techniques for the extraction of organic pollutants in water. Anal. Chim. Acta 330 217-227. [ Links ]
DOROTHEA FKR and MUIR GG (1991) Sources of chlorpyrifos and dacthal to small Canadian Prairie watershed. Environ. Sci. Technol. 33 3317-3323. [ Links ]
DWAF (2003) Report on the status of Jukskei River Catchment, Pretoria. Department of Water Affairs and Forestry, Pretoria, South Africa. [ Links ]
FATOKI OS and AWOFOLU RO (2003) Methods for selective determination of persistent organochlorine pesticides residues in water and sediments by capillary gas chromatography and electron capture detector. J. Chromatogr. A 983 225-236. [ Links ]
FERNANDEZ-ALBA AR, AGUERA A, CONTRERAS M, PNUELA G, FERRER I and BARCELO D (1998) Concentrations of various sample handling and analytical procedures for the monitoring of pesticides and metabolites in ground waters. J. Chromatogr. A 823 35-47. [ Links ]
GROBLER DF, KEMPSTER PL and VAN DER MERWE M (1994) A note on PCBs and chlorinated hydrocarbons pesticide residues in water, fish and sediments from Olifants River, Eastern Transvaal, South Africa. Water SA 20 (3) 187-194. http://www.wrc.org.za/downloads/watersa/1994/July/0787.tif [ Links ]
GUILLETTE EA, MEZA MM, AQUILAR AG, SOTO AD and GARCIA IE (1998) An anthropological approach to the evaluation of preschool children exposed to pesticides in Mexico. Environ. Health Perspect. 106 347-353. [ Links ]
IWATA H, TANABE S, SAKAI N and NISHIMURA A (1994) Geographical distribution of persistent organochlorines in air, water and sediments from Asia and Oceania, and their implication for global distribution from lower latitudes. Environ. Pollut. 85 15-33. [ Links ]
KISHIMBA MA, HENRY L, MWEVURA H, MMOCHI AJ, MIHALE M and HELLAR H (2004) The status of pesticides pollution in Tanzania. Talanta 64 48-53. [ Links ]
KOH C-H, KHIM SJ, VILLENEUVE DL, KANNAN K and GEISY JP (2002) Analysis of trace organic contaminants in sediments, pore water, and water samples from Onsan Bay, Korea: Instrumental analysis and in vitro gene expression assay. Environ. Toxicol. Chem. 21 1796-1803. [ Links ]
LONDON L, DALVIE MA, CAIRN-CROSS E and SOLOMON A (2000) The Quality of Surface and Groundwater in the Rural Western Cape with Regard to Pesticides. WRC Report No. 795/1/00. Water Research Commission, Pretoria, South Africa. [ Links ].
MILLER JC and MILLER JN (1998) Statistics for Analytical Chemistry (2nd edn.) Chapter 4. Ellis Horwood, Chichester. 97-100. [ Links ]
MOEDER M, SCHRADER S, WINKLER M and POPP P (2000) Solid-phase micro extraction-gas chromatography-mass spectrometry of biologically active substances in water samples. J. Chromatogr. A 873 95-106. [ Links ]
NANDONG X, ZHANG D and XIAOBAI X (2006) Organochlorine pesticides multiresidues in surface sediments from Beijing Gaunting reservoir. Water Res. 40 183-194. [ Links ]
NAUDE Y, DE BEER WHJ, JOOSTE S, VAN DER MERWE L and VAN RENSBURG SJ (1998) Comparison of supercritical fluid extraction and Soxhlet extraction for the determination of DDT, DDD and DDE in sediment. Water SA 24 (3) 205-214. http://www.wrc.org.za/archives/watersa%20archive/1998/July/jul98_p205.pdf [ Links ]
OKONKWO JO, SIBALI LL, McCRINDLE R and SENWO ZN (2007) An improved method to quantify dichlorodiphenyltrichloroethane (DDT) in surface water using activated carbon. Environ. Chem. Lett. 5 (3) 121 -123. [ Links ]
OSUNA-FLORES I and RIVA MC (2002) Organochlorine pesticides residue concentrations in shrimps, sediments and surface water from Bay of Ohuira, Topolobampo, Sinaloa, Mexico. Bull. Environ. Contam. Toxicol. 68 532-539. [ Links ]
PETROVIC M, DIAZ A, VENTURA F and BARCELO D (2001) Simultaneous determination of halogenated derivatives of alkylphenol ethoxylates and their metabolites in sludges, river sediments, and surface, drinking, and wastewaters by liquid chromatography-mass spectrometry. Anal. Chem. 73 (24) 5886-5895. [ Links ]
ROCHETTE AE, HARSH JB and HILL HH (1993) Supercritical fluid extraction of 2,4-D from soils using derivatization and ionic modifiers. Talanta 40 147-155. [ Links ]
SMITH E, RIDGWAY I and COFFEY M (2001) The determination of alkylphenols in aqueous samples from the Forth Estuary by SPE-HPLC-fluorescence. J. Environ. Mon. 3 616-620. [ Links ]
SNYDER JL, GROB RL, MACNALLY ME and OOSTDYK TS (1992) Comparison of supercritical fluid extraction with classical sonication and Soxhlet extractions for selected pesticides. Anal. Chem. 64 1940-1946. [ Links ]
TANABE S, IWATA H and TATSUKAWA R (1994) Global contamination by persistent organochlorines and their ecotoxicological impact on marine mammals. Sci. Tot. Environ. 154 163-177. [ Links ]
TANABE S, MADHUSREE B, AMAHA AO, TATSUKAWA R, MIYAKAZI N, OZDAMAR E, ARAL O, SAMSUN O and OZTURK (1997) Persistent organochlorine residues in harbour porpoise (Phocoena phocoena) from the Black Sea. Mar. Poll. Bull. 34 (5) 338-347. [ Links ]
TOMKINS BA, MERRIWEATHER R, JENKINS RA and BAYNE CK (1992). J. Assoc. Off. Anal. Chem. Int. 75 1091-1099. [ Links ]
USEPA GOLD BOOK VALUES (1992) cited by Water Quality Based Effluent Limits Procedures Manual 1995. 1-3. [ Links ]
USEPA (1975) DDT: A Review of Scientific and Economic Aspects of the Decision to Ban its Use as a Pesticide. Washington DC. [ Links ]
USEPA (1984) Test Method 608, Organochlorine pesticides and PCBs. Environmental Monitoring System Laboratory, Cincinnati, OH, USA. [ Links ]
USEPA METHOD 515.3 (1996) Determination of chlorinated acids in drinking water by liquid-liquid extraction, derivatisation and gas chromatography with electron capture detection. Rev. 1.0. [ Links ]
USEPA (2000) Endosulfan: Re-Evaluation of Toxicity Endpoint Selection for Dermal and Inhalation Risk Assessment-Report of the Hazard Identification Assessment Review Committee. Memorandum from PAQUETTE NC to De VIO S, Health Effects Division, United States Environmental Protection Agency. HED document number 014024. [ Links ]
WEAVER JMC (1993) A Preliminary Survey of Pesticide levels in Groundwater from a Selected Area of Intensive Agriculture in the Western Cape. WRC Report No. 268/1/93. Water Research Commission, Pretoria, South Africa. [ Links ]
WHO (2004) WHO position on DDT use in disease vector control under the Stockholm Convention on Persistent Organic Pollutants. WHO Regional Office for Americas/Pan American Sanitary Bureau (AMRO/PAHO) 525, 23rd Street, N.W., Washington, DC 20037, USA. [ Links ]
XUE N, ZHANG D and XU X (2006) Organochlorinated pesticides multiresidues in surface sediments from Beijing Gaunting reservoir. Water Res. 40 183-194. [ Links ]
* To whom all correspondence should be addressed.
+2716 430-8419; fax: +2716 455-2055;
e-mail: lsibali@randwater.co.za

