


Serviços Personalizados
Artigo
 Inglês (pdf)
 Artigo em XML
 Referências do artigo
Indicadores

Links relacionados
-
 Citado por Google
 -
 Similares em Google
Compartilhar

 Permalink
Water SA
versão On-line ISSN 1816-7950
versão impressa ISSN 0378-4738
Water SA vol.34 no.5 Pretoria Out. 2008
Assessment of the contribution of groundwater discharges to rivers using monthly flow statistics and flow seasonality
David C Le Maitre*; Christine A Colvin
Natural Resources and Environment CSIR, PO Box 320, Stellenbosch 7599, South Africa
ABSTRACT
Groundwater discharge is believed to dominate dry season flows in perennial river systems and to sustain aquatic biodiversity. River flow statistics, extracted from the SPATSIM modelling system, were used to estimate the contribution of groundwater to river flow regimes. The flow statistics were compared for the principal aquifer types (based on major geological formations) in South Africa. This analysis focused on seasonal variation in flows rather than the annual totals or Baseflow Index. Groundwater discharge is expected to reduce flow variability and sustain flows, making flow concentrations lower than rainfall concentrations. Catchments dominated by carbonates have the greatest proportion of baseflow (37%), followed by basement complex (31%) and extrusive aquifer types (31%). The weak relationships between river flow indexes (particularly the Baseflow Index, Coefficient of Variation and Hydrological Index) and the seasonality or concentration statistics imply that catchment storage characteristics and other non-climatic factors play an important role in flow regulation. The geographic distribution of total flow concentrations differs markedly from rainfall concentrations, further evidence that non-climatic factors are important determinants of flow regimes. Karoo dykes and sills, extrusives and unconsolidated deposits are under-represented and the TMG sub-type, carbonates and basement complex and younger granites are over-represented among catchments with evenly distributed baseflows. The Baseflow Index and groundwater-fed baseflow are ecologically meaningful variables but lack clear thresholds that correspond with ecologically important changes in river flow regimes, for example perennial versus seasonal flow. Flow concentrations and percentage zero flows are useful and potentially ecologically important variables and should be tested as predictors of the aquatic and riparian biodiversity of river systems at a range of scales.
Keywords: river flow statistics, baseflow, flow concentration, principal aquifer types, groundwater discharge
Introduction
Rivers are complex, hierarchical systems with three main interlinked components: the geological and geomorphological component which forms the basic physical template; the climatic and hydrological components which are key abiotic drivers of the system through water flow regimes, water quality and water temperature; and the biological component with a suite of species and communities which have adapted to the conditions created by their interactions with the abiotic components (Poff et al., 1997; Ward, 1998; Ward and Tockner, 2001; Wiens, 2002). Development of a sound understanding of these interactions requires a multi-disciplinary approach involving specialists from earth, hydrological and biological sciences (Lytle and Poff, 2004; Dollar et al., 2006; 2007). An approach to the systematic conservation planning of river systems in South Africa has been developed which integrates insights from these different disciplines (Roux et al., 2002; Nel et al., 2004) and is based on the principles of systematic conservation planning (Margules and Pressey, 2000).
South African river systems have been prioritised for conservation based on their river heterogeneity signatures which are derived, at a coarse national scale, from a combination of the geomorphological province (Partridge, 1997), ecoregion (Kleynhans et al., 2004) and an index of river flow variability, the Hydrological Index (HI, Hughes and Hannart, 2003). This approach was originally applied to the Greater Addo National Park (Roux et al., 2002) and then extended to the national scale (Nel et al., 2004). The HI uses only surface runoff data and does not explicitly include groundwater contributions although groundwater has been recognised as an important contributor to river flows - particularly baseflows and dry season flows (Vegter, 1995; 2000; Hatton and Evans, 1998; Smakhtin, 2001a; Xu et al., 2002; Colvin et al., 2003; 2007). Physical controls on groundwater flow, such as geology, climate and geomorphology are considered, but are not explicitly linked to groundwater contributions.
This paper assesses the effectiveness of river flow statistics in characterising the contribution of groundwater to river flow regimes. It follows the approach outlined above for systematic river conservation planning: defining the nature of the physical template, namely, the broad aquifer type, and assessing the nature of the groundwater contribution to the surface flow regime using flow statistics. A number of previous studies have used the annual baseflow index to assess the relative importance of the groundwater contribution to river flows (see Smakhtin, 2001a; Hughes and Hannart, 2003). This analysis differs in focusing on the seasonal variation rather than the annual values. The relationships between the selected flow statistics and the dominant aquifer type within each quaternary catchment are examined. Ideally, an analysis of this type should use actual flow records but these are only available for a limited set of catchments. The best substitute currently available was the WR90 synthesised flow records (Midgley et al., 1994) accessed using the SPATSIM (SPAtial and Time Series Information Modelling) flow modelling system (Hughes and Palmer, 2005). This means that there are interpolations and extrapolation of the data between gauged and un-gauged catchments, but it is unlikely that this will completely mask the broad patterns being investigated in this analysis.
This study used the 'virgin' flow regime data rather than current flow data because the emphasis is on assessing the original state of the rivers as a basis for setting conservation priorities (Nel et al., 2004). Although changes in vegetation cover play a significant role in determining catchment flow regimes (Lacey and Grayson, 1998; Ogunkoya et al., 1984; Calder 1996; Zhang et al. 1999) this would have added an additional level of complexity to this analysis, so it was not included. A major limitation associated with this analysis is the fact that the data are limited to surface flows. There are many situations where water is still present in seasonal, intermittent and ephemeral systems (Uys and O'Keeffe 1997), but occurs below the surface as groundwater in the underlying aquifer systems. Sub-surface groundwater flow and non-flowing perennial pools are ecologically important but the linkages with surface water flow have not been quantified at a scale that is appropriate for this analysis.
Background
Principal aquifer types
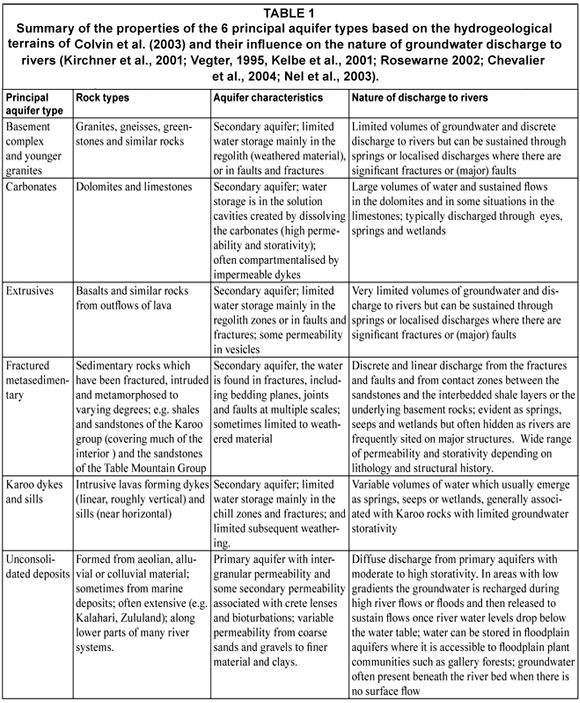
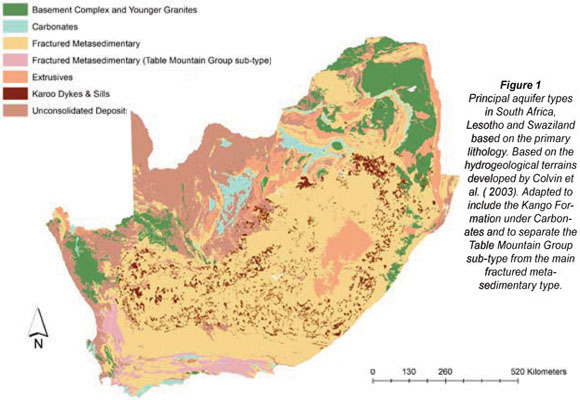
South Africa has an ancient land-surface made up of a range of geological formations which differ in their geological ages, history and lithology (King, 1942; Partridge and Maud, 1987; Partridge, 1997). The primary lithologies – as defined in the 1:1 million geological map and spatial data layer for South Africa (Council for Geosciences, 1997) – were grouped into 6 broad classes or principal aquifer types based on the type of permeability and groundwater flow and discharge regimes (Colvin et al., 2003; Table 1, Fig. 1). The principal aquifer types are analogous to the hydrogeological provinces described by Issar and Passachier (1990). The primary lithology was used because this results in relatively large but reasonably homogeneous spatial units. The original classification by Colvin et al. (2003) has been modified to include the Kango Formation under the carbonate aquifers and to distinguish the Table Mountain Group (TMG) as a sub-type of the fractured metasedimentary aquifers (Fig. 1). The TMG was identified as a sub-type because it generally is believed to hold greater volumes of groundwater than Karoo age fractured metasediments (Rosewarne, 2002).
Climate
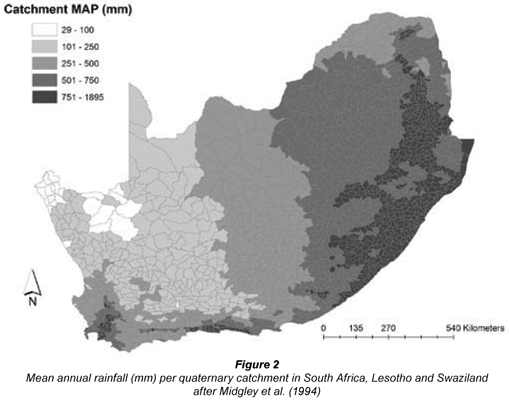
In addition to topographic effects and geological controls such as permeability, climate factors, particularly rainfall, govern recharge and thus groundwater flow regimes. Recharge events become more episodic with increasing aridity, and the seasonality and intensity of individual rainfall events influence recharge events to the aquifers (Sami and Hughes, 1986; Beekman et al., 1996; Vegter and Pitman, 1996, 2003; Kinzelbach et al., 2002; Van Tonder and Bean, 2003). The mean annual rainfall in each catchment varies significantly across the region, being generally highest in the east along the eastern and southern coast (Fig. 2, Midgley et al., 1994). The rainfall seasonality also varies from winter rainfall in the west to summer rainfall in the east. The variability of the rainfall is generally directly related to the mean annual rainfall: the lower the rainfall the greater the degree of variation (Conrad, 1941; Schulze, 1965; Schulze et al., 1997) and this is reflected in the variation in the baseflow (low flow) statistics for rivers across the country (Smakhtin et al., 1995).
River flow statistics, baseflow and groundwater discharge
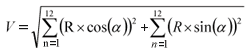
Hydrologists and river ecologists have generated numerous flow statistics and these are used for various purposes. Olden and Poff (2003) reviewed 171 flow statistics for rivers in the continental USA to identify those which best described the flows in the river types defined by Poff (1996 in Olden and Poff, 2003). The most meaningful monthly flow statistics they identified were the mean and coefficients of variation of the mean, high and low flows. The current river conservation classification uses the hydrological index (HI) (Nel et al., 2004) which is a general index of flow variability (Hughes and Hannart, 2003) and is calculated from two standard flow statistics:

where:
CVI = Coefficient of Variation Index
BFI = Baseflow Index
The CVI is mainly influenced by the effects of variability in the rainfall on the flow regime, which is greatest in areas with lower and less reliable rainfall (Hughes and Hannart, 2003), but does not take account of the seasonal distribution of the flows.
The mean annual baseflow is obtained from monthly flow records using statistical flow separation techniques (Smakhtin, 2001b; Hughes, 2001; Hughes and Hannart, 2003). The baseflow as defined here includes both interflow and groundwater discharge (Xu et al., 2002; Hughes, 2001; Parsons, 2004) and the Baseflow Index (BFI) is calculated as a fraction of the mean annual runoff (Hughes and Hannart (2003). The BFI is directly related to the dynamics of the water storage in the catchment, controlled by subsurface storage and transmissivity, which are a function of lithology, weathering and bioturbation. Recharge is related to rainfall (Beekman and Xu, 2003). In low rainfall areas there is insufficient recharge to support sustained groundwater discharges. In areas with high rainfall, shallow soils and impermeable bedrock, there is little storage so that catchments with high rainfall still can have a low BFI. Sustained aquifer discharge to river systems depends on significant aquifer storativity and transmissivity, maintenance of high water tables and a hydraulic gradient towards the discharge point or zone, and hydraulic connectivity with the river.
As described above, the major evidence for a groundwater contribution should be in the form of sustained flows between rainfall events and, at a range of scales, sustained flows through dry seasons and droughts. Therefore, the baseflow or the inter-annual variability of the main dry or low flow months would be more useful than the annual BFI. The occurrence of zero- flow months during the whole flow record or, preferably, during the dry season (Smakhtin and Toulouse, 1998) would also be useful. Seasons or other periods with no flows have significant impacts on aquatic biota (Uys and O'Keeffe, 1997; Lytle and Poff, 2004) so indexes of groundwater contribution should separate these from rivers with continuous or rarely discontinuous flows, although there may still be subsurface continuity and permanent pools in many apparently dry rivers.
Methods
Study areas
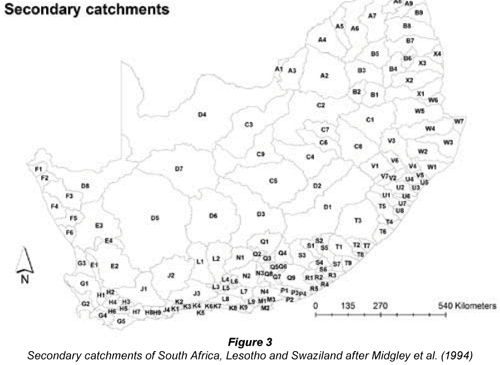
Two study areas were selected: the national scale to get an overall view and the Crocodile-Marico Water Management Area (C-M) (Catchments A1-A3, Fig. 3), which includes three of the secondary catchments of the Limpopo River system, to examine an area in greater detail. Catchment D41A in the C-M was excluded because it forms part of the Orange River system. The C-M was chosen because it has a variety of principal aquifer types in a relatively small area and includes many of the high-yielding dolomitic aquifers and several rivers which arise directly from ecologically important springs (Nel et al., 2004; RHP, 2005).
Rainfall and flow statistics
The quaternary catchment data were obtained from the WR90 study (Midgley et al., 1994). The mean monthly rainfall and flow statistics, Hydrological Index (HI), Coefficient of Variation Index (CVI) and Baseflow Index (BFI) for each quaternary catchment were generated by a customised version of the SPATSIM flow modelling system (Version 2.0.0.8, Hughes and Palmer, 2005). More information on the catchment-scale flow modelling approach used in SPATSIM is given in Hughes and Münster (2000) and Hughes and Hannart (2003). The annual groundwater–fed baseflow estimates calculated by Sami (in DWAF, 2005) were used in this analysis because SPATSIM-derived estimates of groundwater discharge were not available yet (Hughes, 2006).
After some preliminary analyses, three flow indexes were chosen:
-
Month-to-month variability in total and base flows across the year
-
The percentage of the annual base flow which is estimated to be groundwater
-
The proportion of the available monthly flow record (70 years) with zero-flow months.
There are two candidates for the first index:
The Coefficient of Variation (CV) of the 12 mean monthly values; the smaller the CV the more constant the flow; the CV does not measure whether there is or is not any systematic pattern in that variation (e.g. seasonality of flow), the months could be in any sequence.
The flow concentration (in per cent) calculated using the approach developed by Markham (1970) which measures how evenly the flow is distributed across the 12 months. Low values indicate an even distribution and high values concentration in a few months. Markham's approach has been used to derive rainfall concentrations and seasonality for South Africa, Lesotho and Swaziland (McGee, 1977; Schulze et al., 1997).
The flow concentration was chosen because it quantifies the seasonal distribution. The flow concentration is expressed as the vector sum of the monthly flows (Markham, 1970). This is calculated by assigning each month a radial direction in degrees from 0 to 360º. Strictly, the angle (α) should be calculated for the midpoint of each month in Julian days but simplifying this to 15º per month does not significantly change the results (McGee, 1977). The magnitude of the vector is the monthly value. The magnitude of the vector sum (V) is calculated from the monthly data as follows:
where:
n = the number of the month
R = the magnitude of the monthly flow as a volume or depth
α = the angle in degrees
The vector sum is expressed as a fraction or percentage of the annual sum, which removes the effect of differences in the magnitude of flows between different catchments, making them more directly comparable. The month of the maximum rainfall, total or baseflow was determined using the three-month smoothing method described by Schulze et al. (1997).
Estimates of the groundwater contribution
This study used estimates of the volumes of baseflow and groundwater discharge under virgin conditions prepared for the national Groundwater Resource Assessment (GRA2) project (Sami, in DWAF, 2005). Groundwater volumes were estimated from the baseflows which were extracted from the WR90 data sets using a procedure similar to that used by Hughes (2001) but only for catchments with more than a minimum baseflow volume (Sami, in DWAF, 2005).
Data analyses
All the spatial data layers were projected using the Albers projection and overlaid and analysed using ArcInfo® (Desktop) Version 9.0. The spatial quaternary catchment and principal aquifer type data layers were combined by using the Identity function in ArcInfo. The dominant aquifer type for each quaternary catchment was identified and the entire catchment was then assigned to that aquifer type. The flow statistics for each quaternary catchment were analysed by aquifer type to determine whether there were significant differences between them or in the relationships between key variables. All the analyses were done using SAS® (Version 9.1.2, SAS Institute Inc. 2004) and Microsoft® Excel 2003 (Microsoft Office Professional Edition, 2003).
Results
Basic relationships
National
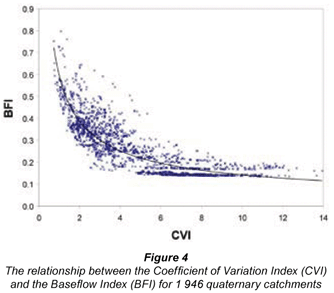
A wide range of variables and ratios of variables were assessed to identify those which would most directly indicate groundwater contribution to rivers. The HI is a commonly used measure of flow variability but the two input variables (CVI and BFI) are correlated: the CVI is high when the BFI is low and vice versa (Fig. 4). The non-linearity of their relationship is important because at low values a small change in the CVI corresponds with a much larger change in BFI. The HI also varies non-linearly with changes in BFI. Both the CVI and the HI have low values where flows are evenly distributed and thus would be relatively insensitive indicators of the role of groundwater in river flow regimes. Both the CVI and HI are positively correlated with the percentage zero flows (r = 0.90 and r = 0.92 respectively) and the BFI negatively (r = -0.68). There are no clear distinctions in any of these indexes between catchments with no zero flows and those with some zero flows although there are thresholds: a CVI > 6.8 and an HI > 6.2 are consistently associated with some zero flows. The BFI relationship with zero flows is more complex. Catchments with a BFI of 0.16 can have from 0 to >90% zero flows. The first example is located in a moderately high rainfall region (A42G-H) and the other in a very arid region of the Richtersveld (D82K-L) where the rainfall is very low (<60 mm) and evenly distributed. Only catchments with a BFI > 0.35 are consistently associated with no zero flows.
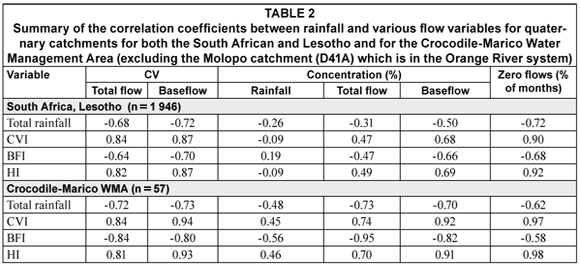
As noted in the introduction, flow concentrations should be strongly influenced by the amount and distribution of the rainfall in the catchment. However, a correlation analysis for the quaternary catchments in South Africa, Lesotho and Swaziland shows that there is only a relatively weak relationship between the amount of rainfall and the evenness of the flow, whether the evenness is measured by the CV or the total or base flow concentration (Table 2). The weak relationships between the different variables or indexes and the concentrations (r < 0.20) imply that catchment storage characteristics are important determinants of flow concentrations. Strong correlations with rainfall are found for the BFI (r = 0.78) and the CVI or HI (r = -0.68) showing that rainfall is positively related to the proportion of the total flow that is baseflow, and that higher rainfall results in a lower flow variability. The high variability in the relationships between flow statistics and the amount of rainfall is partly explained by the range of environments. For example, in the southern part of the country there is a wide range in annual rainfall from the catchments in the Knysna region, which have substantial and evenly distributed flows, to the Little Karoo where there is little or no flow for long periods. In other areas there is almost no rainfall and river flows occur only after exceptional rains (e.g. Richtersveld and north-western interior), resulting in an even distribution of zero monthly flows.
Crocodile-Marico
When the same relationships are examined for the Crocodile-Marico system, some of the confounding factors are removed and the correlations are stronger (Table 2). For example, the correlations between the total rainfall and the flow concentrations have all increased: total flow -0.31 to -0.73 and baseflow -0.50 to -0.70. The correlations between the BFI, CVI and HI and the rainfall concentrations have all increased and changed sign. The only ones that have decreased are those between the percentage zero flows and rainfall or BFI.
Groundwater contribution
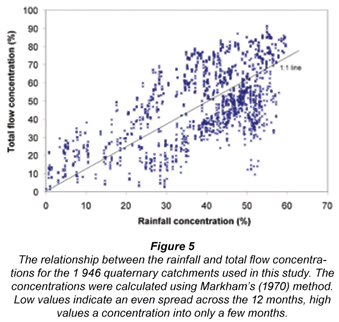
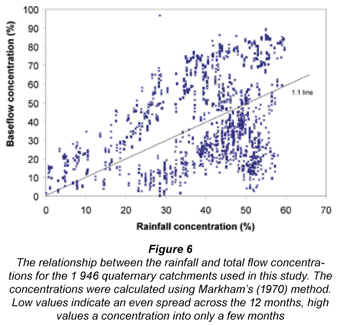
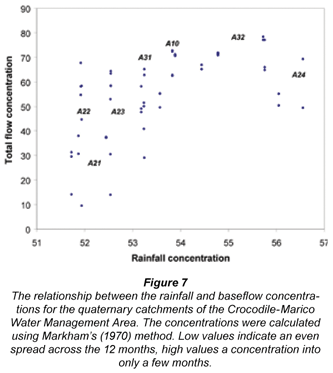
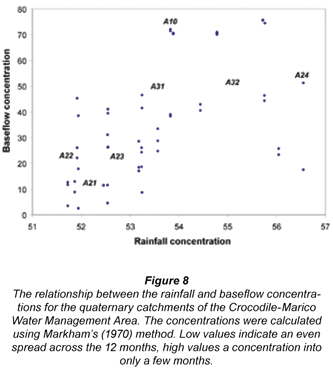
One way to assess the importance of groundwater contribution to streamflow is to analyse the relationship between the rainfall concentration and the respective total and baseflow concentrations. Catchment storage, particularly subsurface storage and discharge, is likely to be playing a role where the flow concentration indexes are lower than the corresponding rainfall concentrations. There is a positive relationship between the rainfall concentration and total flow concentration but there is a considerable scatter (Fig. 5) and the coefficient of determination is weak (r2 = 0.36). The relationship is similar for baseflow (Fig. 6) but the scatter is greater and the coefficient of determination is weaker (r2 = 0.11). Points below the 1:1 line indicate where catchments have less concentrated total flow or baseflow compared with the rainfall, suggesting that discharge from groundwater could be playing a role in extending the period of flows. The greater the distance below the 1:1 line, the greater the 'smoothing' of the flows. For the Crocodile-Marico there is a positive relationship between rainfall concentration and total flow or baseflow concentration and the coefficients of determination (r2 = 0.37 for both) are higher than for the national data set, despite the limited range of rainfall concentrations (Figs. 7 and 8). There does not seem to be a clear pattern in the location of the individual quaternary catchments for total flow concentration (Fig. 7) but there is some clustering for baseflow concentration (Fig. 8). However, when locations of the different tertiary catchments are examined, quaternary catchments within A21 are generally located well below the 1:1 line and correspond with low rainfall and total flow concentrations, whereas those in A24 generally are above the 1:1 line, corresponding with high rainfall and total flow concentrations. Quaternary catchments within A22 and A23 extend across the range of both rainfall and total flow concentrations. The distribution of the catchments is similar for baseflow concentrations but far more quaternary catchments fall below the 1:1 line (Fig. 8) than for total flows, reflecting the generally more even distribution of baseflows.
Principal aquifer types and flow regimes
National
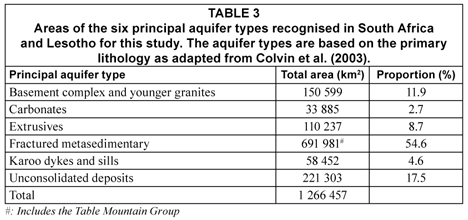
The dominant principal aquifer type over more than half of South Africa, Swaziland and Lesotho is fractured metasediments, dominated by the shales and sandstones of the Karoo Supergroup (Table 3, Fig. 1) with secondary permeability in the water-bearing fault zones. The least extensive aquifer type is the carbonates with well-developed fissure permeability, followed by the Karoo dykes and sills. Carbonate aquifer types form important aquifers in the north-western region of the country (the dolomites), and less well-studied ones on the Agulhas coastal plain and in the Kango Formation of the Little Karoo (limestones). Unconsolidated deposits are found in several regions in the interior where alluvial sediments have accumulated due to the low relief or in extensive basins such as the Kalahari; and in marine and aeolian deposits along the coast, particularly in the south-west and north-east. The basement complex and younger granites contain secondary aquifers in the weathered zone and permeable structures. The extrusives, predominantly basalts, occur patchily across the country and rarely cover large, contiguous areas except in the Maloti-Drakensberg Mountains and along the eastern border from Zululand to the Limpopo.
There are differences in the rainfall and river flow regimes associated with the extent of the aquifer types (Table 4) but these are generally not very marked because of the variety of environments in which the aquifers occur. Most of the aquifer types have similar mean annual rainfall, with unconsolidated deposit aquifer types having the lowest largely because they include large areas of the arid Kalahari sands (Fig. 1).
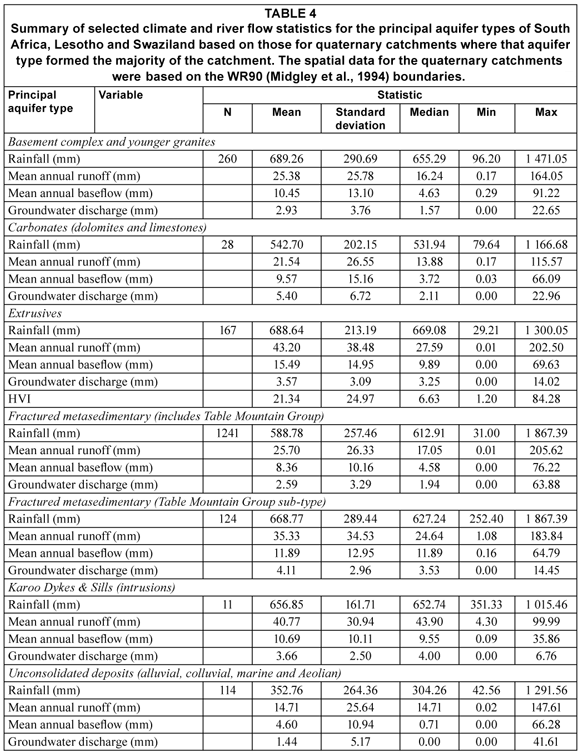
Mean annual runoff is about 6.3% of the rainfall for catchments dominated by extrusives aquifer types followed by those with Karoo dykes and sills and the TMG sub-type with the lowest from carbonates and the basement complex (Table 4). The proportion of baseflow is highest for catchments dominated by extrusives (2.3%) followed by the TMG (1.7%) sub-type and carbonates (1.7%) with the lowest being fractured metasedimentary (1.4%) and Unconsolidated deposit (1.3%) aquifer types. Flow separation techniques indicate, therefore, that catchments with predominantly carbonate aquifer types have the lowest MAR but the highest fraction of groundwater-fed baseflow. Basement complex aquifer types also have low MAR but medium baseflow and groundwater fractions, whilst Karoo dyke and sill aquifer types have relatively high MAR and medium baseflow and groundwater-fed baseflow fractions. Catchments dominated by carbonates have the greatest proportion of baseflow (37%) and groundwater-fed baseflow (25%) in their MAR, followed by basement complex and extrusives aquifer types for baseflow and TMG sub-type and basement complex aquifer types for groundwater-fed baseflow.
Only 11 catchments are dominated by Karoo dykes and sill but they occur in a range of environments from the eastern escarpment to the Great Karoo, and the rainfall varies from 350 mm to 1 000 mm per year. Over this range the rainfall is strongly correlated with the total flow and baseflow (r = 0.80 and 0.89 respectively) but the groundwater flow varies more between catchments (r = 0.54). The weaker correlation for groundwater is due largely to relatively high groundwater contributions, compared with the rainfall, for catchments in the upper Vaal River (C11H, C11J, C12D). The rainfall concentration is only weakly correlated with the total flow concentration (r = 0.52) and the baseflow concentration (r = 0.34). This is largely because the group includes catchments which have similar rainfall concentrations but marked differences in baseflow concentrations.
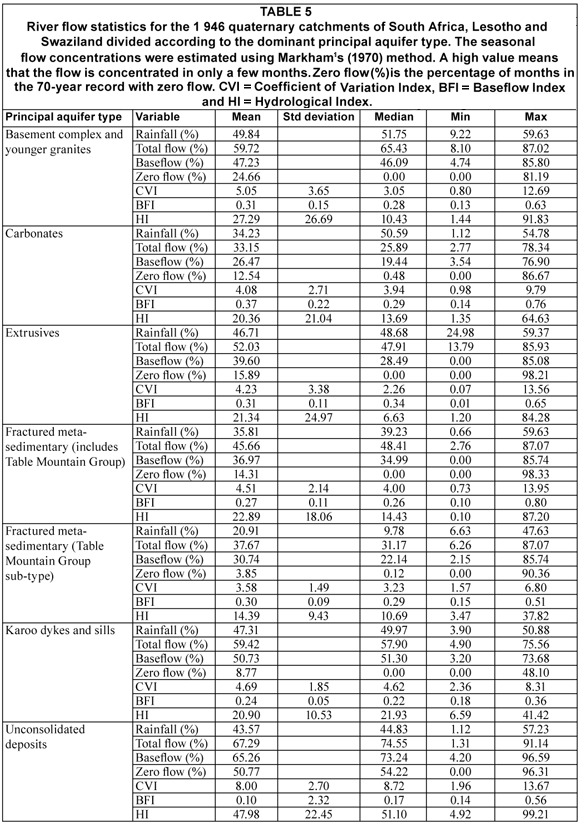
An analysis of the flow indexes indicates that these also vary between aquifer types with most having skewed distributions (mean versus median) and wide ranges (Table 5). Mean rainfall concentrations are highest in the catchments dominated by basement complex aquifer type and lowest for the TMG sub-type, largely because a large proportion of the TMG catchments are located in the all-year rainfall region and the basement complex occurs mainly in the semi-arid summer rainfall region. Total flow concentrations are generally higher than those for rainfall except in catchments dominated by carbonate aquifer types where they are very similar. This is as expected because wet seasons are characterised by moist conditions and rapid quick flow response times. Baseflow concentrations are lower than those of rainfall in some aquifer types (e.g. basement complex) but higher in others (e.g. unconsolidated deposits). The lowest likelihood of zero flows is found in the TMG (3.9%) sub-type and the highest in the unconsolidated deposits (50.8%). The latter also have the highest CVI, lowest BFI and highest HI as expected for catchments characterised by ephemeral river systems.
Crocodile-Marico
Within the Crocodile-Marico WMA there are also differences between the aquifer types (Tables 6 and 7). Rainfall amounts and concentrations vary little between catchments dominated by different aquifer types, but Unconsolidated Deposit catchments have the lowest rainfall and MAR. The MAR is higher in catchments with fractured metasedimentary and basement complex aquifers than those with carbonate aquifers despite similar rainfall, indicating a lower partitioning to groundwater recharge in these less permeable terrains. Quaternary catchments dominated by carbonates (dolomites) have the lowest total and baseflow concentrations and the highest BFI (0.45). Those with fractured metasedimentary aquifers have low baseflow concentrations despite having relatively high total flow concentrations. The greatest range in total flow concentrations is found in catchments within fractured metasedimentary aquifers and the least in those with unconsolidated deposits; the same applies to baseflow concentrations.
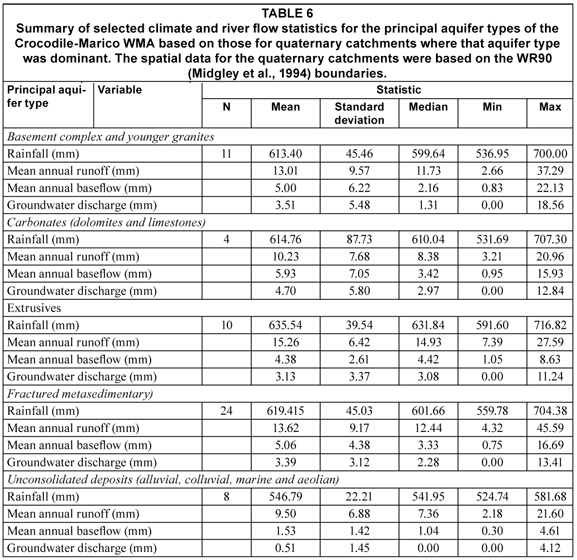
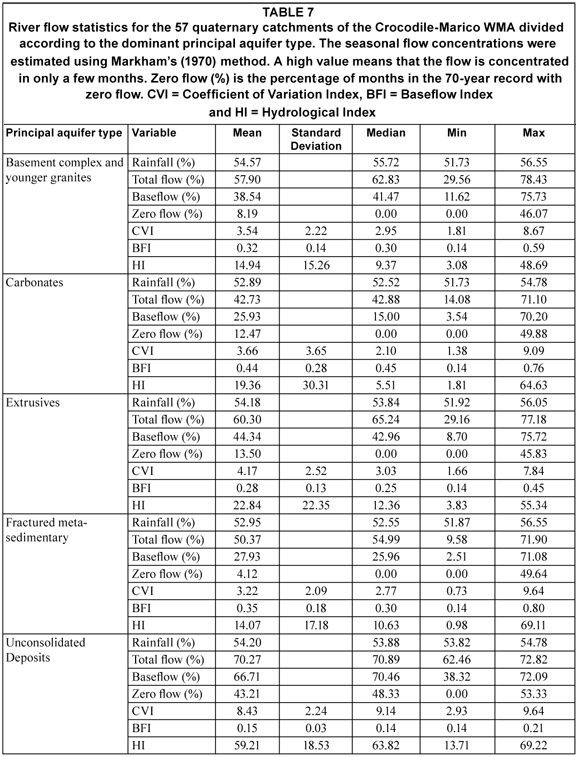
The zero-flow percentages often are highly skewed with at least 50% of the catchments having no zero flows (e.g. basement complex and extrusives). Catchments dominated by fractured metasedimentary aquifer types have very low percentage zero flows, a relatively high BFI and low CVI and HI. Unconsolidated deposits have very high zero-flow percentages, the lowest BFI, and highest CVI and HI.
Spatial patterns
National
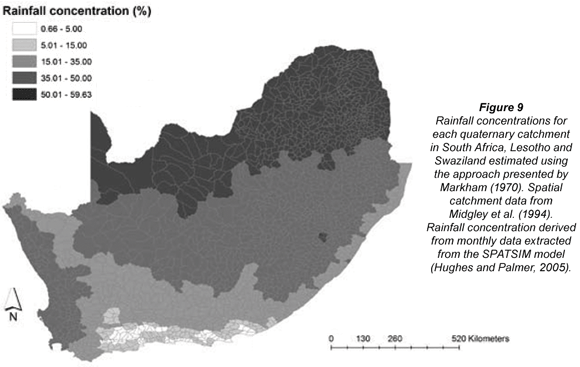
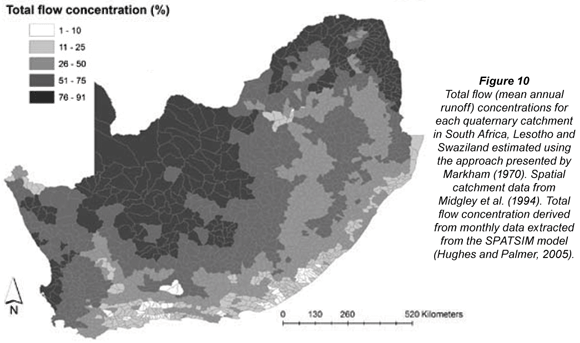
There are clear spatial patterns in rainfall concentrations (Fig. 9). The northern parts of South Africa, Swaziland and Lesotho have rainfall concentrations > 50%. Much of the remainder of the country has concentrations from 35 to 50%, including a broad band of catchments along the west coast. The lowest concentrations are found in a narrow belt along the southern interior, extending inland as far as the Little Karoo and the inland boundary of the Cape mountains. The patterns in the total flow concentrations (Fig. 10) differ markedly from the rainfall concentrations (Fig. 9). The highest total flow concentrations are found in the central regions (Kalahari and Great Karoo) and in a broad belt extending across the country as well as the west coast and adjacent interior (Fig. 10). The lowest total flow concentrations (< 25%) occur in a couple of isolated groups of catchments, most notably C24C-E (Skoonspruit), C23D-H (Mooi River and Wonderfonteinspruit) and A21D and A21G (Skeerpoort and Bloubankspruit) in the Northwest Province. They stand out clearly from the higher concentrations in the surrounding catchments. These catchments all are dominated by, or have large proportions of, carbonate aquifer types.
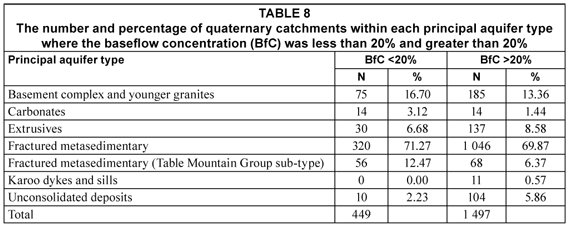
A similar pattern is found in baseflow concentration patterns with more catchments having concentrations <25% (Fig. 11). The spatial distribution of the concentrations corresponds with those for the BFI and CVI (not shown) which is a reflection of the reasonable correlations between them (r = -0.66 and r = 0.68 respectively). There are 449 catchments with baseflow concentrations < 20% which represent a range of aquifer types, mainly fractured metasedimentary (59%), basement complex and TMG sub-type (Table 8). A Chi-square test of the frequencies showed that the proportions of the aquifer types differ significantly (Δ2 = 72, n=6, P<0.05) from those at the national scale. Karoo dykes and sills, extrusives and unconsolidated deposits are under-represented and the TMG sub-type, carbonates and basement complex and younger granites are over-represented. Carbonate aquifers are distinct because 50% have baseflow concentrations of < 20% but only 29% and 43% have such low rainfall and total flow concentrations, respectively. The group comprising the 50% with low baseflow concentrations can be divided into two groups:
-
Those with evenly distributed and relatively low rainfall and low BFI - J25D, J35A, J35D in the Little Karoo, H90E in the Riversdale coastal plain and D82G in the Richtersveld
-
Those with more, and more concentrated, rainfall and a much higher BFI - the dolomitic carbonates of Northwest Province in the Limpopo and Vaal catchments and B60B in the Blyde River catchment.
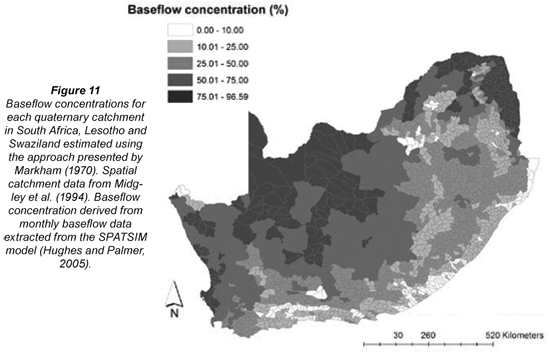
A large proportion of the region, extending from Cape Agulhas northwards into the western Great Karoo and across and into the Highveld and the KwaZulu-Natal interior, has baseflow concentrations < 50% (Fig. 11). The low baseflow concentrations resulting from very low and evenly distributed rainfall are evident in the Richtersveld and in parts of the southern Great Karoo (L12A-D, Sout River) and Eastern Cape coast. The same is true of the higher rainfall area along the Zululand coast, particularly on the coastal plain where the BFI also is high (> 0.50). In the interior, the group of catchments highlighted under total flow above (Skoonspruit and Mooi River) stand out again, together with A42A-C in the upper Mokolo River and the headwaters of the Mokgalakwena (A62), Nyl (A61) and Moretele (Pienaars) River (A23) systems. These rivers all have their sources in the fractured metasedimentary aquifer type of the Waterberg.
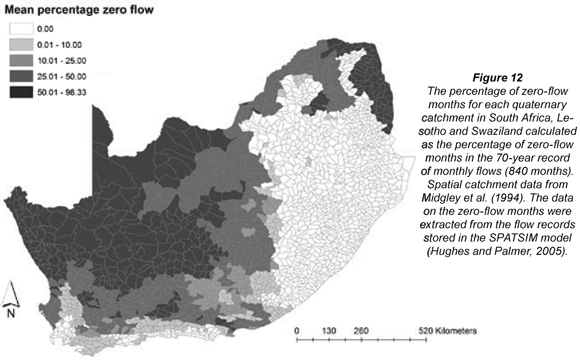
Mapping of the percentage zero flows shows that many of the catchments have no zero flows (Fig. 12). These catchments include a wide range of rainfall and flow regimes. Although the occurrence of zero flows is correlated with rainfall (r = -0.73) there is substantial variation which is not accounted for. For example, some catchments with an annual rainfall of 400 to 500 mm have no zero flows while others with > 700 mm occasionally have zero-flow months. The same weak relationship was found for baseflow (r = -0.49) and the BFI (r = -0.68) but not for the CVI (r = 0.90) or HI (r = 0.92). The percentage of zero flows is also weakly related to the concentration indexes, notably rainfall (r = 0.002).
Discussion
This analysis has found that the relationships between the river flow statistics commonly used in river studies (CVI, BFI, HI) and the flow concentration statistics and percentage zero flows are complex and variable. However, there are distinct spatial patterns in the flow concentrations which are not found in the rainfall concentrations, showing that broad-scale geological and geomorphological distribution patterns do play a role in catchment water storage and its effects on the river flow regimes and the relative importance of groundwater.
The flow patterns are related to the principal aquifer types but they are masked by:
-
Large-scale patterns in climate and other factors, particularly for principal aquifer types which are widely distributed
-
Variations between quaternary catchments in controlling factors such as where the dominant aquifer type is located within the catchment, geomorphology and drainage density
-
The effect of variations in the relative elevation of water levels in rivers and adjacent aquifers on whether groundwater is being discharged into a river or recharged into the aquifer (Sami in DWAF, 2005).
Even when these relationships are examined for catchments within the Crocodile-Marico WMA, they are still complex. The aquifer types, therefore, are not internally homogeneous classes, which is to be expected considering the wide range of climatic settings they are found in and the variety of lithologies they contain in addition to the dominant primary lithology. Some of the variability between catchments also may be due to groundwater discharges being controlled by, and channelled through major geological structures such as fault systems and contact zones which were not included in this analysis. For example, the location of springs in the dolomites is strongly controlled by the presence of dykes which divide the aquifers into compartments (Nel et al., 2002). The major fault systems and folding of the strata of the Table Mountain Group control groundwater movements between catchments and explain the location of features such as cool and hot springs and wetlands (Rosewarne, 2002; Cleaver et al., 2003; Colvin et al., 2003; 2007). The Waterberg Mountains appear to have unusually sustained groundwater discharge with low baseflow concentrations despite an annual rainfall which is not much higher than neighbouring catchments. This may be due to the combined presence of dyke- and fault-controlled deeper aquifer systems (>250 m depth) as well as shallower groundwater storage in smaller-scale fault, joint and bedding-plane structures (Du Toit, 1995).
Some of the variation may also be due to the mix of aquifer types in a catchment, where a particular aquifer type may be present in only a small portion of the catchment but, because it is in a setting where it is an important source of groundwater, it may play a more significant role in groundwater discharge into the river than its relative size indicates. It is also important to recognise that, once the groundwater is in a river system its influence will be propagated downstream as well. This type of connectedness between catchments was not investigated in this study but could play an important role in the ecology of the river sections downstream of the source catchment.
The importance of physiographic factors as determinants of catchment runoff characteristics has been demonstrated in many studies, particularly those aimed at finding physical and climatic parameters than can used in extrapolating flow data or flood frequencies from gauged to ungauged catchments. Factors such as the geological formation, area, drainage density, stream length, mean or median slope, the range of elevation, and topographic variables have been related to the BFI and other low flow statistics as well as flow duration and recession curves (Farvolden, 1963; Hewlett and Hibbert, 1967; Mimikou and Kaemaki, 1985; Acreman and Sinclair, 1986; Nathan and McMahon, 1992; Vogel and Kroll, 1992; Lacey and Grayson, 1998; Zecharias and Brutsaert, 1998a,b; Marani et al., 2001; Plaut Berger and Entekhabi, 2001; Mwakalila et al., 2002; Royappen et al., 2002). The study by Ogunkoya et al. (1984) of 15 catchments in Nigeria is particularly interesting as there are similarities with the geology of the northern parts of South Africa (e.g. granites, amphibolites, gneisses and fractured quartzites). They used stepwise multiple regression and found that climatic characteristics were not important in explaining the runoff responses. Catchments with a high proportion of quartzites had both a high percentage surface runoff and sustained dry season spring flows. Catchments dominated by the other lithologies had a lower percentage runoff and often had seasonal streams. Mwakalila et al. (1992) analysed the relationship between the BFI and physical characteristics of 12 Tanzanian catchments. They found that the climate index (ratio of rainfall to potential evapotranspiration) and a geological index based on the proportion of the catchment with geological formations considered to be reliable aquifers (fractured granites and quartzites) were the most important variables. These findings support our basic hypothesis that geology is an important factor controlling baseflow via its effects on aquifer properties and, thus, on the baseflow discharge regimes (Table 1). The effects of geology can be masked by the effects of the climatic regime, particularly differences in rainfall seasonality and concentrations, but are clearly evident when the catchments being compared have similar climates.
Overall, though, the roles of climate, geology and physiography in determining flows are inter-related and interdependent. Therefore, it is not surprising that much of the variation in the flow statistics investigated in this study can be attributed to differences between catchments within principal aquifer types rather than between types. This does not mean that hydrogeology cannot be used in assessing the importance of groundwater contributions to surface flows. One example is the finding that catchments dominated by carbonates, TMG sub-type and basement complex aquifer types are significantly more likely to have baseflow concentrations < 20% than the other types. The aquifer typology does provide a level of insight but one which needs to be applied at a secondary or smaller catchment scale rather than at a national scale.
There does not seem to be a single statistic which can provide an index of the groundwater contribution to a river system in the same way as HI is being used for river conservation planning (Nel et al., 2004). The BFI and groundwater flow are useful and ecologically meaningful variables but they are annual values and do not have clear cut-offs that correspond to potentially significant ecological differences in river flow patterns which are controlled by groundwater discharge, for example the perennial versus seasonal rivers (Uys and O'Keeffe, 1997). The flow concentrations, particularly for baseflow which - at least in theory – is more directly related to groundwater flow, also are useful and potentially ecologically important variables but the relationships between them and actual flow values are weak, both in general and for the different aquifer types. Zero flows are a promising indicator of flow regimes, especially when used in conjunction with flow concentrations to give a measure of the seasonal distribution of zero flows. This study did not analyse the monthly distribution of zero flows but this is an aspect that could be examined in future studies. The two indexes that are recommended for testing to determine whether they are related to the biodiversity of river ecosystems at a range of scales are the baseflow concentration and the percentage zero flows.
Acknowledgements
This study was supported by Parliamentary Grant funding channelled through Natural Resources and Environment, CSIR. We thank Julian Conrad and Freeternity Rusinga for useful comments.
References
ACREMAN MC and SINCLAIR CD (1986) Classification of drainage basins according to their physical characteristics; and application for flood frequency analysis in Scotland. J. Hydrol. 84 365-380. [ Links ]
BEEKMAN HE and XU Y (2003) Review of groundwater recharge estimation in arid and semi-arid southern Africa. In: Xu Y and Beekman HE (eds.) Groundwater Recharge Estimation in Southern Africa. UNESCO IHP Series No 64, UNESCO, Paris. 3-18. [ Links ]
BEEKMAN HE, GIESKE A and SELAOLO ET (1996) GRES: Groundwater Recharge Studies in Botswana 1987-1996. Botswana J. Earth Sci. III 1-17. [ Links ]
CALDER IR (1996) Water use by forests at the plot and catchment scale. Special Issue on "Forests and Climate' in Commonwealth For. Rev. 75 19-30. [ Links ]
CHEVALIER L, GIBSON LA, NHLEKO LO, WOODFORD AC, NOMQUPHU W AND KIPPIE I (2004) Hydrogeology of fractured-rock aquifers and related ecosystems within the Qoqodala dolerite ring and sill complex, Great Kei catchment, Eastern Cape. WRC Report No. 1238/1/04. Water Research Commission, Pretoria, South Africa. [ Links ]
CLEAVER G, BROWN LR, BREDENKAMP GJ, SMART M and RAUTENBERG CJDeW (2003) Assessment of environmental impacts of groundwater abstraction from Table Mountain Group (TMG) aquifers on ecosystems in the Kammanassie Nature Reserve and environs. WRC Report No. 1115/1/03. Water Research Commission, Pretoria, South Africa. [ Links ]
COLVIN C, LE MAITRE D and HUGHES S (2003) Assessing Terrestrial Groundwater Dependent Ecosystems in South Africa. WRC Report No. 1090-2/2/03. Water Research Commission, Pretoria, South Africa. [ Links ]
COLVIN C, LE MAITRE D, SAAYMAN I and HUGHES S (2007) An introduction to aquifer dependent ecosystems in South Africa. WRC Report No. TT 301/07. Water Research Commission, Pretoria, South Africa. [ Links ]
CONRAD V (1941) The variability of precipitation. Monthly Weather Rev. 69 5-11. [ Links ]
CG (1997) 1: 1 000 000 Scale Geological Map of the Republic of South Africa and the Kingdoms of Lesotho and Swaziland. Council for Geosciences, Pretoria, South Africa. [ Links ]
DOLLAR ESJ, JAMES CS, ROGERS KH and THOMS MC (2007) A framework for interdisciplinary understanding of rivers as ecosystems. Geomorphol. 89 147-162. [ Links ]
DOLLAR LHA, DOLLAR ESJ and MOOLMAN J (2006) Development of an automated desktop procedure for defining macro-reaches for river longitudinal profiles. Water SA 32 395-402. http://www.wrc.org.za/downloads/watersa/2006/Jul%2006/1965.pdf [ Links ]
DU TOIT WH (1995) Explanation Brochure of the Pietersburg (2326) Hydrogeological Map Scale 1:500 000. Directorate Hydrogeology, Department of Water Affairs and Forestry, Pretoria, South Africa. [ Links ]
DWAF (2005) Groundwater Resource Assessment. Phase II. Methodology. Groundwater-surface water interactions. Department of Water Affairs and Forestry, Pretoria, South Africa. [ Links ]
FARVOLDEN RN (1963) Geologic controls on ground-water storage and base flow. J. of Hydrol. 1 219-249 [ Links ]
HATTON T and EVANS R (1998) Dependence of ecosystems on groundwater and its significance to Australia. Occasional Paper No 12/98, Land and Water Resources Research and Development Corporation, CSIRO Australia. [ Links ]
HEWLETT JD and HIBBERT AR (1967) Factors affecting the response of small watersheds to precipitation in humid areas. In: Sopper WE and Lull HW (eds.) Proc. Int. Symp. Forest Hydrol. Pergamon, Oxford, UK. 275-290. [ Links ]
HUGHES DA (2001) Providing hydrological information and data analysis tools for the determination of ecological instream flow requirements for South African rivers. J. Hydrol. 241 140-151. [ Links ]
HUGHES DA (2006) Personal communication. Institute for Water Research, Rhodes University, Grahamstown, Eastern Cape, South Africa. [ Links ]
HUGHES DA and HANNART P (2003) A desktop model used to provide an initial estimate of the ecological instream flow requirements of rivers in South Africa. J. Hydrol. 270 167-181. [ Links ]
HUGHES DA and MÜNSTER F (2000) Hydrological Information and Techniques to Support the Determination of the Water Quantity Component of the Ecological Reserve for Rivers. WRC Report No. TT/137/00. Water Research Commission, Pretoria, South Africa. [ Links ]
HUGHES DA and PALMER CG (2005) SPATSIM, an Integrated Framework for Ecological Reserve Determination and Implementation. WRC Report No. TT 245/04.Water Research Commission, Pretoria, South Africa. [ Links ]
ISSAR I and PASSACHIER R (1990) Part II. Regional hydrogeological concepts. In: Lerner DN, Issar A and Simmers S (eds.) A Guide to Understanding and Estimating Natural Recharge. International contributions to hydrogeology. IAH Publications Vol 8, Verlag Heinz Heisse, Germany. 21-98. [ Links ]
KELBE B, GERMISHUYSE T, SNYMAN N and FOURIE I (2001) Geohydrological Studies of the Primary Coastal Aquifer in Zululand. WRC Report No.720/1/01. Water Research Commission, Pretoria, South Africa. [ Links ]
KING LC (1942) South African Scenery. A Text Book of Geomorphology. Oliver and Boyd Ltd., London. [ Links ]
KINZELBACH W, ALBERICH C, GONI IB, BEYERLE U, BRUNNER P, CHIANG W-H, RUEEDI J and ZOELLMANN K (2002) A Survey of Methods for Groundwater Recharge in Arid and Semi-Arid Regions. Early Warning and Assessment Report Series, UNEO/DEWA/RS.02-2, United Nations Environment Programme, Nairobi, Kenya. [ Links ]
KIRCHNER J, VAN TONDER GJ and LUKAS E (1991) Exploitation potential of Karoo aquifers. WRC Report No. 170/1/91. Water Research Commission, Pretoria, South Africa. [ Links ]
KLEYNHANS CJ, THIRION C and MOOLMAN J (2004) A Level I River Ecoregion classification system for South Africa, Lesotho and Swaziland. Report No. N/0000/00/REQ0104. Resource Quality Services, Department of Water Affairs and Forestry, Pretoria, South Africa. [ Links ]
LACEY CG and GRAYSON RB (1998) Relating baseflow to catchment properties in south-eastern Australia. J. Hydrol. 204 231-250 [ Links ]
LYTLE DA and POFF NL (2004) Adaptation to natural flow regimes. Trends in Ecol. Evol. 19 94-100 [ Links ]
MARANI M, ELTAHIR, E and RINALDO A (2001) Geomorphic controls on regional base flow. Water Resour. Res. 37 2619-2630. [ Links ]
MARGULES CR and PRESSEY RL (2000) Systematic conservation planning. Nature 405 243-253. [ Links ]
McGEE OS (1977) The determination of rainfall seasons in South Africa using Markham's technique. S. Afr. Geogr. 5 390-397. [ Links ]
MIDGLEY DC, PITMAN WV and MIDDLETON BJ (1994) The Surface Water Resources of South Africa 1990. Volumes 1 to 6. WRC Report Numbers 298/1.1/94 to 298/6.1/94 (text) and 298/1.2/94 to 298/6.2/94 (maps). Water Research Commission, Pretoria, South Africa. [ Links ]
MIMIKOU M and KAEMAKI S (1985) Regionalisation of flow duration curves. J. Hydrol. 82 77-91. [ Links ]
MWAKALILA S, FEYEN J and WYSEURE G (2002) The influence of physical catchment properties on baseflow in semi-arid environments. J. Arid Environ. 52 245-258. [ Links ]
NATHAN RJ and McMAHON TA (1992) Estimating low flow characteristics in ungauged catchments. Water Resour. Manage. 6 85-100. [ Links ]
NEL J, MAREE G, ROUX D, MOOLMAN J, KLEYNHANS N, DRIVER A and SILBERBAUER M (2004) National Spatial Biodiversity Assessment: Rivers Component. Technical Report. August 2004. CSIR Report Number ENV-S-I-2004-063, Environmentek, CSIR, Stellenbosch. [ Links ]
NEL JM, HOHONE S and BREDENKAMP DB (2002) Management of dolomitic groundwater resources and ecosystems in the Bo-Molopo dolomites, South Africa. Proc. International Groundwater Conference, 12-17 May 2002, Darwin, Australia. [ Links ]
OGUNKOYA OO, ADJUWON JO and JEJE LK (1984) Runoff response to basin parameters in southwestern Nigeria. J. Hydrol. 72 67-84. [ Links ]
OLDEN JD and POFF NL (2003) Redundancy and the choice of hydrologic indices for characterising streamflow regimes. River Res. Applic. 19 101-121. [ Links ]
PARSONS R (2004) Surface water: groundwater interaction in a South African context. A geohydrological perspective. WRC Report No. TT 218/03. Water Research Commission, Pretoria, South Africa. [ Links ]
PARTRIDGE TC (1997) Evolution of landscapes. In: Cowling RM, Richardson DM and Pierce SM (eds.) Vegetation of South Africa. Cambridge University Press, Cambridge. 1-20. [ Links ]
PARTRIDGE TC and MAUD RR (1987) Geomorphic evolution of southern Africa since the Mesozoic. S. Afr. J. Geol. 90 179-208. [ Links ]
PLAUT BERGER KP and ENTEKHABI D (2001) Basin hydrological response relations to distributed physiographic descriptors and climate. J. Hydrol. 247 169-282. [ Links ]
POFF NL, ALLAN JD, BAIN MB, KARR JR, PRESTEGAARD KL, RICHTER BD, SPARKS RE and STROMBERG JC (1997) The natural flow regime: A paradigm for river conservation and restoration. BioSci. 47 769-784. [ Links ]
RHP (2005) State-of-Rivers Report: Monitoring and Managing the Ecological State of Rivers in the Crocodile (west) Marico Water Management Area. State-of-Rivers Report No. 9, Department of Environment Affairs and Tourism, Pretoria, South Africa. [ Links ]
ROSEWARNE, P (2002) Hydrogeological characteristics of the Table Mountain Group aquifers. In: Pietersen K and Parsons R (eds.) A synthesis of the hydrogeology of the Table Mountain Group – Formulation of a Research Strategy. WRC Report No. TT 158/01 Water Research Commission, Pretoria, South Africa. 33-44. [ Links ]
ROYAPPEN M, DYE PJ, SCHULZE RE and GUSH MB (2002) An Analysis of Catchment Attributes and Hydrological Response Characteristics in a Range of Small Catchments. WRC Report No. 1193/1/02. Water Research Commission, Pretoria, South Africa. [ Links ]
ROUX D, DE MOOR F, CAMBRAY J and BARBER-JAMES H (2002) Use of landscape-level river signatures in conservation planning: a South African case study. Conserv. Ecol. 6 (2) 6. [online] URL: http://www.ecologyandsociety.org/vol6/iss2/art6/ [ Links ]
SAS INSTITUTE INC. (2004) SAS 9.1.2. SAS Institute Inc., Cary, NC, USA. [ Links ]
SAMI K and HUGHES DA (1996) A comparison of recharge estimates to a fractured sedimentary aquifer in South Africa from a chloride mass balance and an integrated surface-subsurface model. J. Hydrol. 179 111-136. [ Links ]
SCHULZE BR (1965) Climate of South Africa. Part 8. General survey. WB 28. Weather Bureau, Pretoria, South Africa. [ Links ]
SCHULZE RE, MAHARAJ M, LYNCH SD, HOWE BJ and MELVIL-THOMPSON B (1997) South African Atlas of Agro-hydrology and – Climatology. WRC Report No. TT 82/96, Water Research Commission, Pretoria, South Africa. [ Links ]
SMAKHTIN VU (2001a) Low flow hydrology: A review. J. Hydrol. 240 147-186. [ Links ]
SMAKHTIN VU (2001b) Estimating continuous monthly baseflow time series and their possible applications in the context of the ecological reserve. Water SA 27 213-217. http://www.wrc.org.za/archives/watersa%20archive/2001/April/1362.pdf [ Links ]
SMAKHTIN VU and TOULOUSE M (1998) Relationships between low-flow characteristics of South African streams. Water SA 24 107-112. http://www.wrc.org.za/archives/watersa%20archive/1998/April/apr98_p107.pdf [ Links ]
SMAKHTIN VU, WATKINS DA and HUGHES DA (1995) Preliminary analyses of low-flow characteristics of South African Rivers. Water SA 21 201-210. http://www.wrc.org.za/downloads/watersa/1995/July/0881%20abstract.pdf [ Links ]
UYS MC and O'KEEFFE JH (1997) Simple words and fuzzy zones: early directions for temporary river research in South Africa. Environ. Manage. 21 517-531. [ Links ]
VAN TONDER GJ and BEAN JA (2003) Challenges in estimating groundwater recharge. In: Xu Y and Beekman HE (eds.) Groundwater Recharge Estimation in Southern Africa. UNESCO International Hydrological Programme, Paris. [ Links ]
VEGTER JR (1995) An Explanation of a Set of National Groundwater Maps. WRC Report No. TT 74/95. Water Research Commission, Pretoria, South Africa. [ Links ]
VEGTER JR (2000) Groundwater Development in South Africa and an Introduction to the Hydrogeology of Groundwater Regions. WRC Report No. TT 134/00, Water Research Commission, Pretoria, South Africa. [ Links ]
VEGTER JR and PITMAN WV (1996) Recharge and stream flow. Workshop on Groundwater – Surface Water Issues in Arid and Semi-arid Areas. Organised by the Water Research Commission and IAH (South Africa), Pretoria, South Africa. [ Links ]
VEGTER JR and PITMAN WV (2003) Recharge and streamflow. In: Xu, Y and Beekman HE (eds.) Groundwater Recharge Estimation in Southern Africa. UNESCO IHP Series No 64, UNESCO, Paris. 109-123. [ Links ]
VOGEL RM and KROLL CN (1992) Regional geohydrologic-geomorphic relationships for the estimation of low-flow statistics. Water Resour. Res. 28 2451-2458. [ Links ]
WARD JV (1998) Riverine landscapes: Biodiversity patterns, disturbance regimes, and aquatic conservation. Biol. Conserv. 83 269-278. [ Links ]
WARD JV and TOCKNER A (2001) Biodiversity: towards a unifying theme for river ecology. Freshwater Biol. 46 807-819. [ Links ]
WIENS JA (2002) Riverine landscapes: taking landscape ecology into the water. Freshwater Biol. 47 501-515. [ Links ]
XU Y, TITUS R, HOLNESS SD, ZHANG J and VAN TONDER GJ (2002) A hydrogeomorphological approach to quantification of groundwater discharge to streams in South Africa. Water SA 28 375-380. http://www.wrc.org.za/archives/watersa%20archive/2002/October/1506.pdf [ Links ]
ZHANG L, DAWES WR and WALKER GR (1999) Predicting the Effect of Vegetation Changes on Catchment Average Water Balance. Technical Report 99/12, CRC for Catchment Hydrology, CSIRO, Canberra, Australia. [ Links ]
* To whom all correspondence should be addressed.
+2721 888 2407; fax: +2721 888 2684;
e-mail: dlmaitre@csir.co.za

