


Serviços Personalizados
Artigo
 Inglês (pdf)
 Artigo em XML
 Referências do artigo
Indicadores

Links relacionados
-
 Citado por Google
 -
 Similares em Google
Compartilhar

 Permalink
Journal of Contemporary Management
versão On-line ISSN 1815-7440
JCMAN vol.12 no.1 Meyerton 2015
RESEARCH ARTICLES
Inside-out mindsets and quality of health services: a case of Kampala Capital City Authority referral hospitals
M TaitI; JM ByarugabaII
IMarketing Management, Nelson Mandela Metropolitan University) E-mail: Madele.Tait@nmmu.ac.za
IIMarketing Management, Nelson Mandela Metropolitan University) Email: jbmbiito61@gmail.com
ABSTRACT
In the contemporary health service setting and the era of the health service client, delivering quality health service is an integral part of the ongoing strategy of most health service providers.
The aforementioned strategy notwithstanding, this study investigated whether medical staffs understand their patients' expectations (known as Gap 1) in the five referral hospitals in Kampala City Capital Authority. Samples of 146 medical staffs and 215 patients from 5 referral hospitals were investigated. Pilot tests indicated that the instruments had good internal consistency, with all Cronbach's alpha reliability coefficients greater than 0.9. Two focus group interviews were conducted for each sub-sample. Structural equation modelling was used to test the theory through confirmatory factor analysis and goodness-of-fit tests. Goodness-of-fit tests established that the model did not fit the sub-sample data.
The independent samples t-test indicated that a positive Gap 1 existed among medical staffs in KCCA referral hospitals; hence they did not understand their patients' expectations. Qualitative findings also showed that Gap 1 existed among medical staffs. This study should be replicated in countries that mirror the socio-economic characteristics of Uganda. A methodological contribution through adoption of triangulation approach was made.
Key phrases: health service; inside-out mindset; patient expectations; patient experiences; referral hospital; service quality
1. INTRODUCTION
In the contemporary health service setting and the era of the service client, delivering quality health service is an integral part of the ongoing strategy of most health service providers. To assess the service strategy, the Gaps model of service quality (Zeithaml, Bitner & Gremler 2006:44) was used.
The model depicts five gaps of which Gaps 1 to 4 are provider gaps and Gap 5 is the customers' gap (Byarugaba & Osarenkhoe 2012:153). Whereas patients' outside-in mindsets reflect service designs based on their expectations only, providers' inside-out mindsets reflect service designs based on their understanding of patients' expectations The extant strategy constitutes an essential ingredient for outside-in mindsets in the present day inside-out laden mindsets in the Ugandan health service sector (Chowdhary & Prakash 2007:493; Dawkins & Reichheld 1990:42; Parasuraman, Zeithaml & Berry 1985:41; Phiri & Mewabe 2013; Reichheld & Sasser 1990:105; Syngellakis & Arudo 2006:Internet; Ulwick & Bettencourt 2008:62; Zeithaml, Parasuraman & Berry 1990:52).
It is worth noting that the two mindsets are not necessarily identical, hence reflecting the providers' Gap 1 in the Parasuraman et al. 1985 model. A 30% decline in the provision of quality health services has been reported (Government of Uganda 2010:245; Okuonzi & Birungi 2000:201-19). The referral hospitals in Kampala Capital City Authority (KCCA) are no exception to this decline. A familiar experience for many inside-out mindset medical staffs, and the need to improve its measurement and control, is a common theme in the service management literature. What constitutes service quality has attracted the attention of researchers all over the world (Chowdhary & Prakash 2007:494; Ma, Pearson & Tadisina 2005:1068; Pynnönen, Hallikas & Savolainen 2008:305; Pynnönen, Ritala & Hallikas 2011:51).
2. BACKGROUND
The service management literature repeatedly draws attention to the reason why the measurement and control of service quality is so difficult (Abdullah 2006:31; Chien-Ta & Wen-Chuan 2010:5; Nor Asiah & Musa 2011:759). Extant literature indicates that primary attention of the current government is re-establishing a political and economic environment conduce for growth (Syngellakis & Arundo 2006:Internet). This government mindset has given less priority to social sector ministries in which health services fall. For example, a realistic annual budget for a large teaching hospital in 1996 was 30bn shillings (£10m, $17m, €13m) but the ceiling was set at 12.26bn in 1996, 8.87bn in 1997, and 13.28bn in 1999.
From the aforementioned, one question comes to the fore, namely: do Ugandan health service providers' perceptions of patients' expectations mirror patients' real expectations? The question implies a disparity between health service providers' perceptions of patients' expectations and what patients' real expectations are.
The aforementioned disparity reflects gap 1 in the gaps model by Parasuraman et al. (1985:42) and was investigated in this research. To appropriately investigate this disparity, two types of respondents were required, i.e. patients' outside-in mindsets (their expectations only) and providers' inside-out mindsets (their understanding of patients' expectations). In the real service setting, patients have expectations (hopes) that they will experience/receive quality health services from health service providers. Gap1 reflects a failure to match the providers' designed to patients' service expectations.
Despite the presence of qualified personnel, technological flaws and intermittent electricity to run referral hospital technologies, continue to affect healthy service quality (Syngellakis &Arudo 2006:Internet). This article builds on the extant knowledge through its adoption of positivistic and qualitative approaches (Collis & Hussey 2009:85). Moreover, no comparable research findings are available for underdeveloped countries, and it is therefore recommended that this research be replicated in a country that mirrors Uganda as regard health services.
3. THEORETICAL OVERVIEW
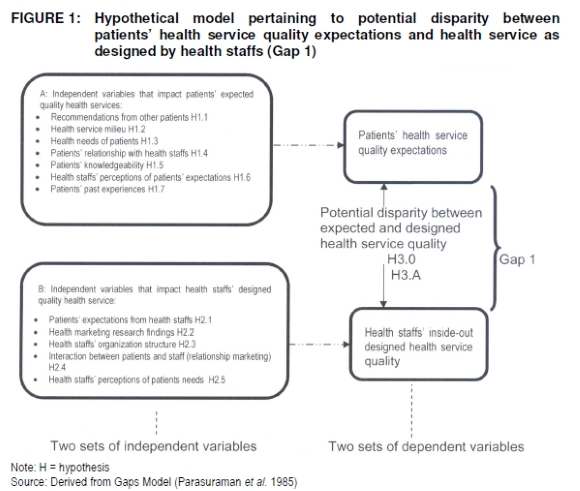
The early pioneers of services marketing in Europe, especially the Nordic School, argued that service quality consists of two or three underlying dimensions. Parasuram et al. (1985:41) referred to physical and interactive quality, whereas Grönroos (1982:266) identified a technical dimension, a functional dimension, and the firm's image as a third dimension. The Nordic perspective defined service quality in global terms as consisting of functional and technical quality, referring to "the delivery process" and "what is delivered," respectively. Gap1 in the Parasuraman et al. (1985:41) gaps model reflects a potential disparity between health service providers' understanding and design of the service patients expect. Whereas seven independent variables were used to investigate patients' expected service quality, five independent variables were used to investigate health staffs' inside-out mindsets during the design of the expected quality health services.
Figure 1 depicts Gap 1 as the potential disparity between patients' expected quality health services and health service quality as designed by health staffs. The hypothetical model in Figure 1 focuses on patients' expectations and the health staff's inclusion of such expectations in their health service designs in KCCA referral hospitals. Parasuraman et al. (1988:12) originally suggested that users (patients in this case) evaluate the expected quality of a service according to 10 service dimensions, namely tangibles, reliability, responsiveness, competence, courtesy, credibility, security, access, communication, and understanding.
Subsequent research tested the dimensions and made considerable modifications, which reduced the original 10 to five, namely tangibility, reliability, responsiveness, assurance and empathy (Pynnönen et al. 2011:52; Zeithaml & Bitner 1996:38; Zeithaml et al. 1990:51; Zeithaml et al. 1996:119;Zeithaml et al. 2006). However, these five dimensions have been criticized for focusing on the functional aspects of the service and overlooking the technical quality aspects (Kang & James 2004:266). Much of this interest has centred on the controversy generated by the service quality gaps model (Parasuraman et al. 1985:41) and particularly the SERVQUAL instrument developed to measure service quality (Parasuraman et al. 1988:13).
Many researchers who have used the SERVQUAL instrument have been critical of its paradigmatic foundation, its convergent and discriminant validity, its use of difference scores, and its use of negatively phrased items (Babakus & Boller 1992:253; Buttle 1995:8; Carman 1990:33; Chowdhary & Prakash 2007:495; Gera 2011:226). To take into account aforementioned criticisms, positively phrased items were used for the five SERVQUAL dimensions used to evaluate patients' expectations of health services as well as health services as designed by health staffs in referral hospitals in KCCA in the Uganda.
4. HYPOTHETICAL MODEL
Owing to the fact that subjective judgement varies from patient to patient, the ultimate quality of health service expectations may vary from patient to patient. Figure 1 hypothesises all of these relationships for this study with directional hypotheses ranging from H1.1 to H1.7. The same dimensions were used for evaluating health service quality as designed by health staffs with hypotheses ranging from H2.1 to H2.5 (see box B in Figure 1). The three sets of hypotheses (H1.1 t- H1.7; H2.1 to H2.5: and H3.0 and H3.A) were all tested during the analysis.
Because of the multicultural and multilingual reality in the health service environment in Uganda, structural equation modelling (SEM) was used to test the relationships among the latent and observed variables in the hypothetical model. In order to use multiple sources of data, the strategy of methodological triangulation was adopted (Collis & Hussey 2009:85). SEM is a multivariate statistical technique for building and testing how theoretical models are supported by sample data (Schumacker & Lomax 2010:2).It is a hybrid technique that encompasses aspects of confirmatory factor analysis (CFA), path analysis, and multiple regressions to estimate a series of interrelated dependence relationships simultaneously (Cooper & Schindler 2006:583).
SEM implies a structure for the covariance between observed variables, and accordingly it is sometimes called covariance structure modelling. LISREL (linear structural relations) and analysis of moment structures models are more commonly used by researchers using SEM (Hatcher 2002:556). In this research AMOS 16.0 was used for analysing the SEM procedures. Given the prespecified hypothetical model to confirm or disconfirm and the need to establish whether it should be accepted or rejected, CFA and goodness-of-fit tests were performed to assess the validity of the model as depicted in Figure 1. SEM has two principal advantages over other multivariate techniques.
Firstly, multiple and interrelated dependence relationships can be estimated simultaneously. Consequently, SEM as a general linear model can simultaneously estimate relationships between multiple independent, dependent and latent variables (unobserved concepts that are not measured directly). Secondly, SEM has the ability to incorporate latent variables into the analysis and account for measurement error in the estimation process (Cooper & Schindler 2006:583). Thus, in contrast to other multivariate techniques, SEM allows the researcher to both assess measurement properties and test for key theoretical relationships in one technique (Hair, Black, Babin & Anderson 2010:23).
5. RESEARCH QUESTION
Based on the seminal role by Parasuraman et al. (1985:41) on service quality perceptions, Gap 1 reflects a potential discrepancy between patients' expectations of quality health services and the inside-out design of quality health service.
Consequently, health staffs need to continuously assess whether the quality of health services they offer matches patients' expectations. Corrective steps should be taken should a disparity be found between expected and designed health service quality. As embodied in the hypothetical model in Figure 1, this research addresses one research question: are the health staffs of referral hospitals in KCCA designing health services as expected by their patients?
6. RESEARCH OBJECTIVES
To address the research question and test the hypotheses, a number of research objectives were set to guide the investigation:
■ to develop an appropriate research instrument for primary data sourcing from patients and health staffs;
■ to analyse primary data, test the hypotheses as stated, and present findings on the potential disparity between health service quality expectations of patients and service quality as designed by health staffs in KCCA referral hospitals; and
■ to analyse and recommend possible strategic actions health staffs can implement to close Gap1.
7. RESEARCH DESIGN
This study adopted the positivistic approach supplemented by the phenomenological approach given the hypothetical model and the operationalisation thereof (Collis & Hussey 2009:85; Santos 2006:288). Given the multilingual nature of patients to KCCA referral hospitals, it was imperative to use methodological triangulation strategies in which quantitative data were supplemented by qualitative data to enhance the validity of the study findings (Collis & Hussey 2009:85; Krueger 2002; Veal 2005).
The approaches and strategies described enabled the model to be empirically tested with a view of confirming or disconfirming service quality theory with regard to Gap 1 among patients and health staffs in KCCA referral hospitals in Uganda. SEM was used through CFA and goodness-of-fit test and an independent samples t-test for this purpose.
8. RESEARCH METHODOLOGY
7.1 Population and sampling methods
Two populations were involved in investigating gap1, namely patients of KCCA referral hospitals (N1) and health staffs of the same hospitals (N2). Two sampling methods were considered appropriate for this study, namely area sampling as the probability sampling method and judgemental sampling as the non-probability sampling method.
For the phenomenological part, two focus groups, each comprising between 6 and 10 participants, were assembled for each sub-sample. For each focus group, an interview lasting between 1 and 2 hours was conducted. The purpose of the group interviews was to benefit from group dynamics in terms of individual participants giving their opinions.
7.2 Reliability and validity of the measuring instruments
Reliability as a reference to the absence of differences in the results if the research were repeated was performed for the instrument (Blumberg, Cooper & Schindler 2005:321 & 318; Collis & Hussey 2009:64; Kothari 2005:74). The pilot test indicated that the instrument had good internal consistency, with all Cronbach's alpha reliability coefficients greater than .8 for both patients' expectations and health staffs designed service quality.
Validity as a reference to the extent to which the research findings accurately reflect the phenomenon under study was performed too (Collis & Hussey 2009:64). SEM was used to test the theory through CFA and goodness-of-fit tests. CFA established whether the model met the required minimum specifications. For a well-specified model, each of the independent variables needed to have a minimum of three statements (scale items) with factor loadings of >0.70 to be considered for further analysis. Given that each independent variable in this research had five scale items, the factors required collectively to have at least three of the five scale items to reflect good model estimation. Failure to meet this minimum condition meant a poorly specified model. Goodness-of-fit tests were performed for the hypothetical model in Figure 1.
In this research, multiple linear regression analyses were performed to assess whether the identified independent variables impacted patients' service quality expectations and health staffs' designed service quality in the KCCA referral hospitals. An independent samples t-test was performed to indicate Gap 1 between patents' expectations and health staffs' designed service quality. Qualitative findings were used to supplement the quantitative results on Gap 1.
Strategies were identified and recommendations made for possible adoption with a view to closing Gap 1.
9. EMPIRICAL FINDINGS
9.1 Confirmatory Factor Analysis (CFA) of patients
The CFA matrix for patients' expectations of quality health services based on the minimum factor loading threshold value of 0.7. The pattern coefficients represent the correlation coefficients between the variables (rows) and factors (columns). The challenge is to interpret the factor loadings worth considering. Hair et al in Byarugaba (2010:113) provide a rule of thumb for making a preliminary assessment of the factor matrix. Literature has it that factor loadings larger than 0.30 are considered to meet just the minimum level, loadings of approximately 0.40 are considered more important, and loadings of 0.50 or greater are considered practically significant.
However, when assessing the validity of a measuring instrument when doing a CFA, the pattern coefficients must be 0.70 or higher (Borg & Groenen 2005; Cooper & Schindler 2006:573; Goode, McNamara 2008; Moutinho, & Chien 1996:5; Sekaran 2003:407). Therefore, the larger the absolute size of the pattern coefficients, the more important the loading when one is interpreting the confirmatory factor matrix.
Table 1 show that all the seven factors received all scale items meeting the minimum factor loading of 0.7 or more. By convention a factor needs to have one or more loadings for inclusion in the regression analysis. By this convention, all factors were included in the regression.
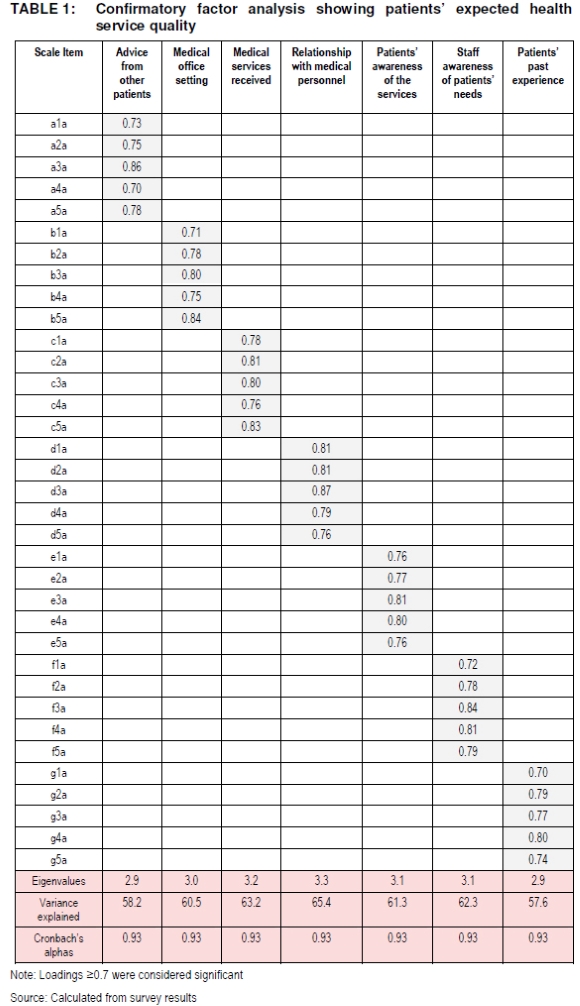
The Cronbach's alpha reliability coefficients in Table 1 are all greater than 0.9, which reflects good internal consistency of the scale items in the research instrument that assessed patients' expectations of health service quality. The alphas indicate that the construct validity of the scales was good. Table 1 also showed significant eigenvalues >2.9, indicating the variance the independent variables exerted on the dependent variable.
Table 1 also indicates that the variance explained in the dependent variable by all the seven independent variables ranged between 57.6% and 65.4%. By convention, independent variables must explain 50% or more of the variance in the dependent variable to be included in the specified model. The results showed that the variance in the dependent variable was adequately explained by all the seven independent variables.
Table 1 further shows the magnitude of the loading for each item of the independent variable. All scale items were above the threshold value for inclusion in the pattern coefficients. The fact that all the scale items did obtain significant factor loadings indicates a good model specification with regard to patients' expectations of health service quality.
9.2 Confirmatory Factor Analysis (CFA) of health staff's designed service quality
The CFA pertaining to health staffs' designed health service quality followed same procedures as for patients' expectations CFA and the results appear in Table 2.
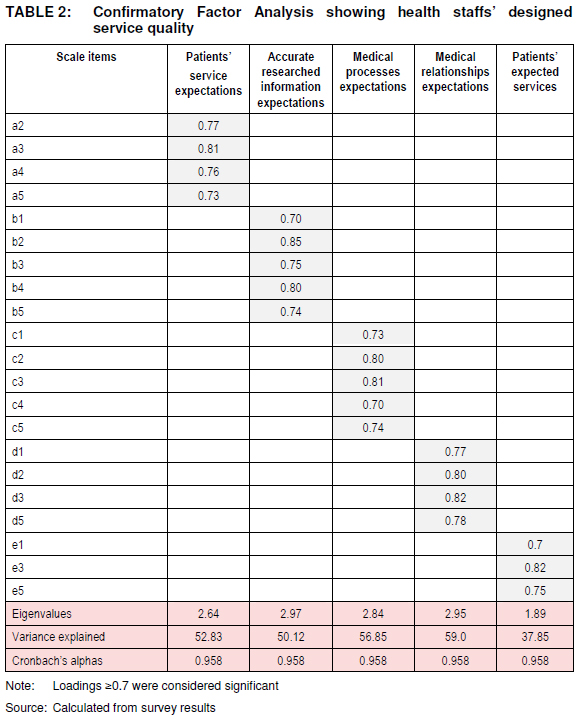
The CFA matrix for the designed health service quality factor loadings represents the correlation coefficients between the variables (rows) and factors (columns). Unlike for patients' expectations scores, only three of the five independent variables had all items loading significantly, namely "accurate researched information", "medical processes expectations", and "medical relationship expectations". The factor "patients' service expectations" received items with factor loading of 0.7 or more while "patients' expected services " received three items with factor loadings of 0.7 or more. The same factor loading threshold value of >0.7 applied in the CFA for health staffs' designed quality health service (Blumberg et al. 2005:664; Cooper & Schindler 2006:573; Sekaran 2003:407).
From Table 2 it is clear that only three independent variables obtained three or more items with the minimum factor loadings, thus meeting the minimum requirements to be included in the regression analysis. The table further shows that four independent variables explained between 50.12% and 59.00% of the variance in the dependent variable while "patients' expected services" independent variable explained only 37.90% of the variance in the dependent variable.
According to secondary sources, an independent variable needs to explain 50% or more of the variance in the dependent variable in order to be included in the empirical model, implying that "patients' expected services" does not meet this requirement, obtaining the minimum three scales with loadings of 0.7 or more notwithstanding.
Eigenvalues >1 that accounted for the proportion of the explained variance are indicated in the Table 2. The Cronbach's alpha scores of >0.9 showed good internal consistency of the scale items in the instrument. As reflected in the CFA for designed health service quality, certain service quality dimensions were not understood by the health staffs in evaluating the quality of designed health services and were subsequently dropped because of low scores.
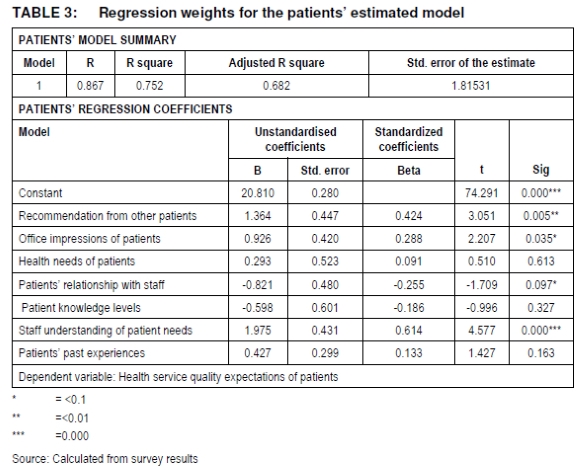
Multiple regression: Evidence exists that service quality has been assessed basing on expectations (Parasuraman et al. 1985:42). On the basis of the aforementioned, only the expectations scales were used in the multiple regression analysis. With reference to Table 3, the patients' hypotheses were tested.
Testing of hypotheses pertaining to patients' health service quality:
H1.1: Recommendations from other patients influence "health service quality" of patients
A statistically significant positive relationship was found between recommendations from other patients and the "health service quality" of patients (p <0.01).
"H1.1 is therefore not rejected" meaning in practice that that "H1.1 is accepted". Therefore, the null hypothesis is rejected. This implies that there is thus sufficient evidence at the 99% level of significance that recommendations from other patients influence health service quality of patients. This finding supports the alternative (directional) hypothesis.
H1.2: Office impressions of patients influence "health service quality" of patients
A statistically significant positive relationship was found between office impressions of patients and "health service quality" of patients (p < 0.1). "H1.2 is therefore not rejected" means that there is in practice that "H1.2 is accepted". Therefore, the null hypothesis is rejected. This implies that there is sufficient evidence at the 90% level of significance that patients' office impressions influence health service quality of patients. The finding supports the alternative (directional) hypothesis.
H1.3: Health needs of patients influence "health service quality" of patients
No statistically significant relationship was found between health needs of patients and "health service quality" of patients (P>0.1). "H1.3 is therefore rejected" meaning in practice that "H1.3 is not accepted". Therefore, the null hypothesis is not rejected. This then means that there is insufficient evidence to support the alternative (directional) hypothesis. Thus health needs of patients do not necessarily influence health service quality of patients.
H1.4: Patients' relationship with staff influences "health service quality" of patients
A statistically significant positive relationship was found between patients' relationship with health staff and "health service quality" of patients (p < 0.1). "H1.4 is then not rejected" meaning in practice that "H1.4 is accepted". Therefore, the null hypothesis is then rejected. This then implies that there is sufficient evidence at the 90% level of significance that patients' relationship with medical staff influences health service quality of patients. Thus the finding supports the alternative (directional) hypothesis.
H1.5: Patients' knowledge levels" influence "health service quality" of patients
No statistically significant relationship was found between "patients' knowledge levels" and "health service quality" of patients (P>0.1). "H1.5 is therefore rejected" meaning in practice that "H1.5 is not accepted". Therefore, the null hypothesis is not rejected. This then means that there is insufficient evidence to support the alternative (directional) hypothesis. Thus, patients' knowledge levels do not influence quality of service to patients in KCCA referral hospitals.
H1.6: Staff understanding of patient needs influence "health service quality" of patients
A statistically significant positive relationship was found between staff understanding of patient needs and "health service quality" of patients (p < 0.01). "H1.6 is therefore not rejected" meaning in practice that "H1.6 is accepted". Therefore, the null hypothesis is not rejected. There is thus sufficient evidence at the 99% level that staff understanding of patient's needs influence health service quality of patients. Thus the findings support the alternative (directional) hypothesis.
H1.7: Patients' past experience influences "health service quality" of patients
No statistically significant e relationship was found between patients' past experience and "health service quality" of patients p >0.1). "H1.7 is then rejected" meaning in practice that "H1.7 not accepted". Therefore, the null hypothesis is not rejected. There is thus insufficient evidence to support the alternative (directional) hypothesis. Thus patients' past experience does not influence quality of health services to patients in KCCA referral hospitals.
Testing of hypotheses pertaining to health staffs' designed health service quality:
Evidence exists that providers' service quality is assessed basing on their understanding of recipients' expectation (Parasuraman et al. 1985:41). On the basis of the aforementioned, multiple regression analyses were performed to test health staffs' hypotheses as depicted in Table 4.
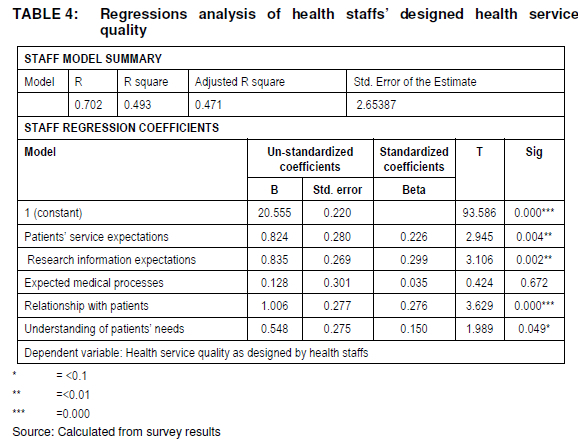
H2.1: Patients' service expectations" influences "health service quality" as designed by health staffs
A statistically significant positive relationship between "Patients' service expectations" and "health service quality as designed by health staffs" was found (p<0.01). "H2.1 is therefore not rejected" means in practice that "H2.1 is accepted". Therefore, the null hypothesis is rejected. This implies that there is sufficient evidence at the 99 percent level of significance that patients' service expectations influence quality of health services as designed by health staffs in KCCA referral hospitals. The findings thus do not support the alternative (directional) hypothesis.
H2.2 Research information expectations" influences "health service quality as designed by health staffs
A statistically significant relationship was found between "research information expectations" and "health service quality as designed by health staffs" (P<0.01). "H2.2 is then mot rejected" meaning in practices that "H2.2 is accepted". Therefore, the null hypothesis is rejected. This then means that there is sufficient evidence at 99 percent that research information expectations influences health service quality as designed by health staffs in KCCA referral hospitals. The findings thus support the alternative (directional) hypothesis.
H2.3: Expected medical processes" influence "health service quality as designed by health staffs
No statistically significant relationship was found between "expected medical processes " and "health service quality as designed by health staffs" (p>0.1). "H2.3 is rejected" means in practice that "H2.3 is not accepted". Therefore, the null hypothesis is not rejected. This then means that there in insufficient evidence to support the alternative (directional) hypothesis. The findings imply that expected medical processes do not influence health service quality as designed by medical staffs.
H2.4: Relationship with patients" influences "health service quality as designed by health staffs
A statistically significant positive relationship between "relationships with patients" and "health service quality as designed by health staffs" (p<0.01) was found. "H2.4 is not rejected" means in practices that "H2.4 is accepted". Therefore, the null hypothesis is rejected. There is sufficient evidence at the 99 percent level of significance that relationship with patients influences health service quality as designed by health staffs. The findings thus support the alternative (directional) hypothesis.
H2.5: Understanding of patients' needs" influences "health service quality as designed by health staffs
A statistically significant positive relationship between "understanding of patients' needs" and "health service quality as designed by health staffs" (p<0.1) was found. "H2.5 is not rejected" means in practices that "H2.5 is accepted". Therefore, the null hypothesis is rejected. There is then sufficient evidence at the 90 percent level of significance that health staffs' understanding of patients' needs influences health services they design for their patients. The findings thus support the alternative (directional) hypothesis.
9.3 Specifications and goodness-of-fit tests
Goodness-of-fit tests were performed to determine whether patients' and heath staffs' models should be accepted or rejected. Multiple regressions were performed to establish variance explanatory power of each independent variable in each of the dependent variable.
For the patients' model, only four regressions reflected significant relationships between the independent and dependent variables, namely: H1.1 (sig.0.005), H1.2 (sig.0.035), H1.4 (sig. 0.097), and H1.6 (sig. 0.000). Adjusted R-square for patients' model was 0.682 indicating a 68% population representation.
For the medical staff model, only 4 regressions reflected significant relationships between the dependent and independent variables namely: H3.1 (sig.0.004), H3.2 (sig. 0.002), H3.4 (sig. 000), and H3.5 (0.049). Adjusted R-square for medical staff model was 0.471 indicating a 47% population representation. Despite the good specifications for both patients' and staffs' models, both failed the goodness-of-fit tests as both depicted independent variables that failed to explain statistically significant variance in the respective dependent variables.
9.4 Independent samples test
To establish whether a disparity existed between "patients' health service quality" expectations and "health service quality" as designed by health staffs, (gap1), an independent samples t-test was imperative as depicted in Table 5. Equal variances were not assumed for this t test since the data came from two different samples (Cooper & Schindler 2006:509; Kothari 2005).
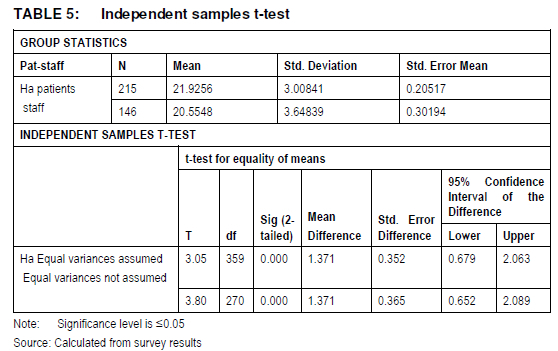
The group statistics indicated that the mean for patients' expectations sample of 215 respondents was 21.9256; and mean for health staffs' sample of 146 for designed health service quality as expected by patients was 20.5548. The mean differences (-1.3708 i.e. 20.5548 - 21.9256) were significant at 99 percent level. It should be noted that when determining Gap 1, patients' expectations mean is subtracted from the health staffs' mean (Zeithaml et al. 1990:188).
This result implies that a negative disparity exists between patients' "expected health service quality" and "health service quality as designed by health staffs" in KCCA referral hospitals in Uganda. The disparity implies patients' health service quality expectations were not met by the health service quality as designed by health staffs.
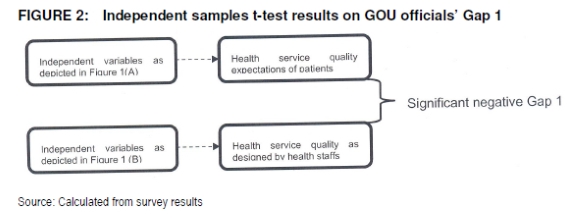
Given that the threshold value for significance is t < 0.05, the independent samples t-test results indicate that the negative disparity (-1.3708) between "health service quality" expectations of patients and "health service quality as designed by health staffs" (Gap 1) in the KCCA referral hospitals in Uganda is significant, as illustrated in Figure 2. This implies that health staffs are delivering less that patients expect.
9.5 Empirical results from qualitative data
Informal methods of quantifying qualitative data were adopted for qualitative data analysis in this study (Collis & Hussey 2009:63). Some rules of thumb were observed in post survey qualitative data collection. In the first instance, the interview guides were derived from the instruments used in the survey. The frequencies of responses were grouped according to the disparity reflected in mindsets between patients' expectations and health staffs' designed health service quality.
As Table 6 shows, three broad mindset groupings emerged namely disparity mindsets, positive disparity mindsets of health staffs, and positive disparity mindsets of patients. It should be stated that each response was traced to its focus group interview, interview question and participant's number in the group. For instance, FG1.1.1 (1) referred to focus group 1, interview question 1, participant 1, and response (1).
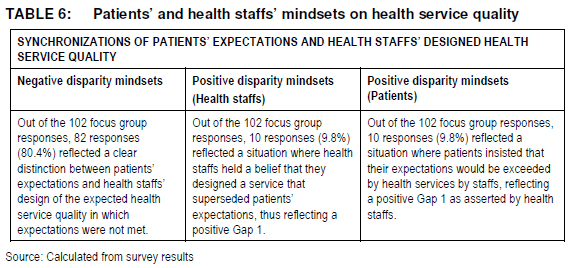
Although the disparity mindset revealed in the quantitative findings were upheld by the disparity mindsets in the qualitative findings, the positive disparities of the patients and health staffs were revealed only by qualitative findings as depicted in Table 6.
The disparity mindsets require health staff attention as they may be detrimental to lives of who consume health services from KCCA referral hospitals in Uganda.
10. RECOMMENDATIONS
Given the emergency of three mindsets under qualitative findings one of which confirmed quantitative results, three health marketing strategies were considered appropriate to alleviate patients' problems in KCCA referral hospitals.
Firstly, given that the majority of Ugandans are low income earners, a "no frills" health service strategy may be crafted with emphasis on meeting basic health service quality expectations of patients in such an income bracket. This strategy closes patients' positive Gap as patients' basic health service quality expectations would be met by the low level designed health service.
Secondly, as the Ugandan middle class is widening, health staffs can craft health service quality according to the positive disparity mindset with a view of meeting patients' added value health services even if it was at an additional charge. This would enhance closure of health staffs' positive disparity without any complaints since the middle income patients are interested in additional value to health service instead of the corresponding additional expenditure.
Thirdly, a health marketing research strategy should be formulated to identify patients' expectations of health services in KCCA referral hospitals in Uganda with a view to closing the negative disparity Gap 1 revealed by both quantitative and qualitative findings. The aforementioned health service quality strategies are by no means exhaustive.
11. LIMITATIONS OF THE STUDY
Despite taking the necessary precautions to ensure the requirements of a good research project were met, such as reliability, validity and generalizability, this study still had some limitations.
Firstly, given 32 local languages spoken in Uganda, the possibility that health service quality concepts may have been misinterpreted, especially by patients may have affected the quantitative part of the research.
Secondly, administrators in each referral hospital restricted access to their patients on grounds that the researcher and assistants were not medically qualified. The researcher was compelled to appoint specific health staffs for questionnaire administration. The focus group interviews were, however, conducted by the principal researcher.
12. FUTURE RESEARCH
Given that both quantitative and qualitative analyses indicated that Gap 5 existed, future research can be directed on other Gaps to find if they could be responsible for poor service to FDI clients. However, only the negative gap 5 was revealed by quantitative findings. The fact that desired and adequate levels of service quality were not revealed in quantitative findings despite their revelation in qualitative findings, the need to investigate these levels further becomes imperative.
It is also worthwhile investigating whether FDI clients' affluence could explain why they were not bothered by the technical dimension of investments from GOU officials. A study including other sectors and other service quality Gaps may also be done in the context of service quality in the Uganda investment environment.
13. CONCLUSION
Quantitative findings revealed the presence a negative Gap 1 reflecting a disparity between patients' expectations of quality health service and health service quality as designed by health staffs in KCCA referral hospitals in Uganda. Qualitative findings revealed similar results, except that in addition to the negative Gap1, two versions of a positive Gap 1 emerged. Positive disparity by health staffs reflected mindsets where they believed their designed service would exceed patients' expectations.
On the other hand, positive disparity by patients reflected mindsets where patients believed that the quality of health services as designed by health staffs would exceed their expectations. The two positive disparities were not revealed under quantitative finds.
Only the negative disparity validated the quantitative findings hence enhancing the validity of the study findings. The aforementioned imply that in comparing patients' expectations of quality health services and health service quality as designed by health staffs, a researcher can come up with three mindsets as depicted in Table 6.
REFERENCES
ABDULLAH F. 2006. Measuring service quality in higher education: HEdPERF versus SERVPERF. Marketing Intelligence and Planning 24(1):31-47. [ Links ]
BABAKUS E & BOLLER GW. 1992. An empirical assessment of the SERVQUAL scale. Journal of Business Research 24:253-268. [ Links ]
BLUMBERG B, COOPER DH & SCHINDLER PS. 2005. Business research methods. Berkshire, UK: McGraw-Hill Education. [ Links ]
BORG I & GROENEN PJF. 2005. Modern multidimensional scaling: theory and applications. Heidelberg, DE: Springer series in statistics. [ Links ]
BUTTLE FF. 1995. SERVQUAL: review, critique, research agenda. European Journal of Marketing 30:8-32. [ Links ]
BYARUGABA JM. 2010. Service quality perceptions in the Uganda mobile telephone branch of industry. Port Elizabeth: Nelson Mandela Metropolitan University. (PhD thesis. [ Links ])
BYARUGABA JM & OSARENKHOE A. 2012. Service quality perceptions: a case of Ugandan telephony users. Journal of Relationship Marketing 11 (3):149-171 [ Links ]
CARMAN JM. 1990. Consumer perceptions of service quality: an assessment of the SERVQUAL dimensions. Journal of Retailing 66(1):33-55. [ Links ]
CHIEN-TA BH & WEN-CHUAN L. 2010. Measuring the service quality of internet banking: scale development and validation. European Business Review 22(1):5-24. [ Links ]
CHOWDHARY N & PRAKASH M. 2007. Prioritizing service quality dimensions. Managing Service Quality 17:493-509. [ Links ]
COLLIS J & HUSSEY R. 2009. Business research. 3rd ed. New York, NY: Palgrave Macmillan. [ Links ]
COOPER DR & SCHINDLER PS. 2006. Business research method. 9th ed. New York, NY: McGraw-Hill. [ Links ]
DAWKINS P & REICHHELD F. 1990. Customer retention as a competitive weapon. Directors and Boards 14:42-47. [ Links ]
GERA R. 2011. Modelling the service antecedents of favourable and unfavourable behaviour intentions in life insurance services in India: a SEM study. International Journal of Quality and Service Sciences 3(2):225-242. [ Links ]
GOODE MMH, MOUTINHO LA & CHIEN C. 1996. Structural equation modelling of overall satisfaction and full use of services for ATMs. International Journal of Bank Marketing 14(7):4-11. [ Links ]
GOVERNMENT OF UGANDA. 2010. Annual health sector performance report. [Internea http://www.health.go.ug/docs/AHSPR09.pdf; downloaded on 17 September 2012. [ Links ]]
GRÖNROOS C. 2001. The perceived service quality concept-a mistake? Managing Service Quality 11 (3):150-152. [ Links ]
HAIR JF, BLACK WC, BABIN BJ & ANDERSON RE. 2010. Multivariate data analysis. 7th ed. Upper Saddle River, NJ: Prentice Hall. [ Links ]
SCHUMACKER RE &LOMAX RG. 2010. A beginner's guide to structural equation modeling. 3rd ed. New York, NY: Taylor & Francis Group. [ Links ]
KANG G & JAMES J. 2004. Service quality dimensions: an examination of Grönroos's service quality model. Managing Service Quality 14(4):266-277. [ Links ]
KOTHARI CR. 2005. Research methodology: methods and techniques. 2nd ed. New Delhi, IND: New Age International. [ Links ]
KRUEGER RA. 2002. Designing and conducting focus group interviews. [Internet: http://www.tc.umn.edu/~rkrueger/about.html; downloaded on 17 August 2012. [ Links ]]
MA Q PEARSON JM & TADISINA S. 2005. An exploratory study into factors of service quality for application service providers. Information & Management 42:1067-1080. [ Links ]
MCNAMARA C. 2008. General guidelines for conducting interviews. [Internet: http://www.managementhelp.org/evaluatn/interviews.htm; downloaded on 14 October 2012. [ Links ]]
NOR ASIAH O & MUSA R. 2011. Measuring service quality in retail loyalty programmes (LPSQual): implications for retailers' retention strategies. International Journal of Retail & Distribution Management 39:759-784. [ Links ]
OKUONZI SA & BIRUNGI H. 2000. Are lessons from the education sector applicable to health sector reforms? The case of Uganda. Int. Health Planning Manage 15:201-19. [ Links ]
PARASURAMAN A ZEITHAML VA & BERRY LL. 1985. A conceptual model of service quality and its implications for future research. Journal of Marketing 49:41-50. [ Links ]
PARASURAMAN A, ZEITHAML VA & BERRY LL. 1988. SERVQUAL: a multiple item scale for measuring consumer perceptions of service quality. Journal of Retailing 64(1):12-40. [ Links ]
PHIRI MA & MEWABE T 2013. Customers' expectations and perceptions of service quality: the case of Pick N Pay supermarket stores in Pietermaritzburg area, S.Africa. International Journal of Research in Social Sciences 3(1):96-104. [ Links ]
PYNNÖNEN M, HALLIKAS J & SAVOLAINEN P. 2008. Mapping business: value stream based analysis of business models and resources in ICT service business. International Journal of Business and Systems Research 2(3):305-323. [ Links ]
PYNNÖNEN M, RITALA P & HALLIKAS J. 2011. The new meaning of customer value: a systemic perspective. Journal of Business Strategy 32(1):51-57. [ Links ]
REICHHELD F & SASSER WL Jr. 1990. Zero defections: quality comes to services. Harvard Business Review 68:105-111. [ Links ]
SYNGELLAKIS K & ARUDO E. 2006. Health sector policy overview paper. Uganda health service commission website. [http://hsc.go.ug/; downloaded on 2-2-2011. [ Links ]]
SANTOS GJ. 2006. Card sort technique as a qualitative substitute for quantitative exploratory factor analysis. Corporate Communications 11(3):288-302. [ Links ]
SEKARAN U. 2003. Research methods for business: a skill building approach. 4th ed. Hoboken, NJ: Wiley. [ Links ]
ULWICK AW & BETTENCOURT LA. 2008. Giving customers a fair hearing. MIT Sloan Management Review 49(3):62-68. [ Links ]
VEAL AJ. 2005. Business research methods: a managerial approach. 2nd ed. Kuala Lumpur, MY: Pearson Education. [ Links ]
ZEITHAML VA & BITNER MJ. 1996. Services marketing. New York, NY: McGraw-Hill. [ Links ]
ZEITHAML VA, BERRY LL & PARASURAMAN A. 1996. The behavioral consequences of service quality. Journal of Marketing 60:31-46. [ Links ]
ZEITHAML VA, BITNER MJ & GREMLER DD. 2006. Services marketing: integrating customer focus across the firm. New York, NY: McGraw-Hill Irwin. [ Links ]
ZEITHAML VA, PARASURAMAN A & BERRY LL. 1990. Delivering quality service: balancing customer perceptions and expectations. New York, NY: Free Press. [ Links ]

