


Serviços Personalizados
Artigo
 Inglês (pdf)
 Artigo em XML
 Referências do artigo
Indicadores

Links relacionados
-
 Citado por Google
 -
 Similares em Google
Compartilhar

 Permalink
Journal of Contemporary Management
versão On-line ISSN 1815-7440
JCMAN vol.11 no.1 Meyerton 2014
RESEARCH ARTICLES
The ability of the Altman Z-score to predict the relative success of industrial companies listed on the Johannesburg Stock Exchange
A MaraisI; S SoniI; P ChitakunyeII
IUniversity of Kwazulu-Natal
IIUniversity of the Witwatersrand
ABSTRACT
Business failure prediction models, such as the Altman Z-score, are promoted as tools to assist with business turnaround and managerial decisions. While much research has been performed on such models ability to predict business failure, there is limited research relating to these models ability to predict future success and improved performance.
The aim of this study was to investigate whether the Altman Z-score was capable of predicting the relative level of financial success one year after the financial results on which the Z-score was based. Ordinary least squares regression is used to draw insights from a sample of 13 companies listed under the Industrial sector (J257) on the Johannesburg Stock Exchange.
Findings from the analysis reveal inconclusive results on the Z-scores ability to accurately predict financial success. Drawing from the findings, managers in the Industrial sector in South Africa who are seeking to improve the performance of their companies, as well as investors and portfolio managers, should use caution when interpreting the results obtained from the Altman Z-score.
Key phrases: Altman Z-score; Johannesburg Stock Exchange; return on assets; shareholders' return; stock exchange; success
1. INTRODUCTION
One of the primary concerns of a capitalist society is the accumulation of wealth (Kasser, Cohn, Kanner & Ryan 2007:3). The more wealth accumulated by the person in a capitalist society, the better off he or she is. Various methods of accumulating wealth exist, such as investments in shares, bonds and property. Investors in shares would want to maximise their shareholders' returns which comprises capital appreciation as well as dividends (Correia, Flynn, Uliana & Wormald 2007:3-8). The companies in which these shareholders invest have, in terms of the theory of the firm, the maximisation of profits as their primary aim (Spulber 2009:67).
The objectives of both the investor and company management are similar in that they both require the company to be successful. In other words, a success measure for a shareholder could be the return on investment measured by the change in the share price plus any dividends received. Likewise, success for company management could be the maximisation of profit after tax, measured by return on assets to ensure comparability for companies of different sizes.
Much research has been done on understanding what aspects of financial statements correlate with improved shareholders' returns (De Wet & Erasmus 2011 ; De Wet & Hall 2006; Dimitropoulos & Asteriou 2009; Johnson & Soenen 2003). Much is also known about predicting business failure in order to find a means to minimise the risk of loss through failure (Alareeni & Branson 2013; Altman 1968; Ghodrati & Moghaddam 2012; Grice & Ingram 2001). What is less known about is whether it is possible to predict a company's future financial performance based on its current financial situation.
This study aims to test whether the Altman Z-score is capable of predicting a company's future relative level of financial success and can hence be used as a tool by management to improve a company's financial performance.
The next section defines the term 'success' and then discusses why the Altman Z-score was selected as the measure of a company's current financial situation (predictor variable). The development of the Z-score, its uses and successes to date are then discussed. Finally, the data analysis is performed and the results and conclusions presented.
2. DEFINITION OF KEY VARIABLLES
2.1 What is business success?
Financial success can be measured in many different ways. It is thus important that a consistent view of success is achieved. Success is defined as "the achievement of an aim or purpose" (Kernerman & Smith 2011:710). Thus, in order to accurately measure success, one needs to determine the underlying aim or purpose to be achieved.
The two parties for which success is will be considered are the company itself and the investor in the company. The success measure for each party is discussed below. An investor, or owner of the company, is a consumer (Spulber 2009:153). In terms of consumer theory (a theory addressing how a consumer makes consumption decisions), the primary aim or purpose of a consumer is to maximise utility, subject to budgetary constraints. Utility refers to preferences for certain goods and services over other goods and services. The combination of goods and services that are preferred is dependent on the individual consumer (Levin & Milgrom 2004:Internet).
Thus, by maximising utility, the consumer is attempting to maximise the benefit received from the good or service and will not choose a good or service if it does not benefit him or her. The benefit that arises from investing in a company's shares arises in the form of capital growth and dividend pay-out (Correia et al. 2007:3-8). Thus, when investing in a share, a consumer seeks to choose the share that he or she feels will maximise capital growth and dividend pay-out.
This is consistent with De Wet and Hall (2006:57) who note that, for shareholders, value is created by the increase in the share price. Thus, the success measure considered most appropriate for investors is return on the share (herein referred to as shareholders' return) calculated as:
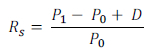
where:
Rs is the return on the share for the year
Pi is the share price at the end of the year
P0 is the share price at the beginning of the year
D is the dividend received on the share during the year (Correia et al. 2007,ch3:9).
A company listed on the JSE is considered to be a firm in terms of the theory of the firm. One of the underlying criteria of the theory of the firm (a theory concerned with the nature of a firm or company) is that the objectives of the firm are different from the objectives of its owners (i.e. the investors in the company) (Spulber 2009:64). This is known as the separation criterion and it implies that the primary aim or purpose of a firm is to maximise profits (Spulber 2009:67).
This view is consistent with Doyle's (i994:i24) findings that profitability is the basis of a company's success and an important goal for most firms. As a firm should consider financing and taxation decisions in the objective of profit maximisation (Berkshire Hathaway Inc.
2000:Internet; Berkshire Hathaway Inc. 2002:Internet; Wolinsky 2011 :Internet) net profit after tax is used as the relative success factor. This is because a firm has control over its financing and taxation structures and they are valid expenses.
In order to standardise the profit maximisation criteria across different sized companies, the ratio of return on total assets (net profit after tax / total assets at the start of the year, herein referred to as return on assets) is utilised.
2.2 Independent predictor variable: the Altman Z-score
The Altman Z-score has been selected as the predictor of future company success levels. It was selected as it is simple to use and the data required in calculating the score is readily available at minimal cost (Altman 1968:608; Twenty Third Floor 2008:Internet).
Further to this, the Altman Z-score is one of the best known and most widely used models in predicting financial failure (Brickell 2011:Internet; Ray 2011:156). Finally, research has shown that there is a relationship between the Altman Z-score and the market value of a company (Brickell 2011 :Internet; Calandro 2007:41).
Research by Morgan Stanley analysts shows that companies with weak balance sheets tend to underperform the overall market for a greater percentage of the time than companies with stronger balance sheets (Brickell 2011:Internet). Further, companies scoring less than one on Altman's model underperformed the market by 4% or more (Brickell 2011 :Internet).
The Altman Z-score is linked to the success of a company by being able to discriminate between failure and non-failure of the company. The first financial goal of any company is to survive (Calandro 2007:38). The Z-score, by being able to discriminate between companies that will survive and those that will fail within one or two years of the calculation, shows that it has both predictive power as well as the ability to determine a form of success (i.e. survival).
De Wet and Erasmus (2011:148) noted that the best indicators of success of companies in the United States were the size of the company (measured by total assets), profitability of the company (measured by return on assets), working capital management (measured by the cash conversion cycle) and the uniqueness of the company.
Although none of these indicators, with the exception of economic value added over total assets (EVA/TA) were statistically significant to success in a South African context, it was noted that there were a number of significant differences between the South African study and the United States study (De Wet & Erasmus 2011:160).
The Altman Z-score considers three of these four indicators in the discriminant function, the missing indicator being that of uniqueness.
3. LITERATURE REVIEW
3.1 Development of the Altman Z-score
The Altman Z-score is a multivariate discriminant analysis function that was developed by Professor Edward Altman in 1968 (Altman 1968:589). Multivariate discriminant analysis is a statistical technique which attempts to develop a linear function consisting of a number of independent variables that have the ability to classify certain phenomena into mutually exclusive groupings (Ghodrati & Moghaddam 2012:57).
In the case of Altman's Z-score, these groupings are either bankrupt firms or non-bankrupt firms (Ghodrati & Moghaddam 2012:57). Altman's function makes use of five ratios, each weighted by a different co-efficient in order to identify companies that are in financial distress and likely to fail (Brickell 2011:Internet). In essence, it is a balance sheet measure which assesses a company's financial health.
The function developed by Altman (1968:594) is as follows:
Z = 0.012X1 + 0.014X2 + 0.033X3 + 0.006X4 + 0.999X5
where:
X1 = working capital / total assets
X2 = retained earnings / total assets
X3 = earnings before interest and taxes / total assets
X4 = market value of equity / book value of total debt
X5 = sales / total assets.
Altman (1968:606) noted that companies with a Z-score exceeding 2.99 fell into the non-bankrupt category (i.e. did not go bankrupt in the following two years). However, companies with a Z-score below 1.81 fell into the bankrupt category. Companies scoring between 2.99 and 1.81 fell into a 'zone of ignorance'.
Altman (1968:593) developed the above model with a total sample of sixty-six manufacturing companies of which thirty-three had filed for bankruptcy and thirty-three were not bankrupt. Twenty-two financial ratios were selected as a part of the study, of which the above five ratios were actually used as they were best able to predict the event of bankruptcy together (Altman i968:593-594). In his initial sample, Altman (i968:599-600) achieved an accuracy level of 95% in correctly classifying companies as either bankrupt or not bankrupt one year prior to the company filing for bankruptcy, and 83% accuracy level two years prior to the company filing for bankruptcy.
3.2 Subsequent studies on the Altman Z-score
Since its development in 1968, Altman's Z-score has been the subject of much research in order to determine its applicability to industries other than manufacturing and within time periods different from its original development (Grice & Ingram 2001:53). More recently, studies have found that the Altman's Z-score is less accurate at correctly classifying failed and non-failed companies in developing economies (Alareeni & Branson 2013:114).
Grice and Ingram (2001:59) tested the generalisability of the Z-score for the period 1985 to 1991. They found that the model's overall accuracy was only 57.8% for all companies and 69.1% for manufacturing companies. Grice and Ingram (2001) re-estimated the coefficients of the model and were able to achieve 88.1% accuracy for all companies and 86.4% accuracy for manufacturing companies.
In a South African context, Kidane (2004:124-125) assessed the accuracy of the Altman Z-score in relation to IT and service companies listed on the JSE. Kidane (2004:124) found that the Z-score had a success rate of 79% one year prior to bankruptcy and 78% two years prior to bankruptcy in identifying companies that went bankrupt. However, the model was not successful in classifying non-failed companies; it only achieved 32% accuracy one year prior to expected failure and 33% accuracy two years prior to expected failure.
In another South African-based study, Mazaba (2010:36-37), found that the Z-score was relatively accurate at correctly classifying companies which later failed, with an accuracy that ranged between 78% and 86%. However, the model's classification of non-failed companies was very low. These results are consistent with those of Kidane (2004), as already discussed above.
In a study in Tehran, Altman's Z-score was found to have no effective variable with enough explanatory power to predict corporate failure. The model was thus not used any further in the study (Ghodrati & Moghaddam 2012:63). Alareeni and Branson (2013:117-118) applied the Altman Z-score model to a sample of 71 failed and 71 non-failed companies in Jordan and found that the original model was successful in identifying failed industrial companies.
The model was found to have 73.4% and 74.5% accuracy in the first and second years prior to bankruptcy.
Diakomihalis (2012:105-108) performed a study on the accuracy of the Altman Z-score in the hotel sector in Greece. While the study found that the Altman Z-score had an accuracy of 88.24% one year prior to bankruptcy, it should be noted that the classification range of the Z-score had been altered from 1.8 (refer above) to 0.8 in order to better identify bankrupt hotel companies.
From the above studies, the success of the Altman Z-score in predicting corporate failure is inconclusive. While some studies found the original model to be successful, others required adjustment to either the model's coefficients or classification range. Finally, some studies, such as that of Ghodrati and Moghaddam (2012:63) above, found the Altman Z-score to be ineffective.
Overall, Grice and Ingram (2001:57) conclude that the model is not as useful in predicting corporate failure in recent years as it was when originally developed by Altman in 1968. Further, the accuracy of the model declines when non-manufacturing companies are included. With this in mind, results produced by the Altman Z-score should be interpreted with caution (Grice & Ingram 2001:60).
In addition to being used to identify companies in financial distress and likely to suffer bankruptcy, the Altman Z-score has also been used for a number of other purposes, such as a business turnaround strategy tool at GTI Corporation (Calandro 2007:38-40), business loan evaluation (Altman 1968:607; Grice & Ingram 2001:53), for security and portfolio analysis in investment banking (Altman 1968:608; Grice & Ingram 2001:53), as a management decision tool (Grice & Ingram 2001:53) as well as a management performance tool (Calandro 2007:51). Further, it has been used by auditors to assess the going concern of companies (Grice & Ingram 2001:53). In fact, much research has been performed on the accuracy of the Altman Z-score in predicting corporate failure as well as methods to improve the score to better predict corporate failure (Ray 2011:155).
However, no significant research has been performed on the ability of the Z-score to predict the future success levels of listed Industrial companies measured by shareholders' return and return on assets. More importantly, no research in this regard could be found in a South African context.
4. RESEARCH HYPOTHESIS
The purpose of this study is to test the existence and strength of linear relationships between the Altman Z-score (the independent variable) and the success level (measured by shareholders' return and return on assets) of a company one year after the reporting date of the financial information used to calculate the Z-score.
The two hypotheses are that a linear relationship will exist between the Z-score and the chosen success measures one year after the calculation of the Z-score:
Hypothesis 1 (H1): There is a significant linear relationship between the Altman Z-score and the shareholders' return as calculated one year after the reporting date of the financial information used to calculate the Z-score.
Hypothesis 2 (H2): There is a significant linear relationship between the Altman Z-score and the return on assets as calculated one year after the reporting date of the financial information used to calculate the Z-score.
5. RESEARCH METHODOLOGY
Given the nature of the research objectives, a quantitative approach has been adopted.
Data was obtained from the McGregor BFA annual financial statement database. The data used was as published in the financial reports of companies. The financial reports of a company are the main source of financial information for investors and thus this information was considered appropriate.
A total of seven years of data was collected from 2006 to 2012 to ensure that the data used was recent. As the original Altman Z-score is used, the JSE sector most closely representing manufacturing companies was selected; this was the industrial sector. A total of seventy industrial companies were listed on the JSE (index code J257) at the start of the study in March 2013.
First, all companies for which information was not available for the full seven years were eliminated. This resulted in twenty-eight companies being eliminated. Next, in order to ensure comparability across the sample, all companies which did not have a June year-end were eliminated. June year-ends were selected to remove the impact of different financial reporting periods as well as to ensure the maximum sample size and representation. This resulted in a further twenty-eight companies being eliminated.
Finally, outliers were investigated (refer to Findings below) and where it was identified that the outlier did not fit with the sample, the outlier was removed. This resulted in one company being eliminated.
Thirteen companies remained at the end of the sample selection process. Table 1 describes the sample selection process.
Two linear regression calculations, one for shareholders' return (1) and one for return on assets (2), are performed for each year for the years 2006 to 2011, all with a sample of thirteen observations. Further, two pooled regression calculations are performed, both with an effective sample of seventy-eight observations. The regression equations are as follows:
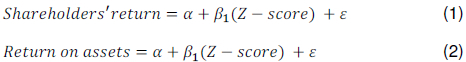
The 2012 financial year is only used to calculate the measures of success and is not used for predictive purposes. This is due to the timeframe of the study were the 2007 to 2012 years are being predicted by the 2006 to 2011 lagged Z-scores.
Two limitations arise based on the selection of the sample. The first is that data over the period of the economic recession which began in 2007 has been used (Mosley & Singer 2009:420). As a result, share prices declined rapidly and the global economy became volatile. It is thus expected that the testing of the pooled sample will result in, at best, a weak correlation. This is not considered to have any further significant effect as the study seeks to evaluate whether a higher Z-score translates to greater success between companies. Thus, a company with a higher Z-score than another company should have a greater profit (or lesser loss) than the other company in the same year, regardless of the state of the economy.
The second limitation is the small sample size of only thirteen companies. This can be viewed as an avenue for further research.
Ordinary least squares linear regression has been used to determine whether a relationship exists between the Altman Z-score and the two success measures as calculated one year after the Altman Z-score.
This method is appropriate as it allows for the prediction of the two success measures (the dependent variables) based on the value of the Z-score (the predictor variable) (Howell 2002:244). Simply testing the correlation between the predictor variable and the two dependent variables would be inappropriate as the predictor occurs one year prior to the dependent variables and thus, correlation would only occur in one direction. The data analysis has been performed using the SPSS statistical package.
The following process has been followed for each of the six years that the Altman Z-score is calculated to predict the two measures of success and the pooled sample.
First, potential outliers were identified by use of a scatter diagram. Outliers were then investigated to confirm whether the observation fitted with the sample. The nature and business profile of the company was checked to confirm that it correctly conformed to the JSE industry classification. If this was found to be true, the outlier was considered a valid observation and remained within the sample (Keller & Warrack 2003:645).
Next the regression equation is estimated. The model fit is assessed using the coefficient of determination (R2 where R2 =  ). The t test of β1 (t =
  ) and associated significance is used to assess the validity of the equation as there is only one independent variable (Keller & Warrack 2003:669).
Following this, the assumptions underlying linear regression are assessed as follows:
■ The non-normality of the residuals is tested using the Shapiro-Wilk test (W =  ) due to the sample size of less than 20 (Shapiro & Wilk 1965:592, 610). A p-score of less than 0.05 indicates non-normality of the residuals.
■ The model is tested for heteroscedasticity (this term refers to the error term not having a consistent variance) using the Levene test (W = 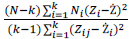 (Levene 1960:283)).
To perform this test, the Z-score is split into two independent samples based on the mean value of the Z-score. Again, a p-score of less than 0.05 indicates the presence of heteroscedasticity.
■ The independence of the error variable (serial correlation) is tested using the Durbin-Watson test (d =  (Keller & Warrack 2003:681)). The Savin and White tables have been used to identify instances of serial correlation at the 1% significance level (P<0.01).
If no statistically significant linear relationship exists and the regression equation fails to meet the underlying assumptions of linear regression, H1 and H2 are rejected. The results will be considered to be significant at the 5% significance level (P<0.05).
6. FINDINGS AND DISCUSSIONS
This section focuses on reporting and discussing the findings. First, the outlier investigation is reported on. Then, the regression results are discussed. There is particular focus on the tests surrounding shareholders' return and return on assets.
6.1 Outlier investigation
During the identification and investigation of outliers, one company was identified as not fitting within the sample and was dropped from the sample. This company was identified as having significantly diversified its operations beyond that of what could be classified as a primarily industrial company and now considered itself an investment holding company.
Areas of diversification included banking and financial services; medical services; food, wine and spirits; petroleum products; glass products; shipping, freight and logistics; media; and technology. The regression statistics were thus run on a final sample of thirteen companies across the six year period.
6.2 Regression results
The regression results are presented in Table 2. Descriptive statistics relating to the Z-score and two measures of success (shareholders' return and return on assets) are presented in Table 3.
6.2.1 Shareholders ' return
The Altman's Z-score demonstrated low R2 values (range = 0.000 to 0.096) when predicting the shareholders' return one year after the financial results on which the Z-score was calculated.
The lack of a correlation (R2 = 0.000) in the pooled results may have been as a result of the impact created by the economic recession (refer to the limitations discussed above). Further to this, none of the regression models associated with predicting the shareholders' return was statistically significant. It was found that the regression equations met the underlying assumptions for the years 2006 to 2009.
However, following these years, the equation failed to meet at least one of the assumptions each year. The 2010 financial year showed evidence of heteroscedasticity (W = 5.116, p = 0.045) and serial correlation (d = 0.496).
The 2011 financial year showed evidence of serial correlation only (d = 0.732). The pooled data showed evidence of non-normality of the residuals (W = 0.949, p = 0.004) and serial correlation (d = 0.883). Due to the small sample sizes (n = 13), low R2 values and statistically insignificant coefficients; no transformations were performed on the data.
Drawing from these findings, there is no significant relationship between the Z-score and shareholders' return at the 5% level of significance. Therefore, the Z-score has no ability to predict shareholders returns. Hypothesis 1 is thus rejected.
6.2.2 Return on assets
With the exception of the 2007 financial year, the Altman Z-score demonstrated low R2 values (range = 0.039 to 0.362) when predicting the return on assets one year after the financial results on which the Z-score was calculated. The 2007 financial year demonstrated a moderate R2 value (R2 = 0.535).
However, with the exception of the 2006 financial year, the R2 values were significantly higher than the values obtained when predicting the shareholders' return. Further, unlike the shareholders' return regression models, the results for the 2007 regression model and the pooled data were statistically significant at the 1% level. The 2009 and 2010 regression models were statistically significant at the 5% level.
Of the above mentioned financial years, the underlying assumptions of linear regression were adequately met. However, the pooled data failed to meet the assumption of normality of the residuals (W = 0.658, p < 0.001). This was due to positive skewness (this occurs when the distribution of the residuals has a long tail extending to the right) and kurtosis (this refers to the "peakedness" of the distribution of the residuals).
A natural log transformation was performed on the pooled data return on assets. This transformation resulted in four samples being lost due to negative return on asset values. The result of the transformation was that the Z-score significantly predicted the return on assets, Pi = 0.183, t = 3.292, p = 0.002. The Z-score demonstrated a weak, but statistically significant correlation to the return on assets, R2 = 0.131, F = 10.837, p = 0.002. Again, the weak correlation in the pooled data could have been as a result of the economic recession experienced during the period. However, the residual errors were still not normally distributed after the transformation, primarily due to kurtosis.
The regression equations of the 2006 and 2011 financial years were not statistically significant. The 2006 financial year met the assumptions of homoscedasticity and independence of the error variable but failed with regards to the normality of the residuals ( W = 0.587, p < 0.001). The 2011 financial year met all of the above mentioned assumptions. Due to the small sample sizes and low R2 values, no transformation of the data was performed due to the possibility of losing further samples.
Although four of the six years investigated and the pooled data had statistically significant regression models, the R2 values were weak. Further, two of the years investigated had statistically insignificant regression models. As a result of the inconclusive results in respect of return on assets, further testing using a larger sample size will be required before any conclusions may be drawn.
7. CONCLUSION
This study yielded unconvincing results with regard to the prediction of shareholders' return suggesting that investors must exercise caution when interpreting the Z-score data with respect to shareholders' return. The prediction of return on assets showed some promise because the 2007, 2009 and 2010 financial years and the pooled data yielded statistically significant association with the Z-score (P<0.05), suggesting that the Z-score was able to predict the return on assets. However, the association is not powerful because only the 2007 financial year demonstrated moderate strength as reflected by the R2 value while the rest of the data indicated a weak association. The 2006 and 2011 financial years yielded statistically insignificant (P>0.05) association with the Z-score.
The implications of these findings is that the predictive value of the Z-score on both shareholders' return and return on assets requires further scrutiny and a larger sample should be used to validate the findings of the study. Meanwhile, investors and company management should exercise caution and not rely solely on models such as the Altman Z-score in assessing the future financial performance of listed Industrial sector companies.
Although the sample was small, the results of this study may be useful in future efforts (using a larger sample) to find effective, cost efficient measures to assist managers in identifying areas for improvement in their company's. Areas for future research include:
■ Performing the current study using a larger sample size. This could be achieved by including other industry classifications and applying panel data techniques to remove fixed or random effects.
■ Testing alternative prediction models such as the Ohlson model (Ohlson 1980), the Fulmer model (Fulmer, Moon, Gavin & Erwin 1984) or the McKee genetic model (McKee & Lensberg 2002).
■ Using other possible measures of financial success for companies and investors such as Economic Value Added.
■ Incorporating considerations for new listings which occurred during the period studied as well as delisting which occurred in order to avoid any survivorship bias.
■ Investigating industries listed on the JSE other than just the industrial sector.
REFERENCES
ALAREENI B & BRANSON J. 2013. Predicting listed companies' failure in Jordan using Altman models: a case study. International Journal of Business and Management 8:113-126. [ Links ]
ALTMAN EI. 1968. Financial ratios, discriminant analysis and the prediction of corporate bankruptcy. Journal of Finance 23:589-609. [ Links ]
BERKSHIRE HATHAWAY INC. 2000. Chairman's letter. [Internet: www.berkshirehathaway.com/2000ar/2000letter.html; downloaded 2013-03-17. [ Links ]]
BERKSHIRE HATHAWAY INC. 2002. Berkshire Hathaway Inc. 2002 annual report. [Internet: www.berkshirehathaway.com/2002ar/2002ar.pdf; downloaded 2013-03-17. [ Links ]]
BRICKELL D. 2011. The Altman Z-score: is it possible to predict corporate bankruptcy using a formula? [Internet:www.stockopedia.co.uk/content/the-altman-z-score-is-it-possible-to-predict-corporate-bankruptcy-using-a-formula-55725; downloaded 2013-03-08. [ Links ]]
CALANDRO JR J. 2007. Considering the utility of Altman's Z-score as a strategic assessment and performance management tool. Strategy & Leadership 35:37-43. [ Links ]
CORREIA C, FLYNN D, ULIANA E & WORMALD M. 2007. Financial management. Cape Town: Juta. [ Links ]
DE WET J & ERASMUS Y. 2011. Indicators of corporate financial success: similar studies in South Africa and the USA, different results. Acta Commercii 11(1):147-170. [ Links ]
DE WET JHV & HALL JH. 2006. An analysis of strategic performance measures of companies listed on the JSE Securities Exchange South Africa. South African Journal of Economic and Management Studies 9:57-71. [ Links ]
DIAKOMIHALIS MN. 2012. The accuracy of Altman's models in predicting hotel bankruptcy. International Journal of Accounting and Financial Reporting 2:96-113 [ Links ]
DIMITROPOULOS PE & ASTERIOU D. 2009. The value relevance of financial statements and their impact on stock prices: evidence from Greece. Managerial Auditing Journal 24:248-265. [ Links ]
DOYLE P. 1994. Setting business objectives and measuring performance. European Management Journal 12:123-132. [ Links ]
FULMER JG, MOON JE, GAVIN TA & ERWIN MJ. 1984. A bankruptcy classification model for small firms. Journal of Commercial Bank Lending 66 (11):25-37. [ Links ]
GHODRATI H & MOGHADDAM AM. 2012. A study of the accuracy of bankruptcy prediction models: Altman, Shirata, Ohlson, Zmijewsky, CA Score, Fulmer, Springate, Farajzadeh Genetic, and McKee Genetic Models for the companies of the Stock Exchange of Tehran. American Journal of Scientific Research 59:55-67. [ Links ]
GRICE JS & INGRAM RW. 2001. Tests of the generalizability of Altman's bankruptcy prediction model. Journal of Business Research 54:53-61. [ Links ]
HOWELL D. 2002. Statistical methods for psychology. 5th ed. Pacific Grove, CA: Duxbury. [ Links ]
JOHNSON R & SOENEN L. 2003. Indicators of successful companies. European Management Journal 21 (3):364-369. [ Links ]
KASSER T, COHN S, KANNER AD & RYAN RM. 2007. Some costs of American corporate capitalism: a psychological exploration of value and goal conflicts. Psychological Inquiry: An International Journal for the Advancement of Psychological Theory 18 (1):1-22. [ Links ]
KELLER G & WARRACK B. 2003. Statistics for management and economics. London, UK: Thomson Learning. [ Links ]
KERNERMAN L & SMITH W. 2011. English dictionary for South Africa. Cape Town: Pharos Dictionaries. [ Links ]
KIDANE HW. 2004. Predicting financial distress in IT and service companies in South Africa. Bloemfontein: University of the Free State. (MCom-thesis. [ Links ])
LEVENE H. 1960. Robust tests for equality of variances. In OLKIN I, GHURYE SG, HOEFFDING W, MADOW WG & MANN HB (eds). Contributions to probability and statistics: essays in honor of Harold Hotelling. California: Stanford University Press. pp. 278-292. [ Links ]
LEVIN J & MILGROM P. 2004. Consumer theory: Stanford University lecture notes. [Internet: www.stanford.edu/~jdlevin/Econ%20202/Consumer%20Theory.pdf; downloaded 2013-03-17. [ Links ]]
MAZABA MI. 2010. Using Altman's Z-score to assess the appropriateness of management's use of the going concern assumption in the preparation of financial statements. Cape Town: University of Cape Town. (MCom-thesis. [ Links ])
MCGREGOR BFA. No date. Financial statements. [Internet: http://research.mcgregorbfa.com/CompanySearchDefault.aspx?Token=Ne55D1JFAaYITzNVYzUxA%3d%3d&ClientID=1450&ReturnURL=%2fStation%2fFinancialStatements%2fFinancialStatementsDefault.aspx; downloaded 2013-05-20. [ Links ]]
MCKEE TE & LENSBERG T. 2002. Genetic programming and rough sets: a hybrid approach to bankruptcy classification. European Journal of Operational Research 138:436-451. [ Links ]
MOSLEY L & SINGER DA. 2009. The global financial crisis: lessons and opportunities for international political economy. International Interactions 35:420-429. [ Links ]
OHLSON JA. 1980. Financial ratios and the probabilistic prediction of bankruptcy. Journal of Accounting Research 18 (1):109-131. [ Links ]
RAY S. 2011. Assessing corporate financial distress in automobile industry of India: an application of Altman's model. Research Journal of Finance and Accounting 2:155-168. [ Links ]
SHAPIRO SS & WILK MB. 1965. An analysis of variance test for normality (complete samples). Biometrika 52 (3-4):591-611. [ Links ]
SPULBER DF. 2009. The theory of the firm: microeconomics with endogenous entrepreneurs, firms, markets and organisations. New York, NY: Cambridge University Press. [ Links ]
TWENTY THIRD FLOOR. 2008. Don't use the Z-score to manage a turnaround. [Internet: twentythirdfloor.co.za/blog_files/wp-content/uploads/2008/08/dont-use-altman-z-for-managing-a-turnaround.pdf; downloaded: 2012-11-16. [ Links ]]
WOLINSKY J. 2011. EBITDA: Warren Buffet versus everyone else. [Internet: www.gurufocus.com/news/121085/editda-warren-buffet-versus-everyone-else; downloaded: 2013-03-17. [ Links ]]

