


Serviços Personalizados
Artigo
 Inglês (pdf)
 Artigo em XML
 Referências do artigo
Indicadores

Links relacionados
-
 Citado por Google
 -
 Similares em Google
Compartilhar

 Permalink
Journal of Contemporary Management
versão On-line ISSN 1815-7440
JCMAN vol.10 no.1 Meyerton 2013
RESEARCH ARTICLES
Factors impacting flyers as an effective promotional tool
S Perks
Nelson Mandela Metropolitan University
ABSTRACT
Flyer marketing can be accomplished with a limited budget and without reliance on design specialists. In the competitive businesses environment of today many businesses has resorted to using mobile or internet marketing. However, consumers are still bombarded with flyers at robots, as inserts in newspapers or in their mailboxes which implies the extent of its use as a promotional tool. The primary objective of the paper is to explore the factors impacting flyers as an effective promotional tool. A quantitative research approach was followed. A non-probability sample of 350 respondents was surveyed in the Nelson Mandela Metropole using self-administered questionnaires. An exploratory factor analysis revealed nine factors impacting flyers as an effective promotional tool. The perceptions of consumers are positive regarding flyers as an effective promotional tool. It was further found that flyers should be used in addition to other marketing communication tools. The analysis of variance results revealed nineteen significant relationships between the demographical variables and the identified factors. It was found that businesses should take note of the impact of demographic variables when determining the intended flyer target market, when designing the message, the information it should contain, the corporate image it wishes to portray and when appointing flyer distributors
Key phrases: consumers, flyers, marketing communication, promotional tool, retailers
1 INTRODUCTION
Survival in today's economic climate and competitive retail environment requires more than just low prices and innovative products (Grewal, Levy & Kumar 2009:1). With the growth of internet and social media, sales promotions play an important role in marketing communication. One of the most well-known, affordable and globally used methods of sales promotion today is flyers (Van Heerde & Bijmolt 2005:443).
From 1994, door to door promotional flyers have been the fastest growing media with 96% of consumers admitting that they have receive flyers and 76% admitting to acting on a promotional flyer in their letter box (Gurler Marketing n.d.: Internet). This is the reason why many businesses spend large sums of money on promotional marketing and on flyers in particular (Gázquez-Abad & Sánchez-Pérez 2009:3).
Organised retailers commonly use flyers to communicate with the customers (Katole 2012:174). It is a highly versatile marketing tool for any new or growing business, or any kind of business or project that need to create product awareness (Peters 2006:111). The more intense business competition, the more retailers will use flyers in accessible locations with a high propensity to respond (Lamb, Hair, McDaniel, Boshof & Terblanche 2004:355). Furthermore, some retailers place flyers with discounted prices at the entrance of a shop to encourage customers to purchase products which has proven to increase retail sales (Burton, Lichtenstein & Netemeyer 1999:14).
The primary purpose of businesses distributing flyers is to enhance overall store traffic, sales and promote the image of the business (Alarcon 2008:Internet). It can reach consumers in an explicit geographical location as well as create rapid awareness of a business and its products and services (Prendergast & Yuen 2005:124). Kelly (2009:153) however, warned that flyers should only be used on occasion in order to market a grand opening, event or promotion.
2 PROBLEM STATEMENT
In a study done by Miranda and Kónya (2007:9), the need for research on store flyer decisions and composition was indicated. However, with the increase in digital technology and mobile marketing, few articles in the last five years have been written on flyers as a promotional tool. The general public has a very low expectation of flyers (Gregory 2003:68). Many people regard it as useless and discard it (Schell & Tyson 2008:196) or accept it only to assist the distributor to complete their job as quickly as possible (Prendergast & Yuen 2005:124).
Another reason given by people not accepting flyers is that when distributed in peak hours, they do not have time to stop (Prendergast & Yuen 2005:124). The response rate may be low (about one to two per cent) but are considerably cost effective (Marketing minefield 2013:Internet). Unfortunately it is very difficult to get feedback from consumers on flyers to determine the success rate (Kilkenny 2006:155).
Flyers can be effectively used to remind customers about the business, products or services (Burton et al. 1999:14). According to Maghirang (2009:Internet), small businesses should not underestimate the effectiveness of flyers as a promotional tool for products and services as it creates public awareness. This awareness can trigger customers' needs and leads to business sales.
With increasing clutter as competing businesses scramble for unoccupied advertising space, it is important to understand consumer perceptions and how paying attention to the design and distribution requirements of flyers can assist in being an effective promotional tool (Prendergast & Yuen 2005:124).
This has led to the research in question: Can flyers be used as an effective promotional tool? The results of this study can indicate whether flyers can still be used today as a promotional tool. The results will indicate which factors to pay attention to when designing and distributing flyers to ensure it being an effective promotional tool.
3 OBJECTIVES
The primary objective of the study is to investigate if and how flyers can be used as a promotional tool. The secondary objectives of the study are to:
• Conduct a literature study on flyers as an effective promotional tool.
• Empirically identify the factors that impact the effectiveness of flyers as a promotional tool.
• Empirically explore whether there is a relationship between the factors that impact the effectiveness of flyers as a promotional tool.
• Empirically determine whether there is a relationship between the demographic variables and the factors impacting the effectiveness of flyers as a promotional tool.
• Provide guidelines on how flyers can be used effectively as a promotional tool.
4 HYPOTHESES
Various null-hypotheses were formulated to investigate the relationship between the independent (classification data) and dependent variables (perceptions regarding flyers). The following null-hypotheses were formulated and tested:
• H01 to H02: There is no relationship between the perceptions of flyers and demographical variables of respondents such as educational level and income.
• H03 to H08: There is no relationship between the distributor of a flyer and demographical variables of respondents such as gender, home language, age, education level, number of years employed and employment status of respondents.
• H09: There is no relationship between the information required in a flyer and respondents' number of years employed.
• H010 to H011: There is no relationship between the flyer acceptance conditions and demographic variables of respondents such as gender and age.
• H012 to H013: There is no relationship between the flyer message design specifications and demographic variables of respondents such as occupation and number of years employed.
• H014 to H018: There is no relationship between the corporate image expectations of a flyer and demographic variables of respondents such as home language, educational level, income, number of years employed and occupation.
• H019: There is no relationship between the distribution criteria expected and respondents' educational level.
5 THEORETIAL OVERVIEW OF FLYERS AS PROMOTIONAL TOOLS
5.1 Definition
Various terms can be used to describe a flyer, namely a catalogue, free sheet, circular, leaflets and a handbill (Gázquez-Abad & Sánchez-Pérez 2009:3). Heath (2005:603) describes a flyer as a communication tool or tactic using direct media and mass distribution other than newspapers, magazines, radio and television.
5.2 Flyers as promotional tools
Any product- and service business can use a flyer as a promotional tool, even non-profit businesses (Adkins 1994:4). Hoggart, Shank and Barksdale (2009:419) indicated that flyers can be used to transfer information to: announce activities of a business; inform people on how to register for activities, if needed; inform people about the existence of a product or service; inform people about the benefits of using the product or service; and announce a sale or promotion. Flyers are also used for events planning e.g. local bands, singers and DJs (Volinchak 2003:29).
5.3 Ensuring effectiveness of flyers
George (2005:353) recommended that marketers must take into consideration their target audience, number of copies distributed, lifespan of the flyer and distribution method for effective flyer marketing. The location selected for distribution is important to ensure success (Prendergast & Yuen 2005:125). Wilson (2010:Internet) advised that flyers must spark the customers' curiosity; the tone of the flyer must confer with the attitude and values of the business and must ignite a response from customers. The business must plan what they want to achieve with the flyer distribution, being awareness of a product or service, promotional offer or about the existence of the business. The business must be aware of what and how their competitors' use flyer advertising as this can assist them in improving their flyers (Barr 2010:Internet). The success rate of flyers can be increased by attaching samples of the product or involvement devices to it (Reed 2006:24).
5.4 Design requirements of flyers
Stenning (2009:Internet) asserted that effective flyer marketing requires a well-constructed flyer to improve the chances of new business development, maintain existing business and promote a positive image of the business (Ali 2003:133). McLuhan (2003:25) urges businesses to design flyers that are informative, solicit involvement and are relevant to the brand advertised. It must also inspire conviction that the product or service is really worth buying, will provide satisfaction and mention the price (Lamb et al. 2004:330). Reed (2006:23) confirmed that from the time a flyer is received it only has a few seconds to grab the attention of the reader. For this reason, Kartel (2009:1) suggests a fairly large catchy headline to attract readers' attention. Marsh, O'Connor and Tshivashe (2007:28) specified that a flyer must point out the competitive advantage and unique benefits associated with the product or service.
According to Keirle (2002:86), attention should be paid to the structure, size and quality of paper used. The flyer must be printed using good quality photographs or images with a stunning visual, in an appropriate size and texts without appearing cluttered (Debelak 2000:110). Balance in terms of space to text, images and white space to lead the target readers' eyes to the most vital part, is an important consideration when designing the flyer (Gurria 2007:223). Bullets and power words such as avoid, free, bargain, earn, special or win can ensure that consumers pay attention to the content of a flyer (Gerber & Du Plessis 2009:282).
Corporate image in terms of logo, name and contact details, business hours and a location map of the business and highlighting the major benefits of the product, store or service, may prompt consumers to take note and buy the products or services advertised (Barr 2010:Internet). To determine the response rate a contact person, email address or replied paid response card must be supplied (Hesketh & Laidlaw 2010:250). If it is a promotion, it is important to specify the expiry date of the special offer (Miranda & Kónya 2007:2). A flyer for a service business is challenging as a customer experience is called for and therefore should include a story to capture the attention of the intended target market (Sullivan 2004:111).
5.5 Distribution requirements of flyers
Arto (2000:22-23) confirmed that prior to distribution, it is important to establish which needs must be accomplished, what information needs to be communicated (how, what, when, where, why and who) and how will the reader respond (call, register, write or attend). Therefore the business must know its target market and has a defined objective in mind (Hingston 2001:106). Various distribution methods exist for flyers such as (Gázquez-Abad & Sánchez-Pérez 2009:3; Govoni 2004:89; Gurria 2007:227; Harold 2002:52; Kilkenny 2006:155; Noble 2007:107; Purcell 2010: Internet; Stan 2010:153; Thomas & Housden 2002:140; Whitebread 2009:148-149): solus distribution; shared distribution; inserted in a newspaper or a magazine; in public areas; posting on bulletin or notice boards; and at entrance in retail stores. Strategic distribution can be used successfully when distributing flyers in a high-cost housing neighbourhood to reach affluent customers (Stan 2010:154).
The norm is to distribute flyers in high pedestrian places during peak hours (Prendergast & Yuen 2005:124). Flyers should be distributed periodically e.g. daily, weekly or monthly to potential customers to ensure maximum exposure to the flyer (Alarcon 2008:Internet). Schermerhorn (2008:Internet) confirmed that one-time promotional efforts usually does not achieve the desired outcome and suggested distributing flyers at least eight times to get noticed. Distributors must be knowledgeable of what they are marketing and need to be polite, enthusiastic and appropriately dressed (Flyer distributor 2009:Internet), preferably in a low cost branded uniform to add credibility (Link Communication 2013:Internet). According to Lamb et al. (2004:335), the retention of the information conveyed in a flyer peaks somewhere between the third and fifth message received which is advantageous as a reader can pick it up a week later to continue reading it or pass it on to someone else to read.
6 IMPACT OF DEMOGRAPHIC VARIABLES ON FLYER MARKETING
For any marketing strategy to work it must be designed with a clear understanding of the demographics of its audience (Duron 2013:1). Various authors found a link between the impact of demographics such as gender, age, income and number of members in a family on flyer marketing. FitzGerald and Arnott (2000:31) found that the use of female-orientated advertisements create a positive effect among women while men will only respond to masculine-gender brands with women buying about 80% of products and services. Gijsbrechts, Campo and Goossens (2003:12) found that older consumers, families with lower income, no infants or toddlers or single households react more positively to flyers advertising discount.
Darley and Smith (1995:41) pointed out that men and women process advertising messages differently, with females being more sensitive to product risk. Dhar and Rossi (2004:Internet) reported that higher income consumers to be more likely to use flyers to save time while older consumers are more price sensitive. Marks (2011:Internet) found that affluent customers expect flyers to be printed on high quality paper and projecting a professional image distributed where they gather. Lines (2007:Internet) blamed the media for focusing mostly marketing to younger age groups and urged businesses to target the 50 plus age market.
7 METHODOLOGY
The positivistic or quantitative research method is used in this study, whereby the emphasis is on the quantification of variables and statistical controls. The main approaches followed are exploratory and descriptive research aimed at exploring and describing the factors impacting the effectiveness of flyers as a promotional tool. Secondary data was collected by means of an extensive literature study which included text books, journal articles and the Internet.
For the purpose of this research project, the target population consists of all consumers in the Nelson Mandela Metropole. A non-probability sampling technique (convenience sampling) was used. Primary data was collected by means of a survey by distributing a self-administered questionnaire in various areas within the Nelson Mandela Metropole. A total of 400 questionnaires were distributed by fieldworkers.
The final sample size was 350, giving an 87.5% response rate. The questionnaire consists of two sections:
• Section A comprises of 57 statements regarding the perceptions of respondents on the factors impacting the effectiveness of flyers as a promotional tool. The type of ordinal scale used is by means of semantic differential scaled-response questions according to a five-point Likert-type scale (ranging from strongly agree to strongly disagree).
• Section B provides classification data (demographic characteristics) of respondents and contains a nominal scale of measurement, using categorical variables. Eight classification data variables were tested, namely: age, gender, home language, highest educational level, monthly income, occupation, number of years employed and employment status.
As the questionnaire has never been used previously, it was distributed to 20 respondents in Nelson Mandela Metropole (convenient sample). The questionnaire was also given to a few academics in the field of business management. Some problem areas were identified and suggestions for improvement were provided which ensure face validity of the questionnaire.
Completed questionnaires were inspected, edited, coded and data transferred to an Excel spreadsheet. The results were processed and analysed by means of the Statistica 10 package. The statistical process comprised of the following phases, namely:
• Demographic profile of respondents.
• Exploratory factor analysis to extract the factors and to assess the validity of the measuring instrument. Items that did not load to a significant extent (loadings > 0.30) and on a unique factor were deleted.
• Cronbach's alpha reliability coefficients to verify the consistency of the inter-item reliability of the research instrument.
• Correlation analysis to determine the inter-item correlations between the items in the factors.
• Analysis of variance to investigate the relationship between the independent (factors impacting flyer effectiveness) and dependent demographical variables and to test the stated hypotheses.
• Descriptive statistics to indicate the mean scores and standard variation of the factors.
8 RESULTS
8.1 Results of the demographical data
Table 1 highlights the results of the demographical data.
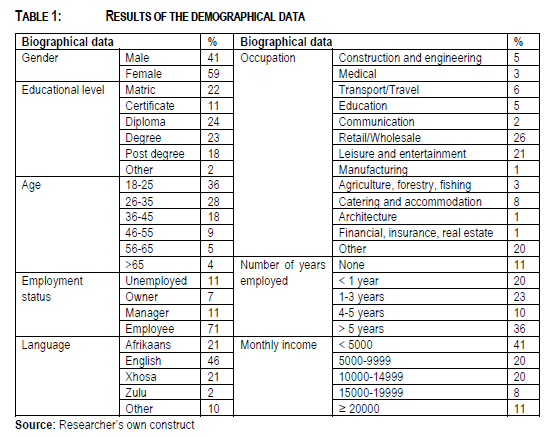
More males than females participated in the survey with most respondents English speaking. It must be noted that in South Africa there are 11 official languages, which reflects in the other category. As 11% surveyed were students, they were unemployed with no working experience and having income (pocket money) of less than R5 000 per month. Most respondents earn between R5 000 and R14 999, with a few (11%) earning R20 000 or more. Forty one per cent of the respondents had a degree or post degree with only 22% having at least matric. Over a third of the respondents were between 18 to 25 years of age with 18% older than 46 years old. Most of the respondents were either employed in the retail/wholesale or in the leisure and entertainment sector. Nearly half (46%) of the sample had four years or more working experience. The majority of respondents were employees, with a few managers or owners surveyed.
8.2 Results of time, frequency and place of distribution
Respondents could provide more than one response which time they receive most flyers. Most flyers are distributed week days (f = 186). This could be contributed to the fact that the working class was targeted, probably on their way to their workplace. To a much lesser extent are flyers distributed on weekends (f = 66), end of the month (f = 44) or public holidays (f = 11). Table 2 depicts where flyers are mostly received by respondents.
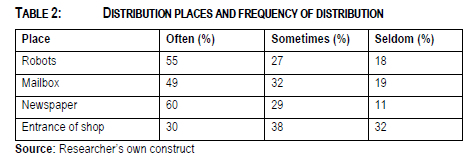
Respondents often received flyers as an insert in newspapers, at robots or to a lesser extent in their mail box. The results of the robots tie in with the fact that respondents received flyers mostly on weekdays. It seems they are targeted at robots on their way to work. Only 30% of the respondents receive often flyers at the entrance of the shops. It must be noted that some respondents sometimes or seldom receive flyers at robots, in their mail box, as newspaper inserts or at the entrance of the shop. This could point to being students not having a mail box, not buying newspapers or consumers in the low income group which do not travel where the flyers are distributed or buying newspapers.
Table 3 shows which information could be conveyed successfully using flyers. Respondents could provide more than one response for this question. The ranking was based on the highest frequency of the results of the information that could be conveyed via flyers.
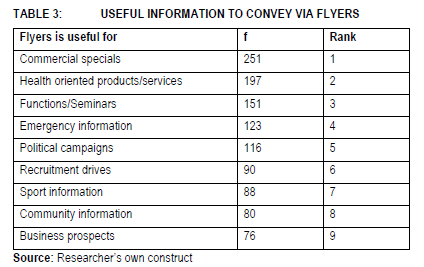
Table 3 shows that respondents regard flyers most useful for commercial specials, health products/services and to advertise functions or seminars and less suitable to convey information about business prospects, community or sport information. It can also be used for emergency information, political campaigns and recruitment drives.
8.3 Results of the exploratory factor analysis
The principle component factor model using the normal varimax rotation was used to extract the factors and to foster interpretability by maximising factor loadings close to 1.0 and minimising factor loadings close to 0 (Albright & Park 2009:Internet). All factors not loading to 0.3, the cut-off point for significant loading associated with a sample size of 350 and above, were deleted and excluded from further analysis (Al Muala 2011:22). Table 4 shows the results of the exploratory factor analysis to determine the validity of the measuring instrument.
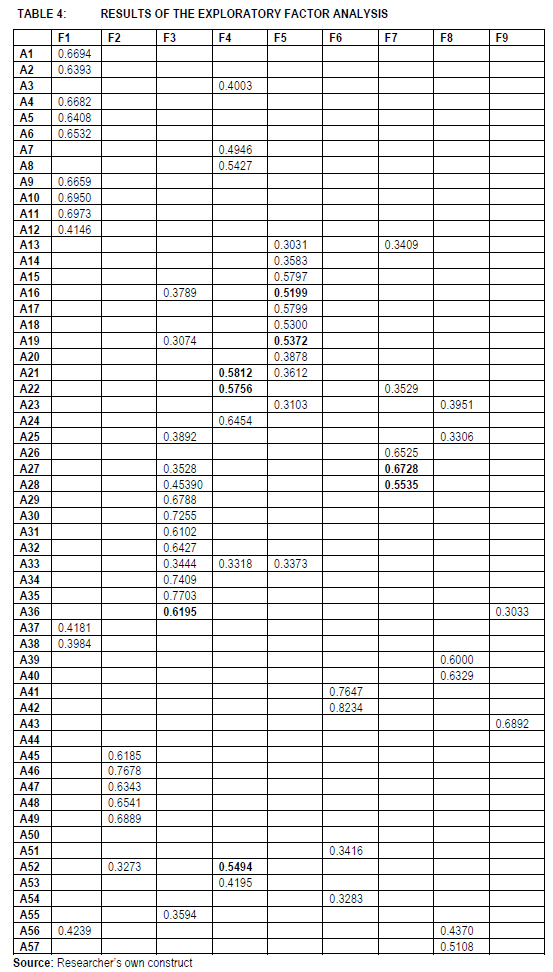
As can be seen in Table 5, a total of nine factors were extracted with Factor 9 being eliminated from further analysis as only two items were valid. According to Costello and Osborne (2005:Internet) a factor is weak and unstable if less than three items are retained. Statswiki (2012:Internet) stated that if cross loadings exist then it should differ by more than 0.2. If items had cross-loadings, only the item with a loading of 0.5 or above was considered to increase the validity of the measuring instrument. This also contributes toward ensuring convergent validity. Items 13, 23, 25, 33 and 56 were thus deleted from further analysis. Items 44 and 50 did not load onto any of the nine factors.
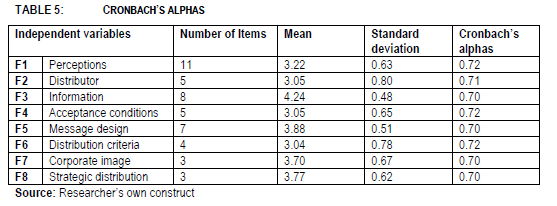
8.4 Results of the Cronbach's alphas
Table 5 indicates the results of the Cronbach's Alphas. Values close to 1 is desirable (Gunawin 2012:Internet).
The Cronbach's alpha for the measuring instrument was 0.75 indicating it was a reliable measuring instrument. All Cronbach's alpha values are 0.7, or exceed it, therefore indicating internal inter-item reliability of all eight identified factors.
Respondents are on average neutral regarding their perceptions of flyers as a promotional tool, whether the distributor must appeal to them, whether the flyer must meet their acceptance conditions or distribution criteria to ensure flyers' success. However, respondents tend to agree that for flyers to be effective the right flyer information, message design, corporate image portrayed and strategic distribution is important. There is not much variation in responses regarding the impact of these factors on the effectiveness of flyers as a promotion tool.
8.5 Results of correlation
An inter-item correlation exercise conducted to determine the correlation between the variables constituting each factor is shown in Table 6.
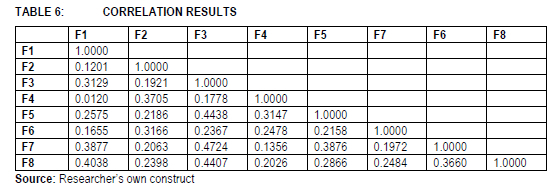
As can be seen in Table 6, all relationships are positive with most rather weak. Only factor three (information) had moderate relationships with message design (F5), corporate image (F7) and strategic distribution (F8). The information contained in the flyers thus correlate moderately with the message design and the corporate image it wishes to portray as well as the intended purpose and where and to whom it should be distributed.
8.6 Results of ANOVA
Table 7 only reports those ANOVA results that show significant relationships between the independent and dependent variables and those that exhibit no significant relationships are excluded.
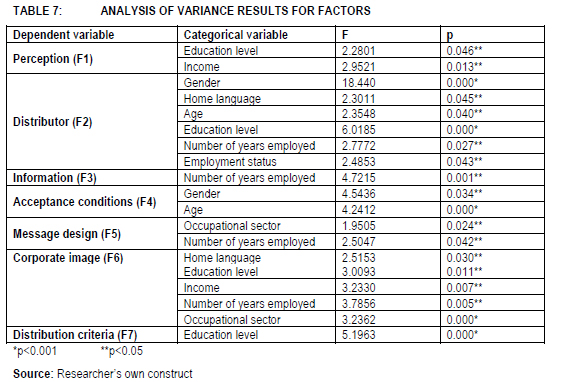
The ANOVA results clearly indicate that Hypothesis 1 to Hypothesis 19 can, in all cases, be rejected and the alternative hypotheses (H1 to H19) can be accepted. Hypothesis 1 to Hypothesis 19 fall within the rejection region (p < 0.001 and p < 0.05) which indicates that there is a significant or highly significant relationship (difference) between the perceptions of respondents regarding the factors impacting flyers as a promotional tool.
9 CONCLUSIONS AND RECOMMENDATIONS
The following conclusions and recommendations are based on the analysis of variance between the independent variables (classification data) and dependent variables (factors impacting effective flyer distribution):
• There appears to be a significant relationship between the perceptions of respondents on flyers as a promotional tool and their educational level (H01 rejected). Less educated consumers seems to regard flyers as having useful and credible information and handy to keep till needed. They are also prompted to enquire or buy the products or services advertised or visit the store to view the advertised products and service. More educated consumers tend to prefer to receive flyers at robots or in their mail boxes which prompt their decision to make enquiries, buy or visit the store. Businesses should ensure they identify their target market when distributing flyers e.g. more educated working class at robots on their way to work. However, more educated consumers may receive notifications of promotions electronically and may decline the offering of printed flyers. This could also be the reason for the differences in perception of respondents of flyers as a promotional tool based on income levels (H02 rejected). The more affluent consumers may only respond favourably to electronic promotions or when presented with flyers at places which they frequent and not to flyers distributed at robots or in their mail boxes. The results clearly indicated that respondents agreed that flyers can be used as a promotional tool. However, to ensure effective distribution to the right target market it is suggested to use free newspapers that could target in particular the lower income groups for everyday consumption products. Alternatively inserts in paid-for newspapers for products and services that are less frequently bought could be used to target the more affluent customers.
• There seems to be a significant relationship between how respondents view the flyer distributor based on their gender, home language, age, educational level, number of years employed and employment status (H03 to H08 rejected). Male consumers may rather accept flyers from attractive, friendly or neatly dressed female distributors and vice versa. The relationship between how respondents view the distributor of the flyer based on home language is not clear. It may be linked to race e.g. with a black distributor distributing flyers written in an African language or a white distributor if written in English. Children may also urge their parents to accept flyers, especially when the distributor is dressed in a funny costume while adults regard distributors dressed in the T-shirt of the business as more credible. The latter could also apply to those with higher educational levels, many years working experience and higher occupational status. It is suggested that the distributor reflects the target market aimed at and dressed according to the image the business wants to portray e.g. being credible or funny.
• There seems to be a significant relationship between the type of flyer information required by respondents based on their number of years employed (H09 rejected). It seems that consumers with more working experience will pay attention to product details e.g. price, features, business address, as well as contact person or web address. The product information must fit the target market's working experience as they become more knowledgeable to scan for specific information and ascertain whether it is reputable.
• There appears to be a significant relationship between the flyer acceptance conditions of respondents based on their gender and age (H010 to H011 rejected). It seems that older consumers prefer flyers linked to receiving a benefit, advertising specials or price reductions with the special price indicated in bold, or accompanied by a freebie as they are probably retired and price sensitive. As females are shopping more than males, they may be more likely to respond positively to flyers, especially if targeting females specifically. Children or younger consumers most likely accept flyers if colourful and printed in capital letters to attract their attention. It is suggested that if targeting retirees some benefits are attached to taking up the flyer invitation. Flyer distributors should rather target females, however, the flyer message must be gender orientated e.g. females with a feminine emotionally charge message or having a masculine appearance by using a font that appeals to males.
• There appears to be a significant relationship between the views of respondents on flyer message design based on their number of years employed and employment status (H012 to H013 rejected). The more working experience consumers have and the higher their employment status, the more likely they will pay attention to an eye catching flyer headline if printed on one side, on good quality paper and not folded. The less working experience consumers have and the lower their employment status, the more likely they require that flyers contain both text and pictures and is addressed to them e.g. "The householder".
• There seems to be a significant relationship between the expectations of respondents on the corporate image that should be portrayed by flyers based on their home language, educational levels, income, number of years employed and occupation (H014 to H018 rejected). Consumers with higher educational and income levels, more working experience and employment status may expect that flyers provide a brief business overview, clearly stating their main services and benefits of the service, to judge if worthwhile pursuing the service offering and to evaluate if it is a credible business. The link between home language and expectations of the corporate image portrayed by flyers may lessen if a consumer is illiterate or cannot read the flyer message language. It is recommended that the flyer content indicate the business offering, years in operation or success rate as well as indicating how the consumer can benefit from using the service.
• There appears to be a significant relationship between the flyer distribution criteria expected by respondents based on their educational levels (H019 rejected). If a flyer targets certain suburbs, the educational level of these customers should be considered e.g. in poor communities they are likely to have a low income and educational level. Consumers with higher educational levels seem to notice flyers only if distributed more than once within a given time period and at two distribution points e.g. at robots and in free news papers as was confirmed in literature.
Based on these above conclusions and recommendations, it is clear that flyers can be used as an effective promotional tool. However, some factors need to be taken into consideration when planning flyer distribution. The limitations of this paper are next acknowledged and future research areas worth exploring are indicated.
10 LIMITATIONS AND FUTURE AREAS OF RESEARCH
It is important to take note of the following limitations of this paper when concluding the findings:
• Survey responses came mostly from respondents in the retail/wholesale and leisure and entertainment sector, speaking a non-African language. This suggests that the survey be replicated to African language speaking respondents to determine if the identified factors are similar for the African target market.
• The factors identified needs to be further tested in a model to link to flyer effectiveness. The sample should be expanded to include other provinces in South Africa.
• The measuring instrument was quantitative in nature. It is suggested that a qualitative study amongst all gender, races, income groups and educational levels be conducted. This will ensure that the findings of this paper are either further validated or contradicted and ensure richer data.
In spite of the above limitations, this study has made a positive research contribution to an area that seems to be neglected as a research area due to the rise in mobile and internet marketing. Flyers are still today used extensively and can be an important promotion tool for a new or small business to create awareness of or remind consumers about the business and its offerings. The cost effectiveness of flyers negates the disadvantage of the not being able to ascertain the exact response rate.
11 GUIDELINES FOR EFFECTIVE FLYER DISTRIBUTION
Table 8 suggests some guidelines to businesses for the effective distribution of flyers.
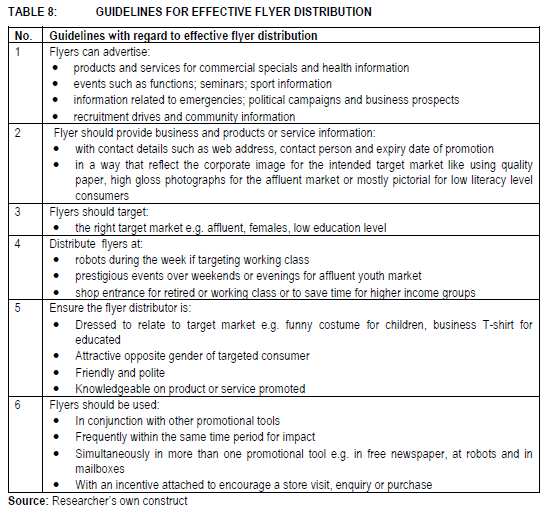
This paper confirms that flyers can still be used in the digital era. However, it should be used in conjunction with other promotional tools. Using social media and internet to distribute flyers can effectively target many consumers but cannot replace traditional distribution points such as at robots, in mail boxes or as inserts in free newspapers. In the poorer income areas, printed flyers, especially at the entrance of shops will still be the most cost effective form of promotion. The importance of paying attention to demographical factors when designing flyers should not be underestimated.
REFERENCES
ADKINS V. 1994. Creating brochures and booklets: a hands-on guide to planning, designing and producing every kind of project. Ohio: North Light. [ Links ]
ALARCON GY. 2008. The influence of store flyer composition: How store flyer characteristics affect catalogue retailers store performance. [Internet: http://arno.unimaas.nl/show.cgi?fid=11123; downloaded on 2013-06-22. [ Links ]]
ALBRIGHT JJ & PARK HM. 2009. Confirmatory factor analysis using AMOS, LISREL, MPLM, SAS/STAT CALLS. [Internet: http://www.indiana.edu/-statmath/stat/all/cfa/index.html; downloaded on 2013-01-21. [ Links ]]
ALI M. 2003. Practical marketing and public relations for the small business. 2nd edition. London: Kogan Page. [ Links ]
AL MUALA A. 2011. Determinant factors of tourists satisfaction in Muslim's countries: A structural equation model (SEM). American Academic and Scholarly Research Journal 1(1):21-28. [ Links ]
ARTO AM. 2000. Designing eye-catching flyers. Florida: Pasco-Hernando Community College. [ Links ]
HOGGART J, SHANK J & BARKSDALE K. 2009. Century 21 Jr: input technologies and computer applications. 2nd edition. Mason: South Western Cengage Learning. [ Links ]
BARR C. 2010. Flyer printing - the ultimate guide to flyer and print advertising. [Internet: http://ezinearticles.com/?Flyer-Printing-The-Ultimate-Guide-to-Flyers-and-Print-Advertising&id=4221005; downloaded on 2012-09-07. [ Links ]]
BURTON S, LICHTENSTEIN DR & NETEMEYER RG. 1999. Exposure to sales flyers and increased purchases in retail supermarkets. Journal of Advertising Research 39(5):7-14. [ Links ]
COSTELLO AB & OSBORNE JW. 2005. Best practices in exploratory factor analysis: Four recommendations for getting the most from your analysis. [Internet: http://pareonline.net/pdf/v10n7.pdf; downloaded on 2012-11-29. [ Links ]]
DARLEY WK & SMITH RE. 1995. Gender differences in information processing strategies: An empirical test of the selectivity model in advertising response. Journal of Advertising 24(1):41-56. [ Links ]
DEBELAK D. 2000. Streetwise marketing plan. Holbrook: Adams Media. [ Links ]
DHAR SK & ROSSI PE. 2004. Why responsiveness to retail promotions varies across retailers. [Internet: http://www.chicagobooth.edu/capideas/june04/retailpromotions.htm; downloaded on 2012-01-29. [ Links ]]
DURON M. 2013. Are you missing the ladies? [Internet: http://ezinearticles.com/?/Are-You-Missing-the-Ladies?id=7481787; downloaded on 2012-01-29. [ Links ]]
FITZGERALD M & ARNOTT D. 2000. Marketing communications classics: An international collection of classic and contemporary papers. London: Thompson Learning. [ Links ]
FLYER DISTRIBUTOR. 2009. [Internet: http://www.myjobsearch.com/careersflyer-distributor.html; downloaded on 2012-01-29. [ Links ]]
GÁZQUEZ-ABAD JC & SÁNCHEZ-PÉREZ M. 2009. How store flyers affect customer choice behaviour: National brands vs store brand. European Retail Research, 23(1):1-20. [ Links ]
GEORGE R. 2005. Marketing South African tourism. 3rd edition. Cape Town: Oxford University Press. [ Links ]
GERBER K & DU PLESSIS N. 2009. FCS Marketing communication L4. Cape Town: Pearson Education. [ Links ]
GIJSBRECHTS E, CAMPO K & GOOSSENS T. 2003. The impact of store flyers on store traffic and store sales: A geo-marketing approach. Journal of Retailing 79(1): 1 -16. [ Links ]
GOVONI NA. 2004. Dictionary of marketing communication. California: Sage. [ Links ]
GREGORY J. 2003. Social issues infotainment: Using emotion and entertainment to attract readers attention in social issues leaflets. Information Design Journal 11(1):67-81. [ Links ]
GREWAL D, LEVY M & KUMAR V. 2009. Customers experience management in retailing: an organizing framework. Journal of Retailing, 85(1):1-14. [ Links ]
GUNAWIN A. 2012. Information access for SME's in Indonesia: A study on the business performance of garment manufacturers. Unpublished PhD, Tilburg University. [Internet: http://arno.uvt.nl/show.cgi?fid=128273; downloaded on 2013-06-22]. [ Links ]
GURLER MARKETING. n.d. Leaflet distribution. [Internet: gurlermarketing.word press.com/leaflet-distribution/; downloaded on 2012-01-30. [ Links ]]
GURRIA E. 2007. Marketing communication. 4th edition. London: Earthscan. [ Links ]
HAROLD SA. 2002. Marketing for complementary therapists: 101 tried and tested ways to attract clients. Oxford: How to Books. [ Links ]
HEATH RL. 2005. Encyclopaedia of public relations. California: Sage. [ Links ]
HESKETH EA & LAIDLAW JM. 2010. Selling educational events to health care professionals: Twelve tips on the function and design of trigger leaflets. Medical Teacher 19(4):250-256. [ Links ]
HINGSTON P. 2001. Effective marketing: Small business guides. London: Dorling Kindersley. [ Links ]
KARTEL B. 2009. Tips on creating catchy flyers. [Internet: http://www.articlesnatch.com/Article/Tips-On-Creating-Catchy-Flyers/1568934; downloaded on 2013-01-17. [ Links ]]
KATOLE HJ. 2012. Evaluation of retailers' vs customers' views on the usage of advertising as communication tool. International Journal of Marketing Studies, 4(6):174-182. [ Links ]
KEIRLE L. 2002. Countryside recreation site management: A marketing approach. London: Routledge. [ Links ]
KILKENNY S. 2006. The concept guide to successful event planning. Ocala, Florida: Atlantic. [ Links ]
KELLY EN. 2009. Practical apartment management. 6th edition. Chicago: Institute of Real Estate Management. [ Links ]
LAMB C, HAIR J, MCDANIEL C, BOSHOF C & TERBLANCHE N. 2004. Marketing. 2nd edition. New York: Oxford. [ Links ]
LINES P. 2007. The importance of demographics in marketing. [Internet: http://www.helium.com/items/80534-the-importance-of-demographics-in-marketing; downloaded on 2013-01-29. [ Links ]]
LINK COMMUNICATION. 2013. What makes a successful leaflet distribution campaign? 2013. [Internet: http://www.linkcommunication.co.uk/article_leaflet_distribution.html; downloaded on 2013-01-29. [ Links ]]
MAGHIRANG E. 2009. The importance of brochures and flyer prints in business. [Internet: http://www.articlesbase.com/marketingarticles/the-importance-of-brochures-and-flyer-prints-in-business-1007484.html; downloaded on 2012-09-04. [ Links ]]
MARKETING MINEFIELD. 2013. Marketing with leaflets. [Internet: http://www.marketingminefield.co.uk/marketing-with-leaflets/; downloaded on 2013-01-18. [ Links ]]
MARKS K. 2011. How to use flyers to target rich markets. [Internet: http://voices.yahoo.com/how-flyers-target-rich-market-8238129.html; downloaded on 2013-01-29. [ Links ]]
MARSH R, O'CONNOR M & TSHIVASHE T. 2007. Advertising and promotions level 2. Cape Town: Pearson Education. [ Links ]
MCLUHAN M. 2003. Special report: Door-to-door: Message in a bottle. Precision Marketing 14 February, p. 25. [ Links ]
MIRANDA MJ & KÓNYA L. 2007. Directing store flyers to the appropriate audience. Journal of Retailing and Consumer Services 10(4):1-7. [ Links ]
NOBLE D. 2007. How to start a home-based professional organising business. Connecticut: Morris. [ Links ]
PETERS P. 2006. The ultimate marketing toolkit: Ads that attract customers, brochures that create buzz websites that wow. Avon: Adams Media. [ Links ]
PRENDERGAST G & YUEN SMA. 2005. Perceptions of handbills as a promotional medium: An exploratory study. Journal of Advertising Research 45(4):124-131. [ Links ]
PURCELL V. 2010. Different types of leaflet distributions. [Internet: http://ezinearticles.com/7Different-Types-of-Leaflet-Distribution&id=4865616; downloaded on 2013-01-13. [ Links ]]
REED D. 2006. Crash landing. Precision Marketing 18(26): 23-24. [ Links ]
SCHELL J & TYSON E. 2008. Small business for dummies. 3rd edition. New Jersey: Wiley. [ Links ]
SCHERMERHORN M. 2008. Improve your promotional flyers and improve sales. [Internet: http://www.marcommwise.com/article.phtml7id=895; downloaded on 2013-01-16. [ Links ]]
STAN DR. 2010. How to promote your business with little or no money. Indiana: AuthorHouse. [ Links ]
STATSWIKI. 2012. Exploratory factor analysis. [Internet: http://statwiki.kolobkreations.com/wiki/Exploratory_Factor_Analysis; downloaded on 2012-11-06. [ Links ]]
STENNING A. 2009. How to make your leaflet distribution campaigning a success. [Internet: http://www.easyarticlesubmit.com/Article/How-To-Make-Your-Leaflet-Distribution-Campaign-ASuccess/199795; downloaded on 2013-01-21. [ Links ]]
SULLIVAN J. 2004. Brochures: Making a strong impression, 85 strategies for message-driven design. Beverly, Massachusetts: Rockport. [ Links ]
THOMAS B & HOUSDEN M. 2002. Direct marketing in practice. Oxford: Butterworth-Heinemann. [ Links ]
VAN HEERDE HJ & BIJMOLT THA. 2005. Decomposing the promotional revenue bump for loyalty program members versus nonmembers. Journal of Marketing Research 42(4):443-457. [ Links ]
VOLINCHAK T. 2003. Make money with your studio: Setting up and operating a successful recording. Victoria: Hal Leonard Corporation. [ Links ]
WHITEBREAD D. 2009. The design manual. Sydney: UNSW Press Book. [ Links ]
WILSON R. 2010. My reference on requirements for flyers. [Internet: http://ezinearticles.com/?Flyer-Replenishing-your-company-status&id=5001720; downloaded on 2013-01-12. [ Links ]]

