


Serviços Personalizados
Artigo
 Inglês (pdf)
 Artigo em XML
 Referências do artigo
Indicadores

Links relacionados
-
 Citado por Google
 -
 Similares em Google
Compartilhar

 Permalink
Journal of Contemporary Management
versão On-line ISSN 1815-7440
JCMAN vol.9 no.1 Meyerton 2012
RESEARCH ARTICLES
Resident satisfaction as a project quality measure: the case of Nova Vida Housing Project, Angola
T Lara; M C Bekker
University of Pretoria
ABSTRACT
Towards the end of the 1975-2002 civil war, Luanda, the capital of Angola, experienced unprecedented urban growth. The pressure to reduce the housing backlog gave rise to large scale governmental residential development initiatives such as the Nova Vida housing project. Although the project experienced minor cost and schedule overruns the key question remains as to whether or not the project met the desired quality parameters in terms of resident satisfaction. As part of overall project quality performance measurement and continuous improvement cycle procedures, a post-project evaluation was done to investigate the level of satisfaction of the Nova Vida residents with their homes. A questionnaire was distributed among the Nova Vida residents measuring four factors namely (i) house design and architecture, (ii) house functionality, (iii) accessibility, and (iv) neighbourhood and community amenities. From the results it was possible to assess that the main concerns related to design, planning and urban management of infrastructure, public services and utilities. In general dissatisfaction is significantly higher for apartment residents than for house residents. The objective of providing safe, practical and comfortable living space was achieved. The results provided insight into the experiences of the Nova Vida occupants and are valuable input towards improving the planning, design and quality of future government housing projects.
Key phrases: post project evaluation, project quality measurement, public housing, residential satisfaction.
1. INTRODUCTION
After the civil war that took place between 1975 and 2002, Angola experienced a massive pent-up demand for urban growth and development accompanied by a major housing backlog, especially in the capital Luanda (Cain 2007:362). In order to address the housing shortage the Government launched Nova Vida, the first post-independence, large scale housing project (EMPA: 2010:11-13).
Nova Vida, meaning "New Life" in Portuguese, is located approximately 18 kilometres south of the capital Luanda's airport. The site covers an area of approximately 450 hectares with the actual buildings covering and area of approximately 250 000 square metres. Started in 2001 and completed in 2005, the project had an estimated capital value of USD 135 million (Engineering News 2006). It could be argued that urban projects involve the essence of human living and should take into account the economic, social, and cultural characteristics of the specific location and community. For housing projects quality should be considered beyond workmanship, with overall resident satisfaction (RS) a key success parameter. Unfortunately the assessment of RS is often not considered as a direct project deliverable resulting in valuable lessons learned for future projects not being captured (Bonnes, Bonaiuto & Ercolani 1991:539-541).
In order to assess the residents' satisfaction with the Nova Vida project, a post-occupancy evaluation was conducted to determine residents' experiences of their new homes. This study was aimed at addressing the following research questions:
• Research Question 1: What is the view of Nova Vida residents regarding the house design (layout) and architecture (appearance and aesthetics)?
• Research Question 2: To what extent do the house functionalities (facilities, storage space, etc.) serve the needs of the residents?
• Research Question 3: How accessible is Nova Vida to important services such as transport, education, health, consumer shopping, entertainment, churches/ temples, outdoor recreation, etc.?
• Research Question 4: What is the residents' experience regarding community and neighbourhood life?
The research objective was to inform and improve the definition of overall project quality/satisfaction parameters for future housing projects in the region. Parts of this paper were presented at the 2011 IPMA Global Congress in Brisbane, Australia and are published with permission. The paper comprises a literature review, an explanation of the research method, an analysis of the results and conclusions and recommendations.
2. LITERATURE REVIEW
Researchers have debated extensively on the notion of RS (also known as 'post-occupancy evaluation). Ogu (2002: 39) defined RS as a concept used to evaluate resident's perception of, and feelings about, their house and the environment. Wiesenfeld (1992:214) referred to the term RS in housing as a reflection of the corresponding factors between current conditions the residents live in and their initial expectations. It has been argued that satisfaction is more of an emotional component of how residents feel about the place they live (Galster & Hesser 1981:737; Mandic & Cirman 2012:779-780), while others believe it is more perception-based related to what they expect and need (Kellekci & Berkoz 2006:78-80; Ogu 2002:39; Varady & Carozza 2000:821). These views are not necessarily conflicting but rather complementary when determining overall.
According to Giuliani and Rossi (referred in Ogu 2002:39) housing quality is the result of the satisfaction level of end-users by meeting the user's requirements. Liu (2003:149) evaluated quality of projects in the housing sector through measuring the satisfaction level of occupants.
Even though the technical and engineering aspects of developing large housing programmes are fairly well established, the collaboration and coordination between designers and planners and all other stakeholders will eventually determine the overall success of the project (Al-Derham, Hibberd & Mustapha 1997:13; Al-Monami 2000:189; Bonnes, Bonaiuto & Ercolani 1991:533 and Liu 2003:156). During housing projects the final product will be occupied by residents and the verbalisation of their experience of their new living conditions can have an impact on the perceptions of the political and social responsibility of the responsible Government (Varady, Carole, Walker & Wang 2001:1274; Liu, Fellows & Tuuli 2011:177; Ozaki 2003:557; Torbica & Stroh 2001:82 and Zimmerman & Martin 2001:169). Eventually a thorough post-occupation evaluation remains very important for the built environment since it is the only way to determine to what extent the final house or apartment fulfils the user's needs, requirements and expectations (Wiesenfeld 1992: 214-215).
Assuming that the house is technically and structurally sound, the space for living, housing design and layout, outdoor space, storage space, internal finishing, exterior appearance, functionality and proximity to neighbouring houses remains critically important when determining the overall RS (Al-Monani 2000:182, Gruber and Shelton 1987:303, and Gilderbloom, Brazley and Pan 2005:22). The neighbourhood, within which the development takes place, as well as general access to services, can also have a profound impact on the value RS (Parkes, Kearns & Atkinson 2002:24152416).
To further highlight the importance of the neighbourhood environment van Kamp, Leidelmeijer, Marsman and de Hollander (2003:8-9), Murphy and Killen (2011:1269-1270), Dahlberg, Eklöf, Fredrikson and Jofre-Monseny (2012:333) as well as Galster and Hesser (1981:741) identified and listed additional items to be considered. These include the perception of safety within the immediate environment, space, public lighting, maintenance of open and green areas, density, traffic, as well as access to amenities (Giuliano, Redfearn, Agarwal & He 2012:77) as variables in the measurement RS. Further studies have also confirmed that satisfaction results are also influenced by demographic and socio-economic situation of the users. For example, it has been proven that older people are usually more satisfied about their homes than young people (Kellekci & Berkoz 2006:95 and Wagner, Shubair & Michalos 2010:406); that home owners are more satisfied than those living in apartments (Al-Monani 2000:180) and that housing ownership or tenure can affect satisfaction (Ogu 2002:49).
Measuring RS is complex. It is a dynamic process (Fancescato, Weidemann, & Anderson 1974:295) and not merely a simple, single dependent variable. Results from satisfaction surveys can lead to different readings and interpretations due to different backgrounds, past experience and personal needs of the users and, consequently, different expectations. Constructing an all-inclusive framework and eventual model for measuring RS seems to be a near impossible task. However, given the limitations of the various attempts to measure RS, the lack of robust measurement criteria does not overturn its usefulness (Ogu 2002:40). Acknowledging potential limitations and based on the literature reviewed RS measures can be clustered under four main factors namely (i) house design and architecture, (ii) house functionality, (iii) accessibility as well as (iv) neighbourhood and community.
The following section discusses the detail elements that constitute these factors and how they can be used to measure RS. They form the basis for the design of the data collection instrument used in the research survey.
3. CONCEPTUAL MODEL
A conceptual model was developed (Figure 1). The model incorporates the four distinct satisfaction factors and the influencing parameters namely expectations, socio-economic dynamics as well as demographics.
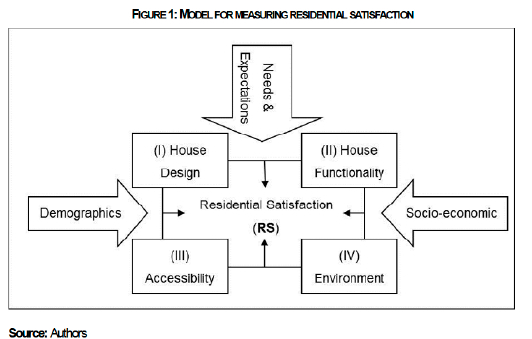
Based on the literature review and especially the approach of Ogu (2002:41) towards measuring RS, each factor contains various factor labels as sub-headings. Based on the author's experience as a professional civil engineer and in consultation the construction company representatives these factor labels were further developed and broken-down into attributes and key variables (Table 1) that provide the context and explanation of the relevant factors and factor labels. The attributes and explanations forms the key input to the research questionnaires and eventual basis for measurement.
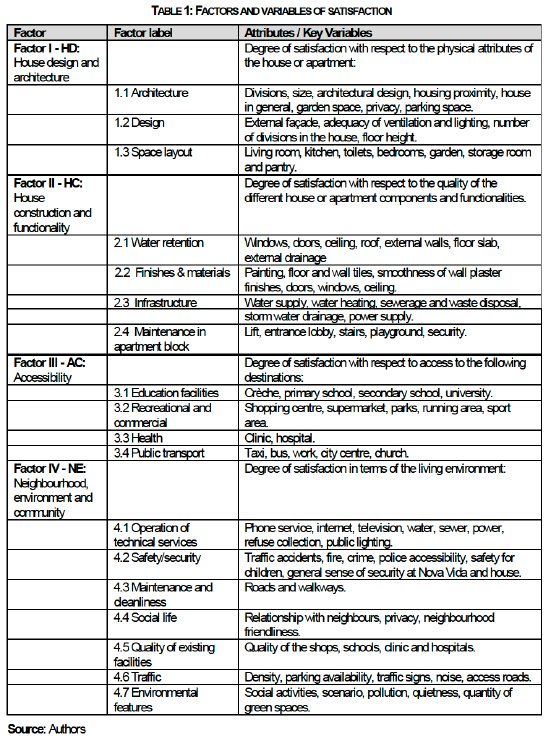
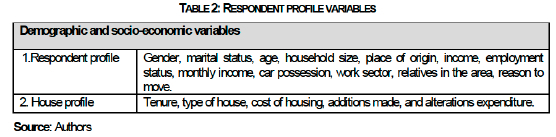
In order to establish the respondents' demographic and socio-economic profiles, the items listed in Table 2 were included in the questionnaire.
4. RESEARCH DESIGN
The research design comprised the preparation and administration of a survey questionnaire, followed by analysis of the collected data.
4.1 Research instruments and data gathering process
A comprehensive questionnaire was developed to determine the demographic and socio-economic characteristics as well as the associated key variables listed in Tables 1 and 2. A total of 85 variables were listed and evaluated against a five-point Likert scale. Since the level of residents' satisfaction was to be measured the Likert scale interval descriptors were designed to accommodate extreme, moderate and neutral responses. To achieve this level of measurement the descriptors highly dissatisfied, dissatisfied, moderate/neutral, satisfied and highly satisfied were used. The questionnaire also made provision for gathering qualitative information from respondents concerning the project and what they thought were the main problems facing the households and suggestions to improve the current conditions.
At the time of this research Nova Vida had 764 registered households. However, not all were inhabited. There were an unknown number of housing units with absent owners and a sizable number had been rented to foreign tenants. For that reason, the total sample was adjusted by a factor of 0.85 so as to reflect a more realistic number of fully inhabited households. The final, adjusted, sample was then calculated at 651 households. Following eight weeks of data collection a response rate of 86% was achieved with 560 completed questionnaires, comprising of 194 house and 366 apartment residents.
The data obtained through the Likert scale-based questionnaires could be classified as ordinal data. It could be argued that this type of data is only suitable for treatment with non-parametric methods, however numerous arguments and examples exist explaining and demonstrating the use of parametric tools for analysing ordinal data (Göb, McCollin & Ramalhoto 2007:602,603). The use of parametric methods in analysing ordinal data, especially the use of t-test to compare high and low scoring groups for Likert scale values is explained by Cooper & Emory (1995: 179-181).
It is not the intention of this paper to engage in the debate of data analysis method selection. This objective of this research is to assess the RS of Nova Vida residents and determine whether any correlation exist between the various factors of measurement and resident profiles. In view of this approach some parametric methods were used to obtain specific information such as averages, standard deviations and correlation analysis. The approach was more directed to answering the research questions meaningfully. Some techniques answer meaningful questions completely; others ignore aspects of the problem. Adams, Fagot, and Robinson (1965:100) said: "Nothing is wrong per se in applying any statistical operation to measurements of given scale, but what may be wrong, depending on what is said about the results of these applications, is that the statement about them will not be empirically meaningful or else that it is not scientifically significant".
4.2 Data processing
The results from the questionnaires were entered into an ACCESS database developed for the purpose of managing the data. All statistical analysis was conducted in SPSS. The selected Likert scale values for each of the factors were used to compute the Z-score index. The following statistical formula was applied to calculate the Z-score index (1):

Calculating the Z-score index the individual households could be grouped in categories of satisfaction based on the standard deviation (SD) of the population. Yi is the observed score for each household for a given factor, ý1 represents the mean distribution for a given factor; and S1 represents the standard deviation for the entire population per given factor. The Z values (Table 3) for each household represent the level of satisfaction with respect to the entire population in the sample. Respondents with strong negative (-) Z values are classified as dissatisfied, whereas those with strong positive (+) Z values are classified as satisfied. Values in the middle of the distribution are classified as moderately satisfied. The theoretical assumption is that if residential conditions deteriorate, households in the middle of the distribution will most likely move to the left side of the distribution (- Z values).
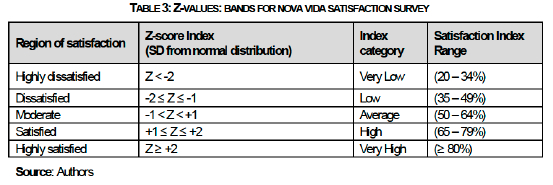
In addition to the Z-values the Satisfaction Index (SI) can also be expressed as a percentage of the resident's possible maximum score for each factor (Ogu 2002:43). Five regions of satisfaction, from very low (20-34%), low (35-49%), average (50-64%), high (65-79%) to very high (>80%) were identified. In the calculations each point on the Likert scale is multiplied by 20 (Ogu 2002:43). The highest satisfaction index that could be obtained for residential satisfaction is 100% and the lowest 20%. The median value is positioned at 60%. This implies that scores higher than 60% are in the average / high satisfaction region and those below 60% are in the average / low satisfaction region. In the analysis the satisfaction percentage ranges rather than the Z-values will be used. Table 3 displays the value bands used for the research.
A second performance index to be formulated is the Variable Index (VI). The purpose of the VI is to determine which variables contributed most or least to the level of satisfaction or dissatisfaction of the residents. VI is calculated according to Formula 2 (Ogu 2002:41):
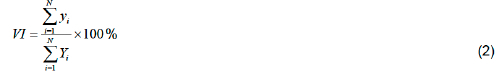
The results from the VI calculation are used to identify immediate actions or areas for improvement towards RS. Even though the same principles defined in the calculation of SI are applied to calculate VI, Ogu (2002:41) defined slightly different ranges of satisfaction for the VI values.
Based on the approach by Ogu (2002:44), the four satisfaction levels for VI are:
• Positive region (70-100%),
• Moderately positive (60-69%),
• Moderately negative (50-59%) and
• Negative (20-49%)
Given that the overall satisfaction cannot be viewed as a simple dependable variable, the underlying assumption of this analytical framework is that a combination of the variable satisfaction indexes such as project housing design (HD), housing construction and functionality (HC), accessibility conditions (AC), and neighbourhood and surrounding environment (NE), provide a more robust measure of the overall satisfaction. Therefore, the overall satisfaction index is calculated as the average of the four factor values.
The chi-square test was used to determine whether the relationship between overall SI and demographic, as well as the housing variables, are statistically significant. Furthermore, T-tests and analysis of variance (ANOVA), as well as bivariate correlations were used to test whether there is a difference between satisfaction means among the following type of respondents:
• age of the respondent;
• education level;
• housing tenure;
• income level; and
• view of respondents living in apartments as opposed to houses.
The results of the analysis are presented in the next section.
5. RESULTS
With respect to the demographic composition of the sample group 57.7% of the survey respondents were male and 42.3% were female. The average ages for men were 42 and women 41. A total of 42.9% were Luanda inhabitants, 43.6% from other Angolan provinces and 13.5% are foreigners. The education level was quite high with 48.2% having a bachelor's degree and a further 12% post graduate degrees. More than 80% of the residents are employed with others being either retired or students. Only 2% are unemployed. More than 50% of the households earn more than US$1500 per month. In total 28% of the resident are renting, 33% bought their houses/apartments and 39% were granted their residence free from government as part of a social upliftment and development programme.
5.1 Overall satisfaction
The results from the overall satisfaction measurements of residents were further divided in terms of home residents and apartment residents (Table 4).
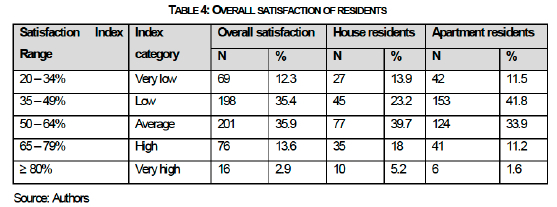
The results indicate that 47.7% of residents view their overall satisfaction to be low and very low. Disseminating this value into house and apartment resident experiences 40.1% of house residents and 53.3% of apartment residents indicated low and very low levels of satisfaction. With respect to positive experiences 16.5 % of residents had a high to very high satisfaction level. Of this overall figure 23.2% of house residents and only 12.8% of apartment residents provided positive feedback. This supports the findings of a study into housing densities and consumer choice done by Evans and Unsworth (2012:1164-1165).
The results indicate clearly that residents are in general more dissatisfied than satisfied with their residential facilities. Further analysis also indicates that apartment residents are more dissatisfied that house residents.
5.2 Hypothesis testing for SI
ANOVA tests were done to determine whether significant differences among overall satisfaction and the various different demographic variables exist. The null hypothesis was accepted at p > 0.05, meaning that there was no significant difference between the means of overall RS and demographic variables. The tests indicated that for certain demographic variables such as gender (F=2.032, df=1, p>.05), marital status (F= 0.992, df=4, p>.05), literacy level (F=1.189, df=3, p>.05), employment status (F=1.479, df=4, p>.05), work sector (F=1.273, df=4, p>.05), monthly household income (F=0.803, df=4, p>.05), car possession (F=1.159, df=8, p>.05), and house possession in the past (F=1.991, df=1, p>.05), do not have a significant influence on the mean of the overall RS. No strong correlation with overall RS was obtained for age and household size.
When analysing the nationalities a distinct difference between the nationals and foreigners was noticed (F=6.847, df=2, p<.05) with foreigners more satisfied than nationals. A possible explanation could be that most of the foreigners' house conditions and rent is secured by the company where they work and they have the same attachment the locals that bought the house have.
Galster and Hesser (1981:751) reported that people that have family and friends living nearby are usually more satisfied. Results from this study contradict observation by Galster and Hesser (1981:746) with residents that do not have family living in Nova Vida (F=4.553, df=1, p<.05) shown to be more satisfied than the ones that have family in the project. Even though the results were not statistically significant, it also showed that people with friends in the neighbourhood are in general more satisfied than the ones with no friends.
As far as reasons for moving to Nova Vida is concerned, the results (F=3.776, df=4, p<.05) indicated that residents that needed accommodation and did not have a choice but to live in Nova Vida are the most satisfied followed by the people that were given a house by the government. The least satisfied were the group of people that bought their own residence followed by the group that was expecting better living conditions.
5.3 Variable indices of factors
The VI count for each factor is presented in Table 5.
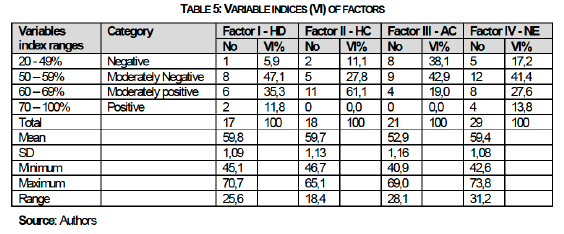
The factor that presents the most variables in the negative group is AC with 38%. AC is also the factor with the lowest mean (52.9%). The factor with lowest number of values in the negative region is HD with only 5.9%. The factor with the highest variable index count in the positive region is NE with approximately 13.8%.
Although no values were observed in the positive region HC still achieved 61,1% in the moderately positive category indicating that residents are in general satisfied with the overall construction and functionality of the homes. With no values in the positive category and only 19% in the moderately positive category AC seems to be the most significant concern for residents. In order to establish the specific concerns of residents, further analysis were done on the variables listed in the negative region of the measured VI (Table 6).
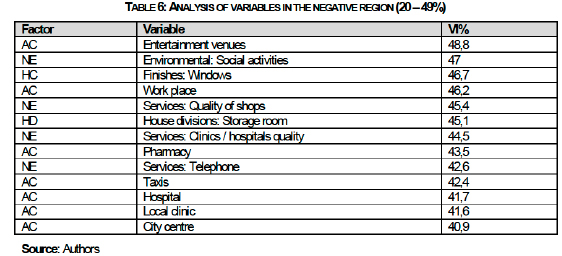
From the variables listed in table 6 it is clear that accessibility to the city centre, clinic, hospital and taxis are the most problematic. With only two HD and HC variables listed under the 13 most negative variables it can be concluded that residents' dissatisfaction is not related to house/apartment design and construction but rather towards AC and NE.
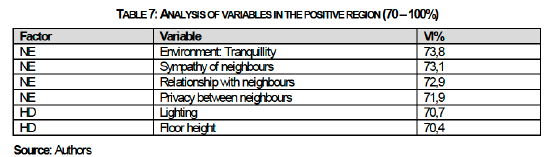
Reviewing the VI variables in 70-100% range (Table 7) it seems as if the residents' experience of the environment and interaction with neighbours are very positive.
Given the demographic characteristics of the residents, the two types of accommodation and factors influencing residents' experience of their living conditions the results were further analysed for potential relationships and variances.
5.3.1 Factor I-HD
The comparison of satisfaction indexes between house and apartment respondents suggest some differences in their attribution of weights among the variables (Chi square=39.135, df=4, p<.05). Both house type respondents felt particularly dissatisfied with the lack of storage space which had the lowest VI of 45,1% and Z of 2.3. Further analysis of the results indicated that respondents were concerned about the space of house divisions (with most of the variables falling in the moderately negative region) and its functionality leading to believe that the space designed is not spacious enough for habitants to fulfil their living needs.
The design and construction of Nova Vida was mostly pre-cast panels leaving limited flexibility for interior space alterations, especially in the apartments. House residents, even though also dissatisfied about house divisions, were more satisfied (70%) with the backyard size which provided options to increase the liveable space and create extensions to the house to accommodate their family needs.
5.3.2 Factor II - HC
With respect to house construction and functionality the study revealed that more than 50% of the residents are satisfied with the overall condition of their house or apartment. Main concerns were related with the quality of finish and construction materials, especially windows, bathroom finish materials, floor tiles and doors. During the survey exercise it was observed residents often replaced some tiles and re-painted areas by themselves at their own cost. From this it was clear that residents do take ownership of the living areas and would not mind paying extra for better finishes.
5.3.3 Factor III - AC
Accessibility contributed most to the overall dissatisfaction of the residents, with 80% of the variables falling in the negative and moderate negative region. Access to the work place seems to be problematic as well as general access to medical and health services. The negative results on AC again emphasise the importance of viewing mass housing projects in terms of the total living experience and not only the mere provision of shelter.
5.3.4 Factor IV-NE
The majority of respondents indicated that, in general, Nova Vida provides them with the quality of life to which they aspire. Respondents are very satisfied with their neighbours with regards to their relationship, sympathy and privacy. Nova Vida is also considered to have a pleasant tranquillity with the variables distributed mostly among the moderately positive and positive regions.
Approximately 60% of the residents were dissatisfied with the technical services operation, especially the fixed telephone line service. At least 50% of the respondents were dissatisfied with the quantity of green areas. Many of these areas forms part of the master plan but have not been fully implemented, maintained and utilised. Approximately 45% of the residents were also contemplated insufficient sidewalks. Parking availability has shown to be of high concern for apartment residents where only one parking space was allocated per apartment and no street parking.
6. CONCLUSION
Nova Vida is a landmark project that addressed the urgency of proper housing in post-war Angola. From the research results of the residents' satisfaction survey, it was possible to assess that the main concerns related to design, planning and urban management of infrastructure, public services and utilities. In general dissatisfaction is significantly higher for apartment residents than for house residents.
From the results it is clear that the objective of providing safe, practical and comfortable living space was achieved. However, some of the factors that impact peoples' life experience were not as well addressed. The average Nova Vida household comprises of five members and both house and apartment layout and facilities should take the family's total living needs into consideration. Internal space design should allow for more adequate storage areas. Developers could even consider providing base storage capacity and then allow a discretionary option for modular cupboards and storage equipment to be installed as per residents' specific needs.
Residents are constrained with respect to access to shops, medical, entertainment and recreational facilities. Mass housing developments have the potential to create opportunities for secondary economic activities. Entrepreneurial residents could see the opportunity to provide goods and services to their fellow residents and therefor provision should be made for such initiatives to incubate. This could include space allowance, within the housing complex, for smaller shops, laundry and car wash services, day-care, restaurant and entertainment areas, etc. Maintenance of services such as telephones, electricity supply and water is also unsatisfactory. This study confirms the literature findings that residential development projects should not only look at construction and access to the houses and apartments but should invest more time and capital into creating a sustainable living experience.
References
ADAMS E, FAGOT RF & ROBINSON RE. 1965. A theory of appropriate statistics. Pschometrika 30(2):99-127. [ Links ]
AL-DERHAM H, HIBBERD P & MUSTAPHA F. 1997. A model for assessing the performance of senior staff housing scheme in Qatar. In: Davidson and Meguid (eds), Procurement - a key to Innovation, CIB W92 Proceedings, CIB Publication 203:11-20. [ Links ]
AL-MONAMI AH. 2000. Structuring information on residential building: a model of preference. Engineering, Construction and Architectural Management 7(2):179-190. [ Links ]
BONNES M, BONAIUTO M & ERCOLANI AP. 1991. Crowding and residential satisfaction in the urban environment, contextual approach. Environment and Behaviour 23(5):532-52. [ Links ]
CAIN A 2007. Housing microfinance in post-conflict Angola. Overcoming socioeconomic exclusion through land tenure and access to credit. Environment and Urbanization 19: 361. [ Links ]
COOPER DR & EMORY CW. 1995. Business research methods. Fifth edition. Irwin: 179-180. [ Links ]
DAHLBERG M, EKLÖF M, FREDRIKSSON P & JOFRE-MONSENY J. 2012. Estimating preferences for local public services using migration data. Urban Studies 49(2):319-336. [ Links ]
EMPA (Emerging Powers in Africa). 2010. Strengthening the civil society perspective series II: China and other emerging powers in Africa. http://www.fahamu.org/images/empowers_report_0311.pdf. (accessed 24 September 2012). [ Links ]
ENGINEERING NEWS. 2006. Group Five staff under suspicion in Angola corruption case (8 June 2006), see http://www.engineeringnews.co.za/article/group-five-staff-under-suspicion-in-angola-corruptioncase-2006-06-08 . (accessed 24 September 2012). [ Links ]
EVANS A & UNSWORTH R. 2012. Housing densities and consumer choice. Urban Studies 49(6):1163-1177. [ Links ]
FRANCESCATO G, WEIDEMANN S & ANDERSON JR. 1974. Evaluating resident's satisfaction in housing for low and moderate income families: a multi-method approach. In: D Carson (ed.), Man-environment interactions: evaluation and Applications (Washington, DC: EDRA) 5:285-296. [ Links ]
GALSTER GC & HESSER GW. 1981. Residential satisfaction: residential and compositional correlates, Environment and Behaviour 13:735-758. [ Links ]
GILDERBLOOM J, BRAZLEY MD & PAN Z 2005. HOPE VI: A study of housing and neighbourhood satisfaction. Journal of Environmental and Sustainability Issues (Fall/Winter 2005), 11: 1-24. [ Links ]
GIULIANO G, REDFEARN C, AGARWAL A & HE S 2012. Network accessibility and employment centres. Urban Studies 49(1):77-95. [ Links ]
GÖB R McCOLLIN C & RAMALHOTO MF. 2007. Ordinal methodology in the analysis of Likert Scales. Quality & Quantity 41:601-626. [ Links ]
GRUBER KJ & SHELTON GS. 1987. Assessment of neighbourhood satisfaction by residents of three housing types. Social Indicators Research 19(3):303-315. [ Links ]
KELLEKCI OL & BERKOZ L 2006. Mass housing: user satisfaction in housing and its environment in Istanbul, Turkey. European Journal of Housing Policy 6(1):77-99. [ Links ]
LIU AMM 2003. The quest for quality in public housing projects: a behaviour-to-outcome paradigm. Construction Management and Economics 21(2):147-158. [ Links ]
LIU AMM, FELLOWS R & TUULI MM. 2011. The role of corporate citizenship values in promoting corporate social performance: towards a conceptual model and a research agenda. Construction Management and Economics 29(1):173-183. [ Links ]
MANDIC S & CIRMAN A. 2012. Housing conditions and their structural determinants: comparisons within the enlarged EU. Urban Studies 49(4):777-793. [ Links ]
MURPHY E & KILLEN JE. 2011. Commuting economy: an alternative approach for assessing regional commuting efficiency. Urban Studies 48(6):1255-1272. [ Links ]
OGU VI. 2002. Urban residential satisfaction and the planning implications in a developing world context: the example of Benin City, Nigeria. International Planning Studies 7(1):37-53. [ Links ]
OZAKI R 2003. Customer-focused approaches to innovation in house building. Construction Management and Economics 21(6):557-564. [ Links ]
PARKES A, KEARNS A & ATKINSON R 2002. What makes people dissatisfied with their neighbourhoods. Urban Studies 39(13): 2413-2438. [ Links ]
TORBICA ZM & STROH CR 2001. Customer satisfaction in home building. Construction Engineering and Management 127(1):82-86. [ Links ]
VAN KAMP I, LEIDELMEIJER K, MARSMAN G & DE HOLLANDER A 2003. Urban environmental quality and human well-being towards a conceptual framework and demarcation of concepts; a literature study. Landscape and Urban Planning 65:5-18. [ Links ]
VARADY DP & CARROZZA MA 2000. Toward a better way to measure customer satisfaction levels in public housing: a report from Cincinnati. Housing Studies 15(6):797-825. [ Links ]
VARADY DP, CAROLE C, WALKER CC & WANG X. 2001. Voucher recipient achievement of improved housing conditions in the US: do moving distance and relocation services matter? Urban Studies 38(8):1273-1304. [ Links ]
WAGNER SL, SHUBAIR MM & MICHALOS AC. 2010. Surveying older adults' opinions on housing: recommendations for policy. Social Indicators Research 99:405-412. [ Links ]
WIESENFELD E 1992. Public housing evaluation in Venezuela: a case study, Journal of Environmental Psychology 12:213-223. [ Links ]
ZIMMERMAN A & MARTIN Ml 2001. Post-occupancy evaluation: benefits and barriers. Building Research & Information 29(2):168-174. [ Links ]

