Serviços Personalizados
Artigo
Indicadores
Links relacionados
-
 Citado por Google
 -
 Similares em Google
Compartilhar
Journal of Contemporary Management
versão On-line ISSN 1815-7440
JCMAN vol.9 no.1 Meyerton 2012
RESEARCH ARTICLES
To invest or not to invest in SADC - a project management perspective
C Marnewick
University of Johannesburg
ABSTRACT
Foreign direct investment is an important aspect for developing countries. The problem is that investors do not know beforehand whether these investments will provide the necessary return on investment. These investments are implemented through projects and project management principles. The question is whether project management is the vehicle to deliver these investments. This research focuses on the success rate of projects within the Southern African Development Community (SADC). A questionnaire was used to determine the success rates and project management maturity levels of projects and organisations within the SADC region. There is currently no information available regarding project success within the broader African context and specifically the SADC region as an entity. The results indicate that delivered projects are perceived as successful irrespective of the project management maturity levels. The results also indicate that project success is measured across a wide spectrum of criteria. This research adds to the current body of knowledge regarding project success and gives a much needed African perspective. In practice the implication is that investors can feel comfortable that the project management discipline will deliver the benefits.
Key phrases: foreign direct investment, maturity levels, project management, project success, Southern African Development Community.
1 INTRODUCTION
The value of project management is often questioned and investigations attempting to prove it have not been able to provide definitive evidence thereof (Mullaly & Thomas 2009:126, Thomas & Mullaly 2007:78; Zhai, Xin & Cheng 2009:101). Despite this, most modern-day organisations engage with projects on a daily basis with varying degrees of success (Alderman & Ivory 2011:23; Sauser, Reilly & Shenhar 2009:669). Several studies have attempted to provide insight into project results (Eveleens & Verhoef 2010:33; Glass 2005:110; Labuschagne & Marnewick 2009:6). While the results of these studies have proven useful as a starting point for debate or discussion, very few studies have been conducted that focus on Africa as a continent and specifically South Africa as part of the Southern African Development Community (SADC).
SADC, as part of Africa, is considered a developing region within a developing continent. The World Bank lent Africa a total of $11,4 billion ($3,7 billion for South Africa) in 2010 for various development initiatives. In 2010 Africa had a portfolio of projects worth $35.3 billion and consisting of 502 projects (Ika, Diallo & Thuillier 2012:107; Rosetta & Abdul 2011:401). All of these projects would require project management in order to achieve the expected growth and benefits associated with these loans.
South Africa has also become more aware of projects with the advent of the FIFA World Cup 2010 and all its associated infrastructure upgrade projects ($3.5 billion), the Gautrain ($3.7 billion), upgrading of Cape Town International Airport (R1.6 billion), the new Ushaka International Airport (R6.8 billion) and many more. As more financial resources are consumed by projects, our ability to manage these projects effectively becomes paramount.
The aim of this article is to examine the project management capability across industries and countries within the SADC region in order to better understand the ability to deal with a rising demand for projects. The ability to deliver projects successfully is vital for the growth needed. Inability to do so will be harmful to the future. Research done in the field of project success such as the CHAOS and Prosperus reports focus either specifically on projects within the United States or information technology projects within South Africa. Although these research reports are valuable to determine project success, their focus is very narrow. This article attempts to fill the gap by focusing on a specific region within Africa, namely SADC, and across all industries. The results of this article can be used in two ways: (i) from a practitioner's point of view they can guide and inform decisions as to where to invest resources through projects and (ii) from an academic perspective, the results provide new insight into project success within the SADC region.
The rest of the article is divided into four sections. The first section provides an overview of the literature regarding foreign direct investment (FDI) and the relationship with project management. The second section focuses on the research methodology, leading into the third section which provides an analysis of the results. The discussion of the results follows in the fourth section.
2 LITERATURE REVIEW
An analysis by Ernst and Young on FDI projects indicates that, over the past ten years, Africa has witnessed an increase of 87% in inward FDI. This is confirmed by Vadra (2012:108) which stated that Africa's FDI inflows are highly increasing. Africa per se has remained an attractive investment destination throughout the global downturn and has managed to maintain its relative share of global investment flows as a result (Hilson & Banchirigah, 2009:172; Pickworth 2011 :Internet). When it comes to investment strategies, Africa is high on the agenda of global investors, with 42% of the businesses considering investing further in the region and an additional 19% of executives confirming that they will maintain their operations on the continent (Amadasun & Ojeifo, 2011:142).
In the period between 2008 and 2010, an average of 700 new FDI projects were launched in Africa (Otty & Sita 2011 :Internet). Various reasons are provided for this increase in FDI. These range from the fact that nine of the 15 countries in the world with the highest rate of five-year economic growth are African countries (Baden 2010:Internet; Pole, Angwafo, Buitano, Dennis & Ye; 2012:13). Another reason is the spending on infrastructure. Foreign countries are no longer coming to Africa to extract resources but they invest in infrastructure improvements on the continent (Kandiero 2006:360).
A breakdown of FDI in Africa reveals that 82% of all the FDI projects are done in fifteen countries, with South Africa in the lead at 16% (Ernst & Young, 2012:9). Within Africa, there are various development communities; for example, the Economic Community of West African States (ECOWAS) is a regional group of 15 West African countries that aims to achieve "collective self-sufficiency" for its member states by creating a single large trading bloc through an economic and trading union (Economic Community of West African States 2011:Internet). The East African Community (EAC) is the regional intergovernmental organisation of the Republics of Kenya, Uganda, the United Republic of Tanzania, the Republic of Rwanda and the Republic of Burundi.
SADC consists of the following countries: Angola, Botswana, the Democratic Republic of Congo (DRC), Lesotho, Malawi, Mauritius, Mozambique, Namibia, Seychelles, South Africa, Swaziland, Tanzania, Zambia and Zimbabwe (Southern African Development Community 2001:Internet). FDI projects currently (2011) underway include the Mall of Mauritius, Port Louis, Mauritius, which is in a key, strategic location in the heartland of the most economically active region in Mauritius, as well as the $914.80 million investment from Vodafone (UK) into South Africa in the communications sector in an information and communication technology and internet infrastructure project. Inditex (Spain) is investing in South Africa in the textiles sector in a retail project (Chislett, 2011:27).
All these investments need to be implemented by means of project management. Project management is the application of knowledge, skills, tools and techniques to project activities to meet project requirements (Project Management Institute 2008:6). In the case of investments, the project requirements are twofold. Firstly, they are to ensure that the product or service is delivered, for example the Mall of Mauritius. Secondly, the investors are looking for a return on investment (ROI). The research question posed in this article is whether project management is the vehicle that delivers the product and ROI as promised. The research question is addressed by investigating project success, project management maturity levels and the relation between these concepts. The next section focuses on the research methods that were applied.
3 METHODS AND MATERIALS
Research designs are concerned with turning the research question into a testing project and can be referred to as either quantitative research designs or qualitative research designs (Feilzer 2010:9; Huizingh 2007:368). Quantitative research refers to the systematic empirical investigation of quantitative properties and phenomena and their relationships (Balnaves & Caputi 2001:29; Blaikie 2003:28). The objective of quantitative research is to develop and employ mathematical models, theories and hypotheses pertaining to phenomena. The process of measurement is central to quantitative research because it provides the fundamental connection between empirical observation and mathematical expression of quantitative relationships.
Qualitative researchers aim to gather an in-depth understanding of human behaviour and the reasons that govern such behaviour (Denzin 2010:421; Lewins & Silver 2008:17). The qualitative method investigates the 'why' and 'how' of decision making and not just the 'what', 'where' and 'when' of quantitative research. Hence, smaller but focused samples are more often needed, rather than large samples.
Since the aim of this research was to investigate quantitative properties such as the project management maturity level or the number of projects that have failed and, for example, the relationship between maturity levels and project success, a quantitative approach was considered more applicable than a qualitative approach.
A structured questionnaire was developed based on the CHAOS Chronicles and the Prosperus 2003 and 2008 reports (Balnaves & Caputi 2001:84; Labuschagne & Marnewick 2009:10). Structured questionnaires are based predominantly on closed questions which produce data that can be analysed quantitatively for patterns and trends. The researchers opted for a structured questionnaire because it ensures that each respondent is presented with exactly the same questions in the same order. This ensures that answers can be reliably aggregated and that comparisons can be made with confidence between sample subgroups or between different survey periods.
The questionnaire consisted of four sections with section 1 focusing on the locations where respondents managed projects as well as the industries in which they were practising project management. Section 2 focused on the maturity of the processes contained in the nine knowledge areas of the PMBoK® Guide (Project Management Institute 2008:459). Section 3 focused on the outcomes of the projects that respondents were involved in, while section 4 focused on gathering demographic information. The structured questionnaire consisted of 199 items placed under 25 questions. A dualistic approach was taken to gather responses, namely a web-based survey as well as a manually distributed survey. The web-based survey was designed and hosted on an online survey software and questionnaire tool. This survey was open to the public while the targeted survey focused on specific individuals. The second approach made use of hard copies of the structured questionnaire and specific targeted individuals were asked to complete the questionnaires manually.
A total of 1 067 responses were received. The data gathered in this survey was processed and analysed using SPSS, a statistical analysis software package (Argyrous 2011:24; Huizingh 2007:368). SPSS is able to do enhanced data management and has extended reporting capabilities. The use of direct individual contact using the questionnaire accounted for 39.5% of the responses, while the open invitation web-based questionnaire yielded 60.5% of the responses. The mean, variance and standard deviation were devised from the data as they formed the basis for inferential statistical procedures.
Validity measures what it purports to measure (Cameron & Price 2009:174). If a questionnaire does not measure what it is supposed to measure, then the conclusions and statistical analysis might also be invalid. Construct validity was assured by the use of different data sources (project managers from ten industry sectors), improved content and known theory or models such as the PMBoK® Guide (Project Management Institute 2008:459) and various project management maturity models (Pasian, Boydell & Sankaran 2011:150; Pennypacker & Grant 2003:7).
Internal validity is the extent to which the questionnaire allows the researchers to draw conclusions about the relationship between variables. Internal validity was tested through various correlations. External validity, on the other hand, is the extent to which the sample is genuinely representing the project management population from which it was drawn. In this research, the sample was representative as the respondents were all working and functioning within the bigger discipline of project management. These respondents represented people that had completed some form of formal education in project management.
Another aspect is that the data must be reliable. Reliable data is evidence that can be trusted. It was important for the questionnaire to provide reliable data since this is a longitudinal study and the questionnaire and data must be replicable. In other words, reliability is an indicator of the questionnaire's internal consistency (Zikmund, Babin, Carr & Griffin 2010:305). Reliability is concerned with the consistency of measures. Equivalent-form reliability, similar to the test-retest method and item analysis, was used for judging the reliability of the research design.
4 RESULTS AND ANALYSIS
In this section the results from the questionnaires are analysed and the following areas are focused on: (i) demographics of the respondents, (ii) project success and factors contributing to it, (iii) project management maturity levels and (iv) the impact of maturity levels on project success.
This analysis is done from an overall perspective as well as a country-specific perspective and comparison.
4.1 Demographics
In the 2010 survey, respondents from different industries in the African environment participated. A total of 1 067 responses were received. Several of the respondents worked in organisations spanning more than one industry sector. Participants from the organisations constituted a random sample, which was important to ensure that they were representative. The sample size was considered sufficient in order to determine general trends and for longitudinal analysis.
Respondents indicated that they were implementing projects throughout Africa and even in the USA. Most of the projects were implemented, as expected, in South Africa, but projects were also being implemented throughout the African continent. SADC countries also constitute a large percentage of projects as depicted in Figure 1.
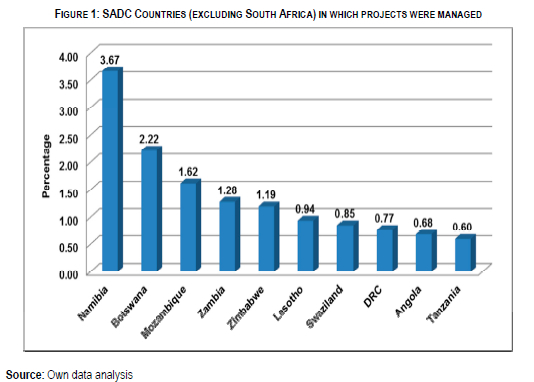
A total of 162 projects were managed in the SADC region (excluding South Africa), which constitutes 13.82% of the projects.
4.2 Project involvement
Some respondents indicated that they managed between 100 and 250 projects over a two-year period. The implication is that these particular respondents managed new projects every three to six days. These responses were ignored for this particular study. Figure 2 indicates the distribution of project involvement.
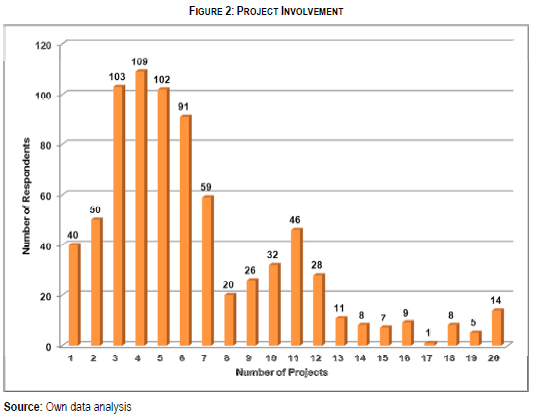
Most of the respondents (47.7%) managed between three and six projects over a two-year period. The mean value is 9.34, which indicates that most of the project managers surveyed managed multiple projects. A total of 4 950 projects were managed over a two-year period.
Although some project managers managed multiple projects, there were project managers who only managed one or two projects over the two-year period. This raises the question whether this relates to the complexity of the project or the experience of the project manager. Experience was not part of the questionnaire and therefore this correlation of experience and complexity versus the number of projects managed could not be determined. There are a significant number of respondents who managed more than 20 projects over a two-year period. This amounted to 10.7% of the respondents.
4.3 Project success rates
One of the research objectives of this article was to determine the success rates of projects. Respondents were asked to indicate how many projects failed, were challenged and were successful in the last two years. The definition of failed, challenged and successful was left open to interpretation and is addressed later in this article.
Figure 3 indicates the success of projects. It is evident from the analysis that 55% of all projects were perceived as successful. This is a significant improvement (18%) from previous research by Labuschagne and Marnewick (2009). The reason for this improvement might be the fact that as per the research by Labuschagne and Marnewick (2009), successful projects were measured based on the triple constraint of time, cost and scope versus an own interpretation of project success.
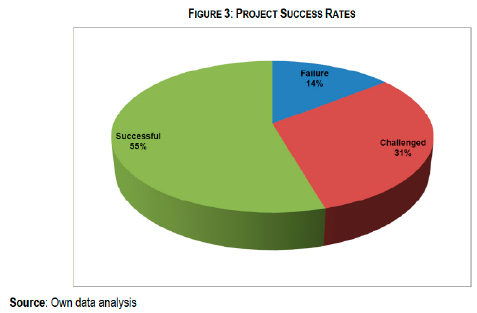
Challenged projects stayed constant. Thirty one per cent of the projects were perceived as challenged versus the 36% in 2008. Failed projects dropped significantly from 27% in 2008 to 14% in 2010. This trend needs to be carefully monitored in future research as the perception is that the challenged projects should have decreased since the criteria for a successful project are less prescriptive. The responses might also show some level of bias towards project success. Project managers might have been optimistic and reported that projects were successful even when those projects were challenged or even failed. Project managers might also have reported only on successful projects and excluded failed or challenged projects to save embarrassment.
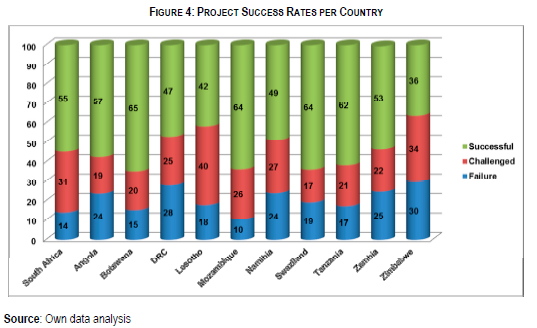
Figure 4 is a graphical display of the success rates per country. It follows the trend where the percentage of success was more than 50%. The only exceptions are the DRC, Lesotho, Namibia and Zimbabwe. Four of the SADC countries had success rates of more than 60%, i.e. Botswana, Mozambique, Swaziland and Tanzania.
The next section focuses on how project success was defined by the various respondents.
4.4 Project success criteria
Since it is almost impossible to define project success, an additional question was built into the questionnaire asking the respondents to qualify success within the organisation. The success criteria were derived from various sources to provide as complete a list as possible to the respondents (Ahadzie, Proverbs & Olomolaiye 2008:676; Ika 2009:8; Khang & Moe 2008:73; Thomas & Bendoly 2009:72; Thomas & Fernández 2008:739).
The responses are depicted in Figure 5. A comparison was also made between South Africa (ZA) and the combined SADC countries. The rationale was that most of the projects were implemented in South Africa and that through the combination of the SADC countries, a better perspective is gained in relation to South Africa.
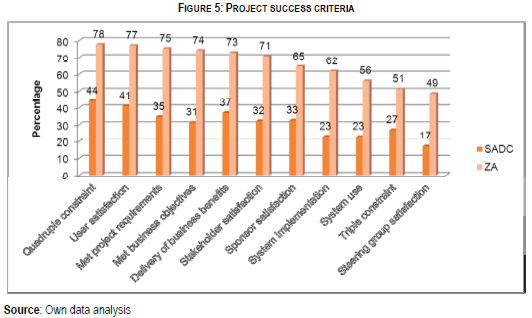
Figure 5 indicates that there is a slow but definite transition from the original triple constraint to more business-related criteria. The first focus is on South Africa. No criterion was regarded as more important than the others. Six of the criteria were seen as very important with more than 70% of the respondents selecting these criteria. These criteria include measurement against the project itself, i.e. the quadruple constraint. Other criteria focus on the results and products of the project, i.e. user satisfaction and delivering the business benefits. The only criterion that was rated below 50% was steering group satisfaction.
Project success is thus measured at two levels, i.e. the project itself and also the deliverables and products of the project itself. The same tendency is observed when SADC is analysed. Although the percentages are not as high as those for South Africa due to the number of respondents, there was no single criterion that was perceived as more important than the others. The importance of the criteria differs from those for South Africa.
It is quite interesting to note that there is no dominating criterion when it comes to the definition of project success. The implication is that a wide variety of criteria are utilised to determine project success and although the tripe/quadruple constraint (78% SA versus 44% SADC) is still the most utilised criterion, five other criteria are also above 70%, indicating that these criteria are valued as much as the triple/quadruple constraint. There is thus no single criterion that organisations use to determine project success. The next section identifies the factors that contribute to successful project outcome.
4.5 Factors influencing project success
Several factors that influence project outcome have been identified (Turner, Ledwith & Kellym 2009:285; White & Fortune 2009:45). These factors were further analysed and consolidated to deliver a list of the 14 main factors. The respondents were asked to indicate the factors that made a direct contribution to the successful outcome of the project. Respondents were only asked if a factor influenced the outcome of the project and not to rate them relative to one another. Figure 6 depicts the analysis of the factors that influence the outcome of a project.
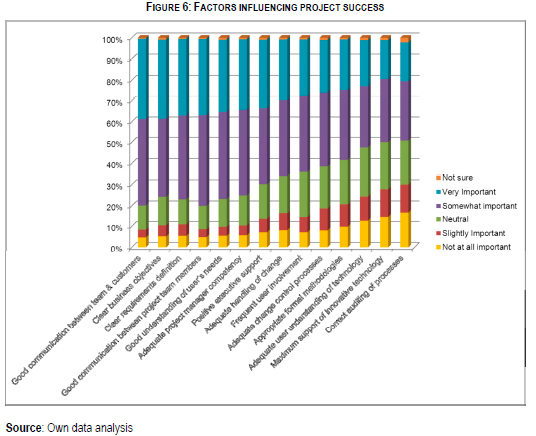
Respondents could select any of 14 contributing factors. These factors could be graded based on a Likert scale ranging from 'Not at all important' to 'Very important'. The top contributing factors can be grouped into two groups: the first group relates to communication within the project team and with the customer. The second group of contributing factors focuses on the objectives, requirements and needs of the organisation and customer. This underlines the finding that one of the criteria for defining project success is based on meeting the business requirements and objectives.
There are also factors that were not perceived as important at all. These factors include auditing processes as well as the use of technology as either a support facility or the users' understanding of technology. Factor analysis was done to determine if there is a specific factor or grouping of factors contributing to project success. Factor analysis is designed to identify underlying factors present in the patterns of correlations among a set of measures (Blaikie 2003:220). The reason why factor analysis was done was to determine if any factor contributed more to project success than another.
Table 1 clearly indicates that the factors contributing to project success were all equally important and that they cannot be grouped into clusters of factors indicating that one factor was more important than another.
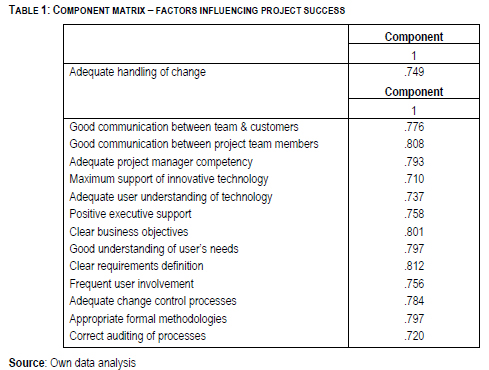
It is also clear from this table that any one of these factors contributes significantly to project success. If a factor analysis is done on the factors that contribute to either project failure or challenged projects, then the same types of results are achieved as presented in Table 1. This means that no single factor by itself contributes to either project success or failure. The third objective of this article was to investigate the maturity levels of project management within the SADC region.
4.6 Project management maturity levels
Project management maturity models (PMMM) provide a framework for improving project management practices in an organisation (Pennypacker & Grant 2003:4, Project Management Institute 2009:56). The principle is that as the organisation progresses through the maturity levels, it becomes better at what it does, and also better equipped to deal with changes in procedures and practices, thereby enabling an organisation to complete projects at a higher rate of success. Figure 7 reflects the respondents' perception of their respective project management maturity levels.
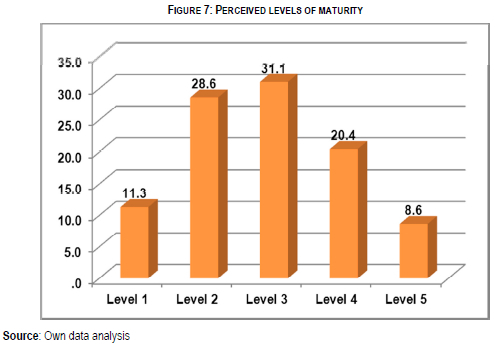
According to the perceived level of maturity, the majority of the organisations (31.1%) perceived themselves to be, on average, at level 3, with 28.6% of the organisations at level 2. Most organisations (71%) were perceived to be at maturity levels 1 to 3.
By comparing the actual levels of maturity with the perceived levels, it is possible to determine whether there is a difference. The average maturity is therefore the average of the maturity of the nine knowledge areas, where the average of a specific knowledge area is determined by the processes within that specific knowledge area. The actual maturity levels per knowledge area are illustrated in Figure 8.
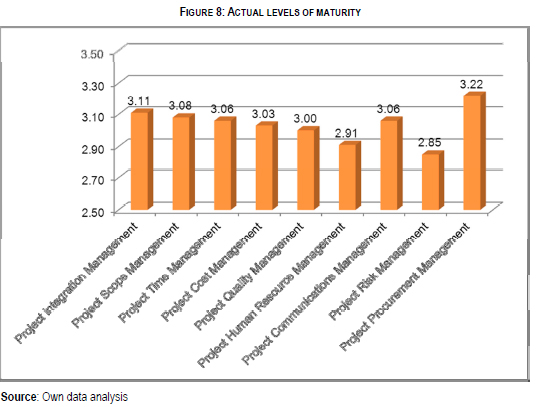
There are only two knowledge areas where the actual maturity levels were below 3: Project HR Management (2.91) and Project Risk Management (2.85). Both these knowledge areas are facilitating knowledge areas. While none of the reasons for success and failure is directly related to project risk management, most project failures can be traced back to poor or absent project risk management (De Bakker, Boonstra & Wortmann 2010:495; Eckhause, Hughes & Gabriel 2009:374; Krane, Rolstadás & Olsoon 2010:83). One of the defining criteria for a project is that it involves uncertainty which diminishes as the project progresses. Projects, by their very nature, are risky. Poor implementation of project risk management can therefore lead or contribute to project failure.
Figure 9 indicates the actual maturity levels per country. The average for the actual maturity level across all the SADC countries is 3.01. Five countries have an actual maturity level less than 3 and two (ZA and DRC) are on par with the average maturity level. Only four countries have a maturity level higher than 3. It must be noted that these averages are also below 3.5. All the countries' actual maturity levels are around level 3 and the difference between the highest and lowest countries is 0.7.
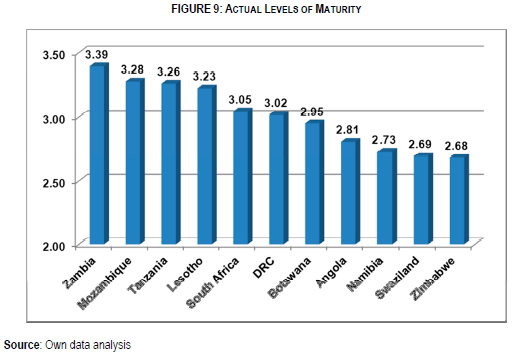
Given the fact that the project management maturity level is fluctuating around level 3 for SADC, it raises the question whether project management maturity influences the success of a project.
4.7 Correlation between project success and maturity levels
This section focuses on the correlation of maturity, project size and demographics and project outcome. A correlation was made between project success and project maturity levels. Correlation is concerned with the degree and direction of relation between two variables and the most widely used measure of correlation is known as the Pearson Product Moment Correlation (Balnaves & Caputi 2001:152).
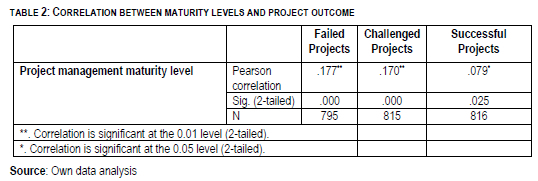
Table 2 illustrates this correlation but as per the results, there is no significant correlation to determine outright if the outcome of a project is dependent on the maturity level of an organisation.
Given the weak correlations that exist, Figure 10 attempts to display this correlation in another way. The responses were grouped into the various perceived maturity levels and then the success rate of the projects was calculated.
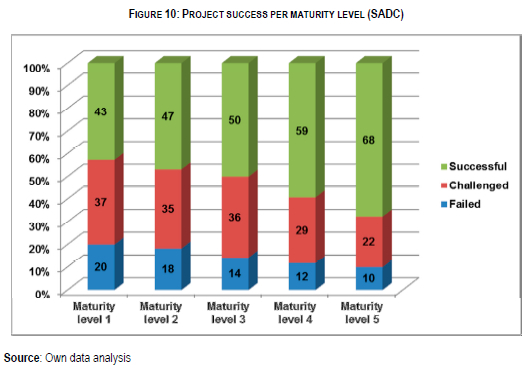
Figure 10 confirms the weak correlations but does add value because it indicates that there is no major difference between maturity levels 1, 2 and 3. There is, however, a difference at maturity levels 4 and 5 where 60% to 68% of the projects were perceived as successful. The indication is that once maturity level 4 is achieved, the success rate of the projects increases.
The above figures support the notion that projects can still be successful despite an organisation being at project management maturity level 1. Success becomes dependent on the individual and not on the processes. Yazici (2009:16) states that "project management maturity is significantly related to business performance but not to project performance".
5 DISCUSSION
This article focuses on whether project management can make a difference in the delivery of FDI projects. The first aspect that needs to be addressed is the involvement in projects from a SADC perspective as well as a project management perspective. It is evident that most of the projects are done in South Africa. This correlates with the fact that South Africa is the recipient of 18% of Africa's FDI. The other countries within SADC are also the recipients of FDI but on a smaller scale and this reflects in the number of projects that are implemented as per Figure 1.
The other perspective is the number of projects that project managers are involved in. Although close to 50% were managing only three to six projects in a two-year period, there were project managers who managed on average nine projects with outliers closer to 20 projects. The impact on managing too many projects needs to be investigated as well as the reasons why project managers are managing so many projects. Managing too many projects might have an impact on the success of the projects.
It is encouraging to realise that only 14% of the projects were perceived as failures. The implication is that investors can expect to receive benefits from their investments 86% of the time. Although some 31% of the projects were challenged, investors can still expect to receive benefits from these projects as well as from the 55% successfully delivered projects. An analysis of project success per country (Figure 4) also indicates that investors could expect a return on their investments. Although the percentages vary between successful, challenged and failed projects, SADC countries provide a safe haven for FDI.
The question that should be posed by foreign investors is how project success is measured. If it is measured within the constraints of cost, time and scope, it can and should raise concerns. Given the analysis as per Figure 5, project success is measured based on the benefits that these projects and investments deliver. Although the quadruple constraints still play a major role, the emphasis is more on benefits such as stakeholder satisfaction, compliance with project requirements and business objectives and the delivery of business benefits. Success is measured on the delivery of the physical product or services in terms of time, cost and scope and secondly whether it offers the benefits that investors are looking for.
The research also investigated the factors that contribute to project success. The conclusion is that communication plays a vital role within project success. It ensures that the project manager understands the needs and expectations of the customer or investor. It also ensures that the project team and customer are focusing on and addressing the same aspects within the project. There are other factors that influence the outcome of project success, such as the handling of change, but the impact is not as high as that of effective communication. This is evident from the factor analysis that was done as per Table 1.
Another aspect that this article addresses is how the project management maturity levels influence the outcome of a project. The analysis of the data indicates that most of the organisations (71%) were performing at maturity levels of between 1 and 3. Only 29% of the organisations had the perception that they operated on levels 4 and 5. If the actual maturity levels are analysed, it is evident that there is no difference between the various SADC countries. The average maturity level is 3 with a fluctuation of 0.7 between the most mature country (Zambia) and the least mature country (Zimbabwe). Given the lack of a strong positive correlation between project success and maturity levels, investors are benefiting equally from investing in any SADC country. The difference is that individual organisations within a country might have a maturity level of 4 or 5. As per Figure 10, the implication is that those organisations will have a 60 - 68% chance of delivering projects successfully.
From a project management perspective, foreign investors can invest safely within SADC. The evidence indicates that investments will be delivered successfully and that investors will receive the ROI sought. Investors will, however, have to do some homework with regard to the following: (i) the competencies of the project manager and the number of projects the project manager is managing at a given point in time, (ii) the maturity level of the SADC country as well as that of the organisation implementing the project and (iii) a holistic view of the investment within the bigger scheme of the SADC region.
6 CONCLUSION
A review of the literature indicates that Africa and specifically Southern Africa are seen as green fields for FDI. These FDIs range from retail to construction to ICT. They need to be implemented through project management and this raises the question of whether project management is the correct vehicle to implement these investments.
An analysis of the findings suggests that projects are implemented successfully with a success rate of 55%. This success rate can be attributed to various factors that are not necessarily under the control of the investor per se, but that fall under the auspices of the project manager and project management as a discipline at large. The emphasis is on delivering the anticipated benefits and ROI rather than adherence to cost, time and scope. This is done within the project management maturity levels. There is no strong positive correlation between project success and maturity levels and the indication is that only maturity levels 4 and 5 will have a positive impact on project success.
It can be concluded that project management as a discipline will ensure project success, and therefore from a project management perspective it adds value to the realisation of FDI and the anticipated benefits.
The significance of this research is that it provides insight into project management practices within the SADC region. This is the first time that this type of research has been conducted and contributes to the body of much needed research into project management in Africa. It also suggests that project management in the SADC region is well and sound based on the successful delivery of projects and the overall maturity levels.
Further research will continue as this forms part of a longitudinal study started in 2003. Emphasis will be placed on African economic regions as well as the various industries and not necessarily a specific industry.
REFERENCES
Ahadzie DK, Proverbs DG & Olomolaiye PO. 2008. Critical success criteria for mass house building projects in developing countries. International Journal of Project Management 26(6):675-687. [ Links ]
Alderman N & Ivory C. 2011. Translation and convergence in projects: An organizational perspective on project success. Project Management Journal 42(5): 17-30. [ Links ]
Amadasun AB & Ojeifo SA. 2011. Foreign direct investments and sustainable development in Sub Sahara Africa in the 21st century: challenges and interventions. Insights to a Changing World Journal (6):135-146. [ Links ]
Argyrous G. 2011. Statistics for research with a guide to SPSS 3. London: Sage. [ Links ]
Baden B. 2010. 12 Reasons to invest in Africa. [Internet: http://money.usnews.com/money/personal-finance/mutual-funds/articles/2010/08/26/12-reasons-to-invest-in-africa; downloaded on 23 February 2011. [ Links ]]
Balnaves M & Caputi P. 2001. Introduction to quantitative research methods - an investigative approach. London: Sage. [ Links ]
Blaikie N. 2003. Analyzing quantitative data - from description to explanation. London: Sage. [ Links ]
Cameron S & Price D. 2009. Business research methods - a practical approach. London: Chartered Institute of Personnel and Development. [ Links ]
Chislett W. 2011. Spain's multinationals: the dynamic part of an ailing economy. Madrid: Elcano Royal Institute. [ Links ]
De Bakker K, Boonstra A & Wortmann H. 2010. Does risk management contribute to IT project success? a meta-analysis of empirical evidence. International Journal of Project Management 28(5):493-503. [ Links ]
Denzin NK. 2010. Moments, mixed methods, and paradigm dialogs. Qualitative Inquiry 16(6):419-427. [ Links ]
Eckhause JM, Hughes DR & Gabriel SA. 2009. Evaluating real options for mitigating technical risk in public sector R&D acquisitions. International Journal of Project Management 27(4):365-377. [ Links ]
Economic Community of West African States. 2011. Key ministerial structures responsible for ECOWAS regional integration in member states. [Internet: http://www.ecowas.int/; downloaded on 1 March 2012. [ Links ]]
Ernst & Young. 2012. 2012 Africa attractiveness survey: Ernst & Young. [ Links ]
Eveleens JL & Verhoef C. 2010. The rise and fall of the Chaos report figures. IEEE Software 27(1):30-36. [ Links ]
Feilzer YM. 2010. Doing mixed methods research pragmatically: Implications for the rediscovery of pragmatism as a research paradigm. Journal of Mixed Methods Research 4(1):6-16. [ Links ]
Glass RL. 2005. IT failure rates --70% or 10-15%? IEEE Software 22(3):110-112. [ Links ]
Hilson G & Banchirigah SM. 2009. Are alternative livelihood projects alleviating poverty in mining communities? Experiences from Ghana. Journal of Development Studies 45(2):172-196. [ Links ]
Huizingh E. 2007. Applied statistics with SPSS. London: Sage. [ Links ]
Ika LA. 2009. Project success as a topic in project management journals. Project Management Journal 40(4):6-19. [ Links ]
İka LA, Diallo A & Thuillier D. 2012. Critical success factors for World Bank projects: an empirical investigation. International Journal of Project Management 30(1):105-116. [ Links ]
Kandiero T. 2006. Trade openness and foreign direct investment in Africa. South African Journal of Economic and Management Sciences 9(3):355-370. [ Links ]
Khang DB & Moe TL. 2008. Success criteria and factors for international development projects: a life-cycle-based framework. Project Management Journal 39(1):72-84. [ Links ]
Krane HP, Rolstadás A & Olsson NOE. 2010. Categorizing risks in seven large projects - which risks do the projects focus on? Project Management Journal 41 (1):81-86. [ Links ]
Labuschagne L & Marnewick C. 2009. The Prosperus Report 2008: IT project management maturity versus project success in South Africa. Johannesburg: Project Management South Africa. [ Links ]
Lewins A & Silver C. 2008. Using software in qualitative research. London: Sage. [ Links ]
Mullaly M & Thomas JL. 2009. Exploring the dynamics of value and fit: insights from project management. Project Management Journal 40(1):124-135. [ Links ]
Otty M & Sita A. 2011. It's time for Africa. [Internet: http://www.ey.com/Publication/vwLUAssets/2011_Africa_Attractiveness_Survey/$FILE/11EDA187 _attractiveness_africa_low_resolution_final.pdf; downloaded on 10 January 2012]. [ Links ]
Pasian B, Boydell S & Sankaran S. 2011. Project management maturity: a critical analysis of existing and emergent factors. International Journal of Managing Projects in Business 5(1): 146-157. [ Links ]
Pennypacker JS & Grant KP. 2003. Project management maturity: an industry benchmark. Project Management Journal 34(1):4-11. [ Links ]
Pickworth E. 2011. Foreign investment in Africa on rise. [Internet: http://mg.co.za/article/2011-05-03-foreign-investment-in-africa-on-rise; downloaded on 12 March 2012. [ Links ]]
Pole PC, Angwafo M, Buitano M, Dennis A & Ye X. 2012. Africa's pulse. Washington D.C.: The Worldbank. [ Links ]
Project Management Institute. 2008. A guide to the project management body of knowledge (PMBOK Guide). 4. Newtown Square, Pennsylvania. [ Links ]
Project Management Institute. 2009. Organizational project management maturity model (OPM3). 2. Newtown Square, Pennsylvania. [ Links ]
Rosetta M & Abdul A. 2011. Ease of doing business and FDI inflow to Sub-Saharan Africa and Asian countries. Cross Cultural Management: An International Journal 18(4):400-411. [ Links ]
Sauser BJ, Reilly RR & Shenhar AJ. 2009. Why projects fail? How contingency theory can provide new insights - a comparative analysis of NASA's Mars Climate Orbiter loss. International Journal of Project Management 27(7):665-679. [ Links ]
Southern African Development Community. 2001. The Treaty of the Southern African Development Community. [Internet: http://www.sadc.int/english/key-documents/declaration-and-treaty-of-sadc/; downloaded on 1 March 2012. [ Links ]]
Thomas D & Bendoly E. 2009. Limits to effective leadership style and tactics in critical incident interventions. Project Management Journal 40(2):70-80. [ Links ]
Thomas G & Fernández W. 2008. Success in IT projects: A matter of definition? International Journal of Project Management 26(7):733-742. [ Links ]
Thomas J & Mullaly M. 2007. Understanding the value of project management: first steps on an international investigation in search of value. Project Management Journal 38(3):74-89. [ Links ]
Turner JR. Ledwith A & Kellym J. 2009. Project management in small to medium-sized enterprises: a comparison between firms by size and industry. International Journal of Managing Projects in Business 2(2):282-296. [ Links ]
Vadra R. 2012. Africa: an emerging markets frontier. African Journal of Economic and Sustainable Development 1(2):103-117. [ Links ]
White D & Fortune J. 2009. The project-specific Formal System Model. International Journal of Managing Projects in Busines, 2(1):36-52. [ Links ]
Yazici HJ. 2009. The role of project management maturity and organizational culture in perceived performance. Project Management Journal 40(3): 14-33. [ Links ]
Zhai L, Xin Y & Cheng C. 2009. Understanding the value of project management from a stakeholder's perspective: case study of mega-project management. Project Management Journal 40(1):99-109. [ Links ]
Zikmund WG, Babin BJ, Carr JC & Griffin M. 2010. Business research methods. London: South-Western Cengage Learning. [ Links ]


