


Serviços Personalizados
Artigo
 Inglês (pdf)
 Artigo em XML
 Referências do artigo
Indicadores

Links relacionados
-
 Citado por Google
 -
 Similares em Google
Compartilhar

 Permalink
Journal of Contemporary Management
versão On-line ISSN 1815-7440
JCMAN vol.9 no.1 Meyerton 2012
RESEARCH ARTICLES
Utilisation of the expectation disconfirmation model: EAS rendered in the SAPS
A Grobler; YT Joubert; EC Rudolph; M Hajee-Osman
University of South Africa
ABSTRACT
The purpose of this paper is to determine the degree of the expectation-disconfirmation of the employees of the South African Police Service (SAPS) towards the Employment Assistance Services (EAS) from which strategies should be developed and implemented to address the issues regarding the employees' perceptions, expectations and experiences regarding the EAS. This article expands on the expectation disconfirmation model identified in previous research. All available employees were included in the study (N = 37 816), therefore no sampling strategy was used. The Employee Assistance Services professionals administered the survey instrument. The results of the study indicated that the employees of the SAPS experienced a negative disconfirmation regarding the EAS physical factors
Key phrases: disconfirmation, Employee Assistance Services (EAS), expectation, South African Police Service
1. INTRODUCTION
1.1 Background
In South Africa, change, crises and trauma management at work are important health-promotion interventions (Bergh 2011:314). South African Police Service (SAPS) employees need Employee Assistance Services (EAS), as they are confronted with more situations that discourage and create mental, emotional and spiritual burdens than anyone else (Jacobson & Attridge 2010:1). Therefore, a manager of an organisation has an influence in a working environment and has a responsibility on how employees perceive organisational proceedings such as Employee Assistance Services (Bergh 2011:208). EAS were delivered to employees by several professionals, namely psychologists, social workers and chaplains.
1.2 Trends in literature
At a theoretical level, expectations and (dis)satisfaction remain contentious issues among marketing researchers. Hossain and Quaddus (2012:447) argued that expectations still need formulation. However, they agree with Spreng, MacKenzie and Olshavsky (1996) that expectation can be characterised as a central construct of consumer satisfaction as a baseline to measure confirmation. Hossain and Quaddus (2012:447) further cite that disconfirmation can be defined as the perceived performance of the service based on a customer's initial expectation. This is determined by the extent to which the customer's expectation is confirmed. In the literature, a lot of the focus is on service satisfaction, especially in the field of client satisfaction. In this research, though the term service satisfaction was applied, and the focus was on satisfaction in a different context, i.e. employee satisfaction, within a working environment that requires a certain type of service and from a more psychological viewpoint. In this study, the focus was furthermore narrowed down to services in the SAPS. The Expectation Disconfirmation model, based on studies by Santos and Boote (2003:144) and Fearon and Philip (2008:484), depicts the hierarchy of expectations related to the disconfirmation theory. Furthermore, the foundation of this model speculates that the actual performance of a product or service compared to that of what is expected by the users determines the level of satisfaction or dissatisfaction experienced - thus showing whether disconfirmation is experienced by the service users.
Ensuring and measuring quality of care is a particularly difficult challenge in today's changing healthcare environment (Chou, Chen, Woodard & Yen 2005:76). Disconfirmation of expectations influences a person's judgment and evaluation of a service or product (Oliver 2010:181). Although consumer satisfaction is an important topic for management and academic research, no research has been done on the satisfaction of a service in the workplace (Spreng & Chiou 2002:829; Yi & La 2003:20). Satisfaction can be viewed as the perceived degree in which a service or product exceeds, meets or falls short of an employee's expectations (Oliver & Bearden 1985:235; Venkatesh & Goyal, 2010:299). Therefore, disconfirmation may affect any future service and loyalty to the workplace. In a study by Grobler and Joubert (2012:162) regarding the expectations, perceptions and experience of EAS in the SAPS, it was found that employees of the SAPS have a high expectation of the EAS, and therefore there is a need for such employee services. However, the employees' perception of the EAS is low compared to their expectations.
The research data, on which this article is based, was gathered by means of a cross-sectional survey. The primary purpose of this survey was to attain information related to the expectations, perceptions and experiences of SAPS employees who made use of the EAS offered. The purpose of this article is thus to expand on the Expectation Disconfirmation model based on previous literature and to generate recommendations regarding the model.
2. PURPOSE OF THE STUDY
Management of the SAPS requested an evaluation regarding the expectations, perceptions and experiences of employees employed at the SAPS with regard to the EAS. A questionnaire was initially developed to explore the employees' expectations, perceptions and experience of the EAS. This purpose of this article, however, is to enhance on the expectation disconfirmation model based on the theory investigation by Grobler and Joubert (2012:163).
3. LITERATURE REVIEW
3.1 Customer satisfaction
For years, customer satisfaction (CS) has been one of the most compelling issues among academics and business (Youjae & Suna 2003:20). The expectation disconfirmation model remains controversial among marketing scholars. The Expectation-Disconfirmation model posits that product performance is compared to pre-use expectations, and this comparison process determines disconfirmation (Spreng & Chiou 2002:829). Under present economic systems, people are either service providers or recipients; therefore, everyone is closely affected by service industries (Chen & Ting 2002:838). Satisfied customers are likely to continue their relationship with the firm, and they are less costly to approach than new customers (Peters, Koelemeijer & Roest 1994:17).
3.2 Definition
Disconfirmation can be defined as "the consumer's subjective judgements resulting from comparing their expectations and their perceptions of performance received" (McKinney, Yoon & Fatemeh 2002:299; Fearon & Philip 2008:485). Oliver (1980:460) as cited in Niedrich, Kiryanova and Black (2005:49) further states that consumers compare their perceptions of actual service performance against some standard of performance - called a disconfirmation. Szymanski and Henard (2001:17) concluded that disconfirmation is one of the most strongly related precursors of customer satisfaction.
3.3 Expectations of consumers (employees)
Figure 1 displays Fearon and Philip's (2008:484) premise on the hierarchy of expectations related to disconfirmation. The hierarchy ranges from the highest level, being 'ideal' expectation to the lowest level being 'worst imaginable'. The highest level on the hierarchy determines the consumer's anticipation of the service quality to be obtained when making use of a product or service. The next level on the hierarchy, 'should be', is probably the most difficult expectation to obtain in practice as it underlines what a service should offer as opposed to what will be offered. In addition, this level is influenced by the external or market environment.
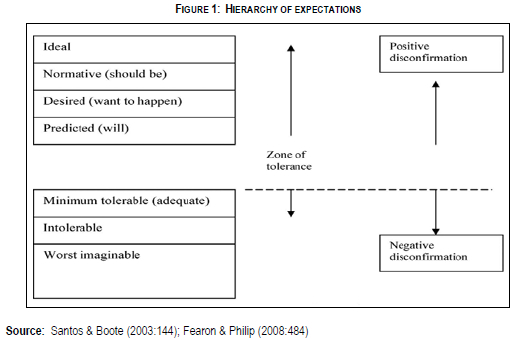
Thereafter, the desired or 'want to happen' level is a combination of two aspects, i.e. what a user believes 'can be' and what 'should be' expected with a given set of resources. The next level, the predicted or 'will-be' level refers to the expectations attained from past performance of the product or service, and are thus expected to be "realistic" predictions of expected outcomes (Fearon & Philip 2008:484). The zone of tolerance is where expectations are satisfied, that is, where outcomes match expectations (Szymanski & Henard 2001:17).
The lower levels of expectation, being minimum tolerable standards and intolerable standards, are typically associated with disconfirmation (Fearon & Philip 2008:484). Thus, expectations are thought to generate a standpoint about which one makes a comparative conclusion (Oliver 1980:460; Fearon & Philip 2008:484). Outcomes that are seemingly lower than what is expected are rated below this standpoint and are thus considered negative disconfirmation, whereas, outcomes that are higher than expected are considered positive disconfirmation (Oliver 1980:460; Fearon & Philip 2008:484). Szymanski and Henard (2001:17), are of the opinion that, "disconfirmation and satisfaction are thought to be positively correlated". The outcome of the study by Grobler and Joubert (2012:169) was that SAPS employees indicated that EAS played a significant role in their wellness. The more recent the services rendered by the EAS, the more positive the participants' perception and level of experience (client satisfaction).
Confirmation in general equates to an unbiased affective state, where the outcome is neither satisfactory nor dissatisfactory from the consumer's point of view (Erevelles & Leavitt 1992:110; Fearon & Philip 2008:485). However, several researchers propose that this interpretation does not make sense deductively and, if one receives what one expects, then satisfaction must be the end result (Hunt 1991:108; Fearon & Philip 2008:485). Therefore, if desired expectations are confirmed, then reasonably one is satisfied and the neutral state thus offers some degree of satisfaction (Fearon & Philip 2008:485). Theoretically, it is then suggested, the neutral state equates to the service being performed to the predicted state of expectation and within the zone of tolerance from the user or consumer perspective (see Figure 1). In addition, Santos and Boote (2003:147), argued that a state of positive disconfirmation could take place, where actual performance go far beyond preliminary expectations and this could lead to a high level of emotional satisfaction construed as 'delight'.
3.4 Consequences of expectations of consumers (employees)
Several researchers have focused their attention on the consequences of expectations, product performance and disconfirmation on the assessment and evaluation of products or services. Generalised distrust is considered to be a direct result of expectations and disconfirmation, and can therefore bias one's judgement in a way that has not yet been demonstrated in preceding studies. Specifically, research by Dark, Ashworth and Kelly (2010:348), indicate that negativity bias has a significant impact on the generalised trust or suspicion felt. That is, stronger sentiments for negative disconfirmation were apparent compared to the sentiments towards positive disconfirmation.
Further, cited from Dark et al. (2010:348), "...consumer distrust is another important by-product of negative disconfirmation, and that this distrust can have broader effects on product evaluations by carrying over to different firms in very different product categories." Factors, such as past experiences and promises or statements made by persons selling a product or rendering a service, have an effect on the levels of trust in the product or service. Distrust has the ability to stimulate a negative bias to individuals on the receiving end.
4. METHOD
4.1 Research design
For this purpose of this study, a cross-sectional survey design was used which allowed for the narrative of the population at an exact time, and it therefore indicated the value and extent of the expectations, perceptions and experience of participants regarding the EAS (Rindfleisch, Malter, Ganesan & Moorman 2008:261). This design can also be used for the development and validation of questionnaires (Elmes, Kantowitz & Roediger 2012:287).
4.2 Study population
The population consisted of all the employees working at the SAPS. All available employees working at the SAPS were identified as possible participants, subject to the geographical availability of the social workers and psychologists (collectively referred to as 'the EAS') (Grobler & Maree 2009:3). Participants of all nine provinces, as well as Head Office divisions, submitted certificates confirming that no employee or station had intentionally been excluded from this study (Grobler & Maree 2009:3).
4.3 Measuring instrument
The measuring instrument consisted of three parts, which were relevant to this study, namely (i) demographics, (ii) Section A (religion), and (iii) section B (EAS). The three parts of the instrument were converted to a codified optical reader system. The items of the instrument were in the form of answers to multiple-choice questions on a specially developed optical reader answering sheet for easy and accurate processing. An instruction manual was circulated to all administrators (EAS functionaries).
Variables such as age, race, gender, language, marital status, type of marriage, highest qualification, rank, period in rank, number of dependants, province of origin, province stationed at, years of service and cluster station were included in the demographical part of the instrument. The reason for the inclusion of the demographical variables was to determine statistically the differences in perceptions, opinion, experience and expectations of the various demographic groupings.
Section B consisted of questions related to (i) information; (ii) support and understanding, (iii) accessibility; (iv) availability; (v) response; (vi) confidentiality; (vii) credibility, and (viii) proactive approach. This section comprised 16 questions, determining three dimensions, namely the respondents' expectations, perceptions and experience regarding services rendered by the EAS. The participants responded to the questions on a five-point Likert scale, ranging from 1-5 where (1) signified completely disagree; (2) disagree to some extent; (3) unsure; (4) agree to some extent; and (5) totally agree. It also included two grouping variables, namely (i) the EAS in the immediate working environment, and (ii) when last the participant made use of the EAS.
4.4 Statistical analysis
The statistical analysis was carried out by means of a statistical program, Statistica. Descriptive statistics, i.e. means, skewness and kurtosis were used to analyse the data. Inter-item correlations and Cronbach's alpha-coefficients were used to measure the internal consistency of the measuring instrument (Clark & Watson 1995:310; Helms, Henze, Sass & Mifsud 2006:631). Coefficient alpha conveys important information regarding the proportion of variance contained in a scale.
ANOVA (a one-way analysis of variance) was used to ascertain the differences between the sub-groups in the sample. Tukey studentised range tests were done to indicate which groups differed significantly when ANOVAs were done (Davis 2007:397). The following formula was used to determine the practical significance of difference in means between the two groups (Ravid 2010:150):
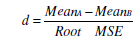
where
MeanA = mean of the first group
MeanB = mean of the second group
Root MSE = root mean square error
A cut-off point of 0.50 (medium effect) was set for the practical significance of differences between means. Pearson product-moment correlation coefficients were used to specify the relationships between the variables. A cut-off point of 0.30 (medium effect) was set for the practical significance of correlation coefficients (Wilson & Engelhard 2000:153).
5. RESULTS
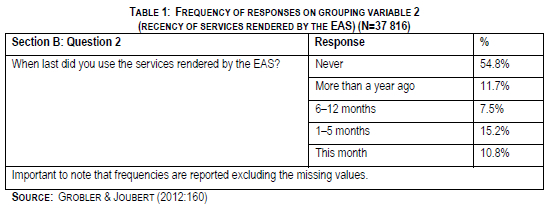
5.1 Frequency of responses
Section B of the survey had two grouping variables, namely (i) the EAS in the immediate working environment, and (ii) when the services of the EAS were last used by the employees. These results are shown in Table 1. Table 1 indicates that from the 45.2% of all employees who made use of services from the EAS, only 22.7% received such services in the last 12 months. A total of 54.8% of the employees have never used any services from the EAS because they did not have members of the EAS in their immediate working environment, or were unaware of the EAS personnel in their current working environment.
5.2 Cronbach Alpha-coefficients and inter-item correlations of dimensions
In Table 2, the Cronbach alpha-coefficients are acceptable, with the guideline application of α > 0.70 (Lehman 2005:145), together with the inter-item correlations (0.15< r > 0.50) (Mitchell & Jolley 2009:153). This is an indication that the factors have a satisfactory level of internal consistency, which forms the basis of an accurate analysis. The overall results in this table indicate that the existence of the EAS in the working environment generates a positive perception.
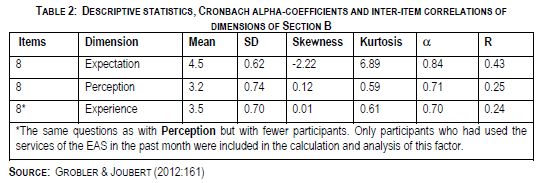
The employees at the SAPS had high expectations of the EAS, which is an indication that there is a definite need for the EAS. The employees' perceptions of the EAS regarding all the factors were lower, compared to their expectation scores. The employees' experiences were relatively higher than their perception but it was still lower than their expectations. All their experiences measured above average, with accessibility, confidentiality and credibility measuring significantly lower.
5.3 Individual items of the questionnaire
Displayed in Table 3, the kurtosis and the skewness value for the Expectation dimension exceeds the critical values of 2.00 and 7.00, respectively (Corder & Foreman 2011:62), on Confidentiality and Accessibility. The negative skewness values varies from -2.6 and -2.9, which indicates that the distribution has few low values and tails off to the left. The kurtosis values vary from 7.2 to 8.8, on Confidentiality and Accessibility. The distribution of the Overall Expectation scores are between 2.2 and 6.9 on kurtosis and skewness respectively, which indicates a very high expectation for the EAS. Because of the relatively skew Overall Expectation distribution, it is only necessary to report on its magnitude in relation to the dimensions of Experience and Perception. The distribution is not normal and therefore restricts the probability of significant differences between the groups. The Overall Expectation and the other Expectation will not be analysed further.
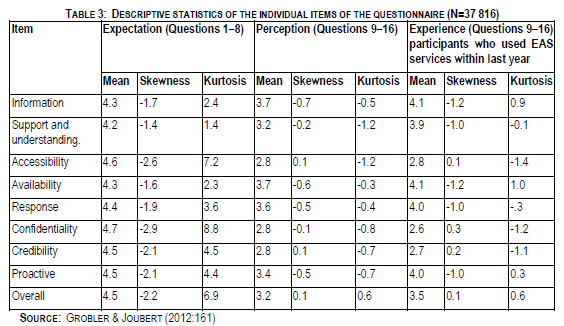
All other scores on the Experience and Perception dimensions are within the parameters of a normal distribution. The Overall Experience dimension is higher than the perception, which indicates client satisfaction, although Confidentiality and Credibility measured lower.
5.4 Comparative analysis
A one-way ANOVA test analysed the Overall Perception dimension, which is then followed by Tukey studentised range post hoc tests, which determined the statistical significant differences on the dimension. The employees with EAS personnel in their current working environment, those employees who were not aware of the EAS services and those employees who did not have EAS personnel in their current working environment were compared with one another in terms of their Overall Perception rating. These results are reported in Table 4. Furthermore, Table 4 indicates the differences in Overall Perception dimension between employees who have never used the EAS services, and those employees who have used the EAS services at specific time intervals.
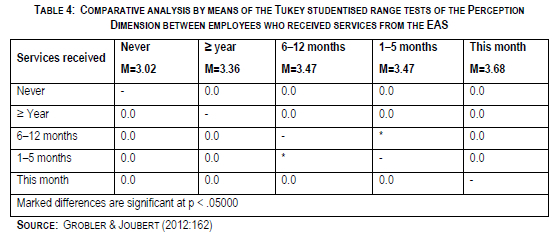
The results in the above table indicate the range of Overall Perception mean scores between employees who had never received EAS services (3.02) to a mean score of 3.68 of the employees who had used the EAS services in the past month. There is a firm increase in the Overall Perception mean score, the shorter the time interval in which the services of the EAS were used, all differences significant at p < .05000.
6. DISCUSSION
Social-cognitive theorists agree with traditional behaviourists that theories of human nature should be tied to observable behaviour. Nevertheless, factors within the person, for instance expectancies and the values placed on particular goals, need to be considered in explaining human behaviour (Nevid, Rathus & Greene 2011:53). Bergh (2011:207) concluded that a person's self-beliefs and events to which one is exposed influence internal motivation.
Furthermore, he argued that management of an organisation has a significant impact on the environment in which the individual functions and can influence the way in which employees perceive proceedings within the organisation. Niedrich, Kiryanova and Black (2005:54) argued that it is important to make a theoretical distinction between a pre-consumption standard and a post-consumption standard in formulating a disconfirmation judgment. As a result, the structure of this hierarchy, i.e. the expectations, perceptions and experiences are derived from the "pre-consumption standard", which can be linked with the concepts that were measured in this study ('expectation' and 'perception').
6.1 SAPS employees' expectation of EAS services
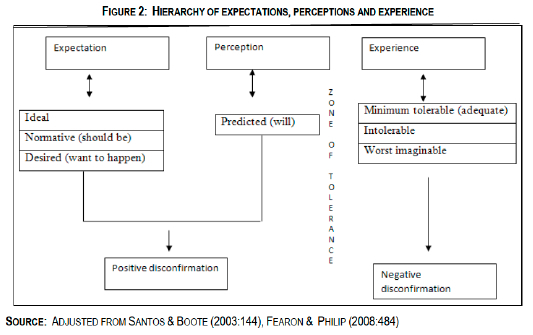
SAPS employees had a high expectation of EAS services, which is an indication that there is a definite need for such services. Employees developed an ideal expectation on what the services 'should be' and what they 'want to happen' during these services. Consequently, employees developed a perception, 'predicted (will)', of EAS. Feelings of satisfaction occur when employees evaluate their perceptions of service performance to both their desires and expectations. Additionally, feelings with the information regarding the EAS were based on the employees' expectations, such as those communicated by marketing information, i.e. pamphlets (Spreng et al., 1996:15). Fearon and Philip (2008:485) argued that 'information satisfaction' could be a clear source of conflict if guaranteed levels of service quality are not achieved. As a result, it can be concluded that information creates perceptions of EAS with the SAPS employees. It is assumed that perceptions can increase the level of expectation through information satisfaction. It can therefore create a positive disconfirmation (see Figure 2).
6.2 SAPS employees' experience of EAS services
The employees' experiences were relatively higher than their perceptions but it is lower than their expectations. Evidence suggests that perception is influenced by heredity (nature) as well as learning (nurture) and that it is a selective process which shapes employees' awareness of their reality, which aids them when assigning meaning and interpreting external factors (Bergh & Theron, 2009:116 & 123). Santos and Boote (2003:145) argued that the predicted ^will-be' standard originates from past experience with a service and from an employee's perception of typical service performance. Consequently, the employees at the SAPS had high expectations of EAS, which is an indication that there is a specific need for such services, i.e. EAS (figure 3). By means of communication and marketing strategy employees could be nurtured by EAS.
Confirmation equates to an unbiased affective position, where the result 'experience' is neither satisfactory nor dissatisfactory from the consumer perception (Fearon & Phillip, 2008:485; Lee, Damhorst, Campbell, Loker & Parsons, 2011:325). In this study, it was not found that employees experienced an unbiased effective position (zone of tolerance). However, it was also found that the employees experienced a negative disconfirmation since their experiences are lower than expected.
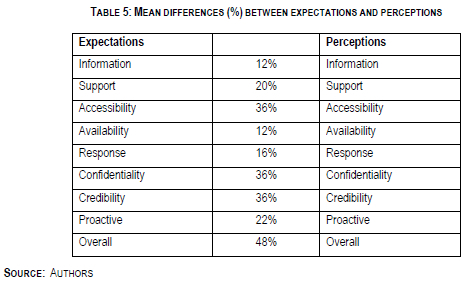
Physical service factors (information, support, accessibility, availability, response, confidentiality, credibility and proactive) were used to measure the experiences of SAPS employees in terms of expectation standards (minimum tolerable, intolerable and worst imaginable). Santos and Boote (2003:146) (Figure 2) argued that the expectation standard ('minimum tolerable' and 'intolerable') might come from the grapevine or personal experiences that emanated from bad memories and the employees' wish that this experience would never happen again. With reference to Figure 3, the mean difference between expectation and experience brings forth the argument that minimum tolerable expectation standards influence the experiences with regard to the following factors: proactive (10%), response (8%), availability (4%), support (6%) and information (4%).
The worst imaginable level expectations could be influenced through contact with advertisements, e.g. pamphlets. This creates a lower than intolerable level experience. Further to our argument (Table 5), worst imaginable expectations are influenced by means of credibility (42%), confidentiality (36%) and accessibility (36%). The overall mean difference between expectation and experience resulted to 20%. This confirms that the SAPS employees experienced a negative disconfirmation regarding EAS.
7. CONCLUSION
The main aim of the research study was to report on the importance of EAS on the SAPS employees. The study founded that there is a need for such services, which plays a significant role in the employees' wellness. This article, however, was to revise and expand on the expectation disconfirmation model based on previous literature and generates recommendations regarding it. It was found that the model is potentially valuable in understanding the relationship between the perceptions and expectations of the SAPS employees. In addition, it would also be useful in studying and validating this model within different industries. It can also be suggested that the perceptions of the SAPS employees could be further investigated, thus adding a new focal point to research.
Positive disconfirmation can also be addressed in terms of the means difference between experience and perception. Supplementary to this, the future purpose is to determine client satisfaction and explore the perception of prospective non-clients. Ethical constructs of the physical services also needs to be studied. The results obtained in this study indicate that there is a negative disconfirmation influenced by physical EAS factors in the SAPS. The model under discussion continues to dominate marketing research and managerial practices, and has comparable influences with regard to the EAS and pertaining to an expectation disconfirmation paradigm.
REFERENCES
BERGH ZC & THERON AL. 2009. Psychology in the work context. 4th ed. Cape Town: Oxford University Press. [ Links ]
BERGH Z. 2011. Introduction to work psychology. South Africa: Oxford University Press [ Links ]
CHEN C & TING S. 2002. A study using the grey system theory to evaluate the importance of various service quality factors. International Journal of Quality & Reliability Management, 19 (7):838-861. [ Links ]
CHOU S, CHEN T, WOODARD B & YEN M. 2005. Using SERVQUAL to evaluate quality disconfirmation of nursing service in Taiwan. Journal of Nursing Research, 13 (2):75 - 83. [ Links ]
CLARK LA & WATSON D. 1995. Construct validity: Basic issues in objective scale development. Psychological Assessment, 7:309-319. [ Links ]
CORDER GW & FOREMAN DI. 2011. Nonparametric statistics for non-statisticians: a step-by-step approach. Hoboken NJ: Wiley. [ Links ]
DARK PR, ASHWORTH L & KELLEY JM. 2010. Great expectations and broken promises: misleading claims, product failure, expectancy disconfirmation and consumer distrust. Journal of the Academy of Marketing Science, 38:347-362. [ Links ]
DAVIS J. 2007. Statistics using SAS enterprise guide. Cary, NC: SAS Institute. [ Links ]
ELMES DG, KANTOWITZ BH & ROEDIGER HL. 2012. Research methods in psychology. 9th ed. Wadsworth USA: Wadsworth. [ Links ]
EREVELLES S & LEAVITT C. 1992. A comparison of current models of consumer satisfaction/dissatisfaction. Journal of Consumer Satisfaction, Dissatisfaction and Complaining Behavior, 5:110-114. [ Links ]
FEARON C & PHILLIP G. 2008. Measuring success of electronic trading in the insurance industry: operationalising the disconfirmation of expectations paradigm, Behaviour & information Technology, 27(6):483-493. [ Links ]
GROBLER A & JOUBERT YT. 2012. Expectation, perceptions and experience of the EAS in the SAPS. Journal of Contemporary Management, 9: 150-171. [ Links ]
GROBLER A & MAREE C. 2009. The value and extent of religious participation of the South African Police Service's employees; Expectations, perceptions and experience of the South African Police Service's employees regarding the Employee Assistance Services (EAS). (Unpublished report presented to SAPS management on 8 May 2009. [ Links ])
HELMS JE, HENZE KT, SASS TL & MIFSU, VA. 2006. Treating Cronbach's Alpha reliability coefficients as data in counseling research. The Counseling Psychologist, 34(5):630-660. [ Links ]
HOSSAIN MA & QUADDUS M. 2012. Expectation-confirmation theory in information system research: a review and analysis. [Internet: Available from http://www.springerlink.com/content/r77q0433482k7u03/fulltext.pdf; downloaded on 2012-08-20]. [ Links ]
HUNT H. 1991. Consumer satisfaction, dissatisfaction and complaining behavior. Journal of Social issues, 24:107-117. [ Links ]
JACOBSON JM & ATTRIDGE M. 2010. Employee assistance programs (EAPs): an allied profession for work/life. In S Sweet & J. Casey (eds.), work and family encyclopaedia. Chestnut Hill, MA: Sloan work and family research network. [Internet: Available from http://wfnetwork.bc.edu/encyclopedia_entry.php?id=17296&area=All; downloaded on 2012-08-20]. [ Links ]
LEE H, DAMHORST ML, CAMPBELL JR, LOKER S & PARSONS JL. 2010. Consumer satisfaction with a mass customized internet apparel shopping site. international Journal of Consumer Studies, 35:316-329. [ Links ]
LEHMAN A. 2005. JMP for basic univariate and multivariate statistics: a step-by-step guide. Cary, NC: SAS Institute. [ Links ]
MCKINNEY V, YOON L & FATEMEH MZ. 2002. The measurement of web-customer satisfaction: an expectation and disconfirmation approach. information Systems Research, 13:296-315. [ Links ]
MITCHELL ML & JOLLEY JM. 2009. Research design explained. Belmont, CA: Thomson Higher Education. [ Links ]
NEVID JS, RATHUS SA & GREENE B. 2011. Abnormal Psychology in a changing world. 8th ed. Upper Saddle River: Pearson. [ Links ]
NIEDRICH RW, KIRYANOVA EL & BLACK WC. 2005. The dimensional stability of the standards used in the disconfirmation paradigm. Journal of Retailing. 81 (1): 49 - 57. [ Links ]
OLIVER RL. 1980. A cognitive model of the antecedents and consequences of satisfaction decisions. Journal of Marketing Research, 17(4):460-469. [ Links ]
OLIVER RL. 2010. Satisfaction: a behavioural perspective on the customer. 2nd ed. NY: M.E. Sharpe. [ Links ]
OLIVER RL & BEARDEN WO. 1985. Disconfirmation processes and consumer evaluations in product usage. Journal of Business Research, 13:235-246. [ Links ]
PETERS R, KOELEMEIJER K & ROEST H. 1994. Assimilation processes in service satisfaction formation. International Journal of Service Industry Management, 6(3): 17-33. [ Links ]
RAVID R. 2010. Practical statistics for educators. 4th ed. Lanham, MD: University Press of America. [ Links ]
RINDFLEISCH A, MALTER AJ, GANESAN S & MOORMAN C. 2008. Cross-sectional versus longitudinal survey research: concepts, findings, and guidelines. Journal of Marketing Research, 45: 261-279. [ Links ]
SANTOS J & BOOTE J. 2003. A theoretical exploration and model of consumer expectations, post-purchase affective states and affective behavior. Journal of Consumer Behaviour, 3:142-156. [ Links ]
SPRENG RA, MACKENZIE SB & OLSHAVSKY RW. 1996. A reexamination of the determinants of consumer statisfaction. Journal of Marketing, 60(3):15 - 32. [ Links ]
SPRENG RA & CHIOU J. 2002. A cross-cultural assessment of the satisfaction formation process. European Journal of Marketing, 36(7/8):829-839. [ Links ]
SZYMANSKI DM & HENARD DH. 2001. Customer satisfaction: A meta-analysis of the empirical evidence. Journal of the Academy of Marketing Science, 29:16-35. [ Links ]
VENKATESH V & GOYAL S. 2010. Expectation disconfirmation and technology adoption: polynomial modelling and response surface analysis. MIS Quarterly, 34(2): 281-303. [ Links ]
WILSON M & ENGELHARD G. 2000. Objective measurement: theory into practice. Vol. 5. Norwood: Ablex. [ Links ]
YI Y & LA S. 2003. The moderating role of confidence in expectations and the asymmetric influence of disconfirmation on customer satisfaction. The Service Industries Journal, 23(5): 20-47. [ Links ]

