


Serviços Personalizados
Artigo
 Inglês (pdf)
 Artigo em XML
 Referências do artigo
Indicadores

Links relacionados
-
 Citado por Google
 -
 Similares em Google
Compartilhar

 Permalink
Journal of Contemporary Management
versão On-line ISSN 1815-7440
JCMAN vol.9 no.1 Meyerton 2012
RESEARCH ARTICLES
Push and pull factors of national parks in South Africa
E Slabbert; P Viviers
North-West University, TREES, School of Business Management
ABSTRACT
South Africa's national parks are one of South Africa's major attractions. Since visitors are among the most important role players in the sustainability of these parks, and in-depth research is needed to understand them, this article analyses the push and pull factors that bring them to the parks. The study used a structured questionnaire to collect data on these factors and the socio-demographic profile of the visitors. Surveys conducted at nine National Parks produced 1300 questionnaires. The factor analysis identified two push and three pull factors underlying visitors' motives for visiting the parks. Differences in the push and pull factors for different socio-demographic subgroups were examined. It was clear that visitors are pushed to parks to relax, and pulled by nature as a product. It was also found that age, whether accompanied by children, province of residence, educational level and home language had a significant influence on the push and pull factors. With the current number of other tourism products competing for nature based tourists, this type of information can ensure that the most appropriate marketing messages are communicated to potential visitors and that the parks are sustained.
Key phrases: national parks, push factors, pull factors, socio-demographic characteristics
1 INTRODUCTION
National parks offer visitors an unparalleled diversity of tourism opportunities, including game viewing, bush walks, canoeing and exposure to culture and history. These parks contribute significantly to society by preserving nature and at the same time promoting enjoyment through tourism (Honey 2008:405). National parks around the world have been recognised as important sources of nature experiences for both local and international visitors. South Africa's national parks are similarly important recreational and nature tourism attractions. SANParks (South African National Parks), established in 1926, is one of the world's leading conservation and scientific research bodies and a leading agent in maintaining the country's indigenous natural environment. SANParks manages a system of 21 parks representing the indigenous fauna, flora, landscapes and associated cultural heritage of South Africa, and covering 3,751,113 hectares of protected land (SANParks 2011 : Internet). Fifteen of the 21 parks offer park or camp-run accommodation which can accommodate almost 12,000 overnight guests. SANParks received 4.7 million visitors in 2008 and 4.3 million in 2009 (SANParks 2011 : Internet).
The top five South African National Parks in 2009 and 2010, i.e. those that received the highest number of visitors, were Table Mountain National Park, Kruger National Park, West Coast National Park, Tsitsikamma National Park and Addo National Park. Three of these experienced an increase in visitor numbers from 2009 to 2010, while two of them, Table Mountain and Addo, experienced a slight decrease, Table Mountain by 67,293 visitors and Addo by 1,816 (see Table 1) (SANParks 2010:34).
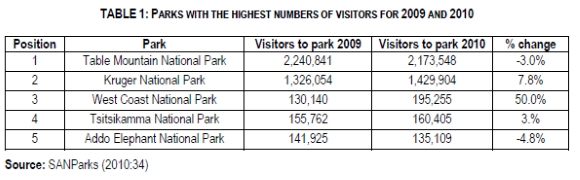
Table 2 shows that visitor numbers to SANParks are declining mostly in the international market, which demands the investigation of visitors' preferences.
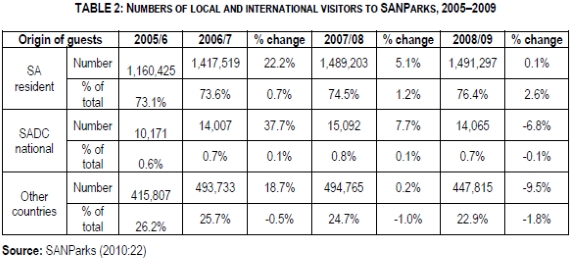
South Africa's tourism industry maintained a growth of 6% between 2005-2009, with steady increases in the number of visitors from foreign markets. However, world tourism experienced an estimated decline of 5% during 2009, mostly because of the recent economic recession and the trend towards staying closer to home and travelling for shorter periods. Africa, on the other hand, as a whole experienced a 4% increase in international tourist numbers. Although the tourism industry is growing in Africa and particularly in South Africa, SANParks experienced a decline in tourist numbers from their top five international markets over the previous four years (SANParks 2010:22).
A study by Mehmetoglu (2007:213) suggests that tourists are showing increasing interest in nature-related activities and also shows that tourists interested in nature activities spend more money than those interested in activities not directly related to nature. Despite the importance of the South African national parks as a nature-based destination, however, very little is known about the factors that influence the behaviour of visitors to these parks. Such knowledge might increase the number of visitors and assist in park product development. As competition from other attractions increases, it becomes more important to understand the factors that push people to travel and those that pull them to certain destinations. This research attempted to fill this gap by examining these factors in relation to national parks in South Africa.
2 LITERATURE REVIEW: UNDERSTANDING PUSH AND PULL FACTORS
Motivation is one of the most important variables for explaining travel behaviour (see for example Kruger & Saayman 2010:94), especially when it comes to tourism products such as national parks, which offer more than just a leisure experience. Analysing tourist motivation helps managers and marketers of national parks to understand a traveller's choices, needs and preferences (Bansal & Eiselt 2004:388). Such knowledge is important for improving the tourism product and developing marketing strategies, promotional activities and product design (Williams 2002:13). Various models have been developed to explain tourist motivation, such as Maslow's Motivation Theory (1943), Crompton's socio-psychological motives (1979) and the push and pull factors identified by Dann (1977). A number of studies have used the push and pull framework, and research by Kozak and Baloglu (2011:6) as well as Prayag and Ryan (2011:122) indicates that travel patterns can be distinguished by certain pull and push factors that influence travel decisions and destination choice. These two forces explain how, when making their travel decisions, travellers are pushed or obliged by certain motivational variables and pulled or attracted by certain destination attributes (Sirakaya & Woodside 2005:829).
The push-pull framework is useful for examining the motivations underlying tourist and visiting behaviour (Dann 1977:188; Klenosky 2002:385; Smith, Costello & Muenchen 2010:19). Push factors are the forces that influence a person's decision to take a holiday (for example to relax), while pull factors are those that influence the person's decision to select one destination over another (destination attributes). In other words, push motivations are related to the traveller, while pull motivations are related to the destination (Yoon & Uysal 2005:46).
2.1 Push factors
'Push' factors have been described as motivational factors or needs that arise due to a state of disequilibrium or tension in the motivational system (Dann 1977:188; Iso-Ahola 1982:256-261; Morrison 2010:551). They are therefore related to the needs and wants of the traveller, such as the desire for escape, prestige, relaxation and rest, fitness and health or social interaction (Chhabra 2010:61; Gómez-Borja, Romero, Descals & Jiménez, 2010:222). A study by Jang and Wu (2006:311) of the travel motivations of Taiwanese senior travellers revealed five push factors: ego enhancement, self-esteem, knowledge-seeking, relaxation and socialising. In the context of national parks, a study by Uysal, McDonald and Martin (1994:21) of Australian visitors to US national parks revealed the following five factors: prestige, escape, enhancement of kinship relationships, novelty and - a factor that tested very strongly - relaxation and hobbies.
A study by Kim, Lee and Klenosky (2003:174) in Korean national parks identified the following factors: appreciating natural resources and health, family togetherness and study, escaping from routine, and adventure and building friendships. Two other studies conducted in Korean national parks found factors such as learning about religious heritage and health enhancement, climbing and friendship building (Ahn & Kim 1996:32; Jeong 1997 as cited by Kim et al. 2003:171).
Wang (2004:371) studied travellers' motivations for visiting mountain resorts in China and found that the three most important push factors were relaxation and health, appreciating natural scenery, and acquiring knowledge. A comparative study of what motivates visitors to the Tsitsikamma and Kruger National Parks (Kruger & Saayman 2010:99) revealed escape and nostalgia as push factors for the former and nostalgia and escape and relaxation for the latter. Chan and Baum (2007:361) studied the motivations of ecotourists in ecolodge accommodation in Malaysia and found that the main push factors were to escape from normal daily routine and a sense of self-fulfilment. It is clear that visitors to national parks are influenced by a variety of push factors, such as relaxation, health, social interaction, family togetherness and prestige.
2.2 Pull factors
Pull factors are external factors consisting of features, attractions or attributes of the destination (Kotler, Bowen & Makens 2006:561). They are tangible elements (Kozak 2002:222), as opposed to the traveller's intrinsic needs and desires, the push factors. They are the extrinsic source of motivation, the more external, situational aspects, but also include cognitive components in the form of the individual's own knowledge and belief about a destination (Beerli & Martin 2004:664). Pull factors are often associated with a specific destination or area - which means they are less global and more situation specific (Luo & Deng 2008:393). Examples of pull factors are beaches, mountains, historic resources, animals, plants or scenery that 'pull' a visitor to a certain destination.
Several studies of pull factors have been reported in the travel and tourism literature. Witt and Mountinho (1989:99) suggest that three important components of destinations make them act as 'pull forces' to visitors: (1) static factors, which include climate, distance to travel facilities, historic or cultural features, and cultural and natural landscapes; (2) dynamic factors, which include accommodation and catering services, entertainment or sport, personal attention, trends in tourism, and political atmosphere; and (3) current decision factors, which include marketing strategies and prices in both the destination region and the tourist's area of origin. Mosteller (1998 as cited by Awaritefe 2004:307) argues, however, that although it is valid to describe specific climate, sites and destination facilities and situations as motivational factors, nevertheless people are more complex than that - they are not moved simply by the forces of destination marketing, economics, amenities and facilities. Their destination choosing process may also depend on their assessment of the destination's attributes and how they perceive its utility values.
Numerous attempts have been made to classify the major attraction elements of destinations. Using a sample of visitors to a well-known winter destination in Texas, Fakeye and Crompton (1991:13) classified six pull factors on the basis of 32 attributes. These factors were social opportunities and attractions; natural and cultural amenities; accommodation and transport; infrastructure, food and friendly people; physical amenities and recreation activities and bars and evening entertainment. Hsu, Tsai and Wu (2009:294-295) analysed reasons why tourists choose Taipei as a holiday destination. They identified self-actualisation, meeting new friends, medical treatment, night life, transport facilities, quality and variety of food, accommodation facilities, shopping, and personal safety as the main pull factors.
There have been various studies of pull factors in national parks. Kim et al. (2003:175) classified three pull factors - tourist resources, information and convenience of facilities, and accessibility and transport. Kruger and Saayman (2010:98) found that for the Kruger National Park the pull factors were activities, park attributes and knowledge-seeking, and that for the Tsitsikamma National Park they were nature experience, photography and park attributes. Empirical evidence by Chan and Baum (2007:361) shows that natural attractions, wildlife, local lifestyle and cultural resources and eco-activities (such as game drives and hiking) were important pull factors for ecotourists in Malaysia.
In conclusion, pull factors for national parks are likely to differ according to the country or the location of the park. However, resources, activities and natural attractions seemed to be the major pull factors overall. Knowing the pull factors that draw tourists to any country's national parks is essential for promoting and planning these tourism products. Park managers and marketers need to understand the visitors' behaviour and choices and keep up with developing trends, especially given the current number of tourism products competing with the parks, especially in South Africa. This type of information can ensure that the most appropriate marketing messages are communicated to potential visitors.
In support of the notion that many factors influence the travel decision, researchers such as Devesa, Laguna and Palacios (2010) and Van der Merwe, Saayman and Krugell (2007) agree that socio-demographic characteristics have an effect on activity, participation and travel behaviour. Jang, Bai, Hong and O'Leary (2004:333) found that socio-demographic variables can be used to explain not only travel behaviour but also the relationship between variables. However, no South African study could be found that combined the push-pull framework and socio-demographic analysis in order to enhance our understanding of the SANParks visitors' travel motivations. This study therefore aimed to (1) identify the push and pull factors that influence decisions to visit South African National Parks and (2) investigate differences between these push and pull factors for different socio-demographic groups.
2.3 Relationship between travel motivation and socio-demographic characteristics
Stabler (1988:140) suggested that socio-demographic variables such as age, occupation, and income are important factors influencing tourists' perceptions of the travel experience.
Woodside and Lysonski (1989:8-14) found that tourists' perceptions of a destination are influenced by destination attributes and also traveller variables such as age, income, past experiences, and personal values. Baloglu (1997:224) found that socio-demographic and trip characteristics motivated West German travellers to the US and directly affected their image of the destination. Weaver et al. (1994 as cited by Heung, Qu & Chu 2001:261) found that age was a discriminating demographic variable that influenced the choice of destination; for example, travellers under 45 years of age tended to opt for novelty-seeking. Zimmer et al. (1995:8) found that income and education influenced travellers when deciding between nearby and more distant destinations; for example, those who were better educated and had more disposable income tended to travel further from home.
Kim et al. (2003:173) also found that age and occupation had a significant influence on push and pull factors, and that gender and income had a moderately significant influence. Nickerson and Jurowski (2000:20) as well as Wang, Hsieh, Yeh and Tsai (2004:184) found that children play an important role in family travel decision-making. Laws, Faulkner and Moscardo (1998:412) indicated that age, income, marital status and language had a direct influence on the travel decisions made by the Japanese travel market. In a study done at arts festivals in South Africa it was found that language and province can influence certain travel decisions (Saayman & Saayman 2006:219).
Preference sets and destination attributes can be matched to specific socio-demographic profiles of tourists. For example, the escape-relaxation group prefers destinations where nightlife, entertainment and water sports are provided, whereas the social status group values golf, fishing, shopping and gambling (Moscardo et al. 1996:117; Witt & Wright 1992:51). As motivation is a dynamic concept, Uysal and Hagan (1993:807) conclude that motivations may vary from one person to another, from one market segment to another, from one destination to another, and from one decision-making process to another. The findings of some other studies confirm that demographic profiles and preferred tourist activities vary according to country of origin (Armstrong, Mok, Go & Chan 1997:184; Huang, Huang & Wu 1996:240-241; Kozak 2002:230). The resulting differences in customer attitudes and behaviour should be taken into account by destination management exploring the features of each customer group, segmenting tourism markets and releasing new marketing strategies that are appropriate for each market. Baloglu (1997:230) suggests that different promotional strategies should be addressed to different segments of travellers with different travel motives.
3 METHOD OF RESEARCH
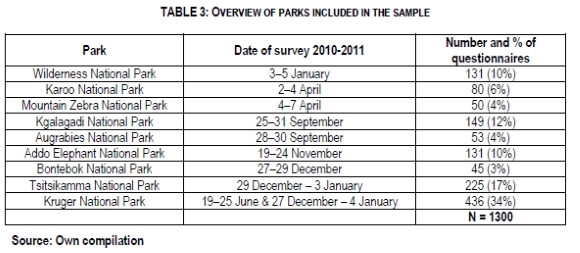
To identify the push and pull factors and the socio-demographic characteristics of national parks visitors, a visitor survey was conducted in 2010 in nine South African National Parks (see Table 3). Research teams comprising a leader and fieldworkers approached visitors at their chalets and in the camp sites and asked them to fill in a questionnaire, one per household. The research project was explained to them, and only those willing to participate completed a questionnaire, which was collected on the same evening. The questionnaire had been used in various park related research and was adapted to suit the needs of this research. More or less 1500 questionnaires were distributed in the various parks however 1300 was satisfactorily completed.
Push and pull factors were measured using a scale consisting of 15 aspects. Respondents were asked to indicate their level of agreement or disagreement on a five-point Likert scale. Independent variables such as demographics were measured by means of open and closed ended questions. Microsoft Excel was used to capture the data and descriptive analyses were conducted using both Excel and SPSS (SPSS Inc. 2007). Factor analyses were performed on the push and pull factors, followed by ANOVA and t-tests to compare the identified factors with certain socio-demographic characteristics of respondents.
4 RESULTS
The results comprise three sections - a demographic profile of the respondents, an analysis of push and pull factors, and an analysis of the correlations between push and pull factors and certain demographic variables.
4.1 Demographic profile of respondents
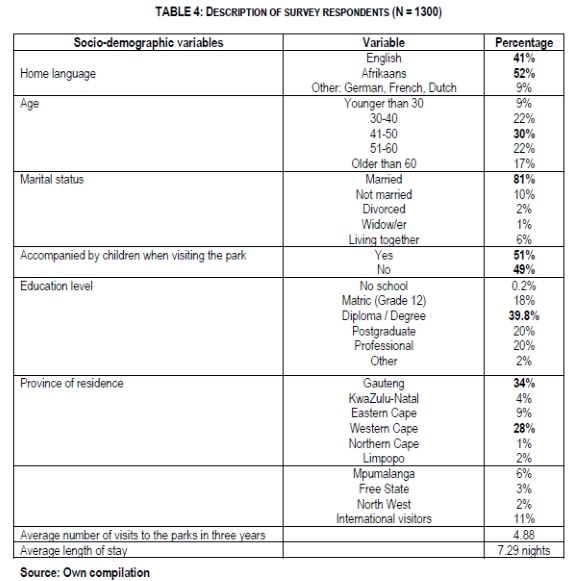
Table 4 summarises the demographic profile of the respondents. The largest percentage were between 41 and 50 years of age (30%), married (81%), held a degree or diploma (39.8%) and were either Afrikaans (52%) or English (41%) speaking. They lived mainly in Gauteng (34%) and the Western Cape (28%) and had visited national parks on average 4.88 times in three years and stayed for an average of 7.29 nights during their visit.
4.2 Push and pull factor analyses
4.2.1 Push factors
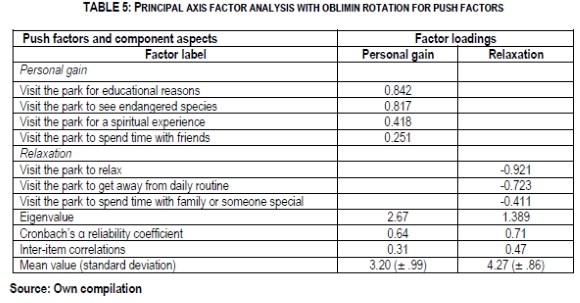
To examine the factors underlying the push and pull factors scales, a principal axis factor analysis with oblique rotation (direct oblimin) was undertaken. The seven push factor aspects yielded two factors with eigenvalues greater than 1.0 (Field 2005:633). These factors explained 58% of the variance and were labelled: 'Personal gain' and 'Relaxation'. Six aspects had factor loadings of over 0.418, with only one item having a factor loading of 0.251. However, Stevens (1992:378-380) says the significance of a factor loading will depend on the sample size and recommends that for a sample size of 1000 it should be greater than 0.162. Reliability (Cronbach's a) was computed to verify the internal consistency of aspects with each factor. Both factors with a Cronbach Alpha above 0.63 were deemed acceptable for the purposes of this exploratory study. Bartlett's test of sphericity was significant (p<0.001) and the Kaiser-Meyer-Olkin measure of sampling adequacy (KMO) was 0.687, which are acceptable. 'Personal gain' included push factors such as visiting the park to learn, to see endangered species, for a spiritual experience and to spend time with friends.
Factor 2 was labelled 'Relaxation' and constituted push factors such as to relax and to get away from daily routine. 'Relaxation' (Factor 2) revealed a significant higher mean than 'Personal gain' (Factor 1) and it is clear that respondents consider a holiday in the park as a time to relax. The component correlation matrix indicates a medium correlation (0.392) between the two factors and therefore they can relatively be seen as related to each other (see Table 5).
4.2.2 Pull factors
Table 6 reveals a similar principal axis factor analysis for the eight pull aspects, resulting in three pull factors which had eigenvalues greater than 1.0. The factors accounted for 67% of the variance and were labelled 'Park activities', 'Park attributes' and 'Educational value'. The factor loadings of the eight aspects ranged from 0.339 to 0.801. The reliability alphas for the three factors were above 0.57. Factor 1 was labelled 'Park activities' and included aspects such as to learn about animals, to photograph plants and animals and to explore a destination. This factor revealed a mean value of 3.47. Factor 2, labelled 'Park attributes' included aspects related to the park such as getting value for money, using the accommodation, and considering parks the ideal holiday destination. This factor yielded the highest mean of the pull factors and can therefore be considered the most important pull factor. Lastly, Factor 3 was labelled 'Educational value' and constituted learning about nature and teaching children about nature.
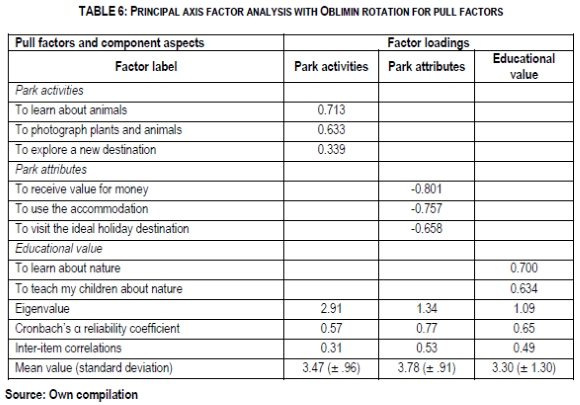
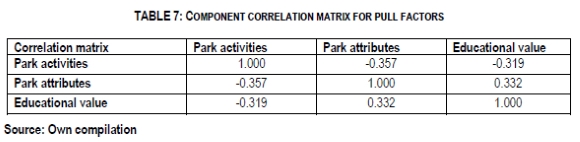
The component correlation matrix indicated medium correlations between factors and therefore the factors can be seen as related to each other (see Table 7).
4.3 Comparison of push and pull factors with socio-demographic variables
The differences in the importance of push and pull factors for various socio-demographic groupings are analysed in this section. One-way analysis of variance (ANOVA) was conducted to explore the effect of age, province of residence, qualifications and home language on the push and pull factors. The mean scores show that push and pull factors were significantly different at the p<0.001 level of significance. Post-hoc comparisons using the Tukey HSD test indicated the significant differences. An independent-samples t-test was conducted to compare the push and pull factors for people with and without children.
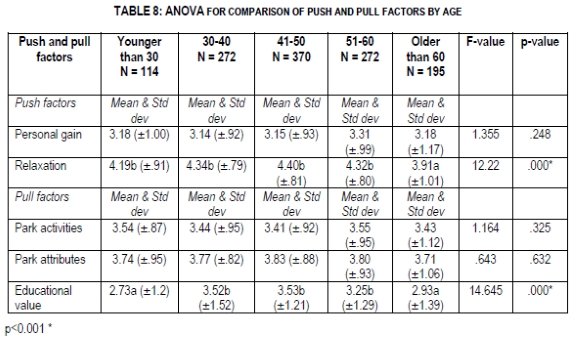
4.3.1 Comparison by age
For 'Relaxation' as push factor, the ANOVA revealed that respondents over 60 (M=3.91, SD=1.01) considered relaxation an important reason for visiting the park, but this factor was not as important for them as it was for the other age groups. Respondents over 60 (M=2.93, SD=1.39) and under 30 (M=2.73, SD=1.2) did not consider the pull factor 'Educational value' to be as important a reason as the other age groups did (see Table 8).
4.3.2 Comparison by children
An independent-samples t-est was conducted to compare the push and pull factors for people with children at the park and those without. Table 9 shows significant statistical differences (p<0.05) between the scores for people accompanied by children and those not accompanied by children for two push factors and one pull factor. Respondents with children rated the push
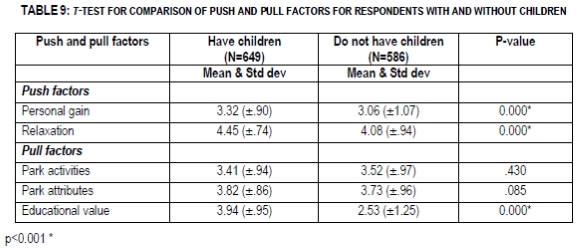
factors 'Relaxation' (M=4.45, SD=.74) and 'Personal gain' (M=3.32, SD=.90) and the pull factor 'Educational value' (M=3.94, SD=.95) more highly than those without.
4.3.3 Comparison by province of residence
Table 10 shows that respondents from Gauteng rated the push factors 'Personal gain' (M=3.30, SD=.97) and 'Relaxation' (M=4.43, SD=.72) higher than respondents from other provinces.
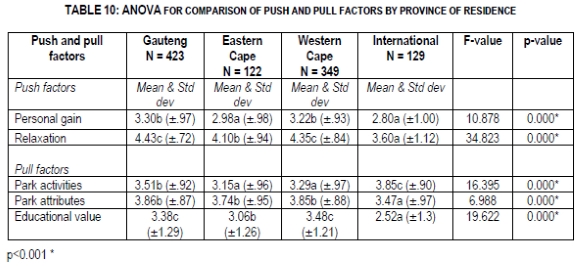
International respondents rated 'Park activities' (M=3.85, SD=.90) higher than respondents from Gauteng and the Eastern Cape. Respondents from Gauteng and the Western Cape rated the pull factor 'Park attributes' (M=3.86, SD=.87; (M=3.85, SD=.88) higher than the international visitors. Lastly, respondents from the Western Cape rated 'Educational value' (M=3.48, SD=1.21) higher than respondents from the Eastern Cape and international respondents. No similar comparison has been found in any other study.
4.3.4 Comparison by qualifications
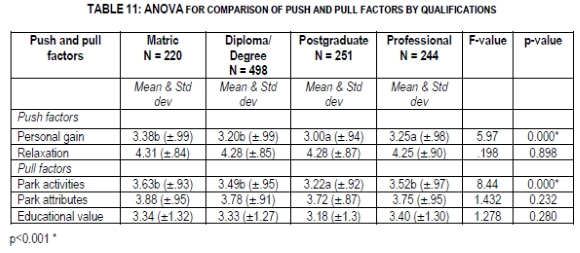
Table 11 shows that respondents with a matric (grade 12) qualification rated the push factor 'Personal gain' (M=3.38, SD=.99) and the pull factor 'Park activities' (M=3.63, SD=.93) higher than respondents with a postgraduate qualification.
4.3.5 Comparison by home language
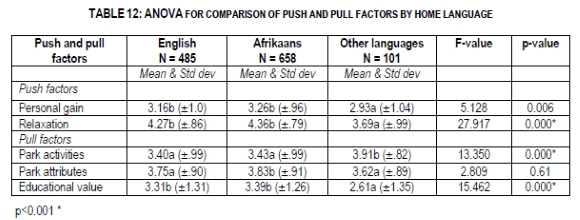
Table 12 shows that English and Afrikaans speaking visitors rated the push factor 'Relaxation' (M=4.27, SD=.86; M=4.36, SD=.79) higher than respondents speaking other languages. Afrikaans and English speaking visitors are mainly South Africans and this suggests that the locals visit parks mainly to relax. However, respondents speaking other languages are more attracted than the English and Afrikaans speaking respondents by the pull factor 'Park activities' (M=3.91, SD=.82). Respondents speaking other languages mainly included international visitors and this group of visitors want to participate in park activities. When analysing the last significant difference it is interesting to see that the respondents speaking other languages do not rate the pull factor 'Educational value' as highly as do the English and Afrikaans speaking visitors. They are therefore more attracted by the sight-seeing value of the park. No similar comparison could be found in other studies.
5 FINDINGS
Firstly, the results revealed two specific push factors, 'Relaxation' and 'Personal gain'. 'Relaxation' (including aspects such as to relax, to get away from routine) has been identified by various researchers as a push factor (Jang & Wu 2006:311 ; Wang 2004:371). Chan and Baum (2007:359) and Kim et al. (2003:174) refer to this as 'escaping from routine'. It is clear that 'Relaxation' remains a strong push factor which is adding value to the tourism value of parks. 'Personal gain' (which includes aspects such as to see endangered species, to spend time with friends and for educational reasons) has also been identified by researchers as a push factor. Jang and Wu (2006:311) categorise personal gain as two factors: 'socialisation' and 'knowledge-seeking'. The study by Uysal et al. (1994:21) labelled this as the "enhancement of kinship relationships" and Kim et al. (2003:174) labelled this factor as 'building friendships'. Wang (2004:371) labelled this factor as 'acquiring knowledge'. There are clearly internal motives driving visitors to enjoy what parks have to offer. It appears that visitors focus on two main aspects, namely relaxation and gaining personally from visiting the park. Relaxation remains the most important aspect of both push and pull factors.
Secondly, the factor analysis for the pull factors revealed three important factors: 'Park activities', 'Park attributes' and 'Educational value'. These factors can be used to attract visitors to the parks. 'Park activities' include aspects such as learning about animals, exploring the destination and taking photographs. These aspects have been identified as 'recreation activities' (Fakeye & Crompton 1991:13) or as 'eco-activities' (Chan & Baum 2007:359) in similar studies. 'Park attributes' is seen as a very important factor in similar studies, but labelled 'accommodation' (Fakeye & Crompton 1991:13; Hsu, Tsai & Wu 2009:295; Awaritefe 2004:318). The educational value of parks has always been considered very important; however, various researchers have focused on the sight-seeing rather than educational value of natural attractions. Chaipinit (2008:v) refers to the 'natural environment', and Chan and Baum (2007:361) label this factor 'natural attractions'. 'Park attributes' was found to be the most important pull factor in the current study. It is therefore important that park management adhere to the needs of the visitors and provide for them where possible.
Thirdly, being accompanied by children or not, province of residence and home language significantly influenced push and pull factors. People who visit the park with children will react to marketing messages focused on relaxation, the personal benefits of visiting the parks and the educational value. People from Gauteng regarded personal gain, relaxation and park attributes as very important, whereas international visitors identified park activities as important and people from the Western Cape focused on education and park attributes. It was also clear that South Africans visit the parks to relax and for their educational value, whereas international visitors are more interested in participating in the activities offered by the park, such as game drives and bush walks.
Fourthly, age and qualifications had a moderately significant effect on push and pull factors to South African National Parks. People older than 60 and younger than 30 did not rate the educational value of the park very highly. It is clear that these two groups have different needs, such as spending time with friends and enjoying the nature experience. People above the age of 60 did not consider relaxation as important as the other age groups did. Kim et al. (2003:173) also found that age has a significant effect on push and pull factors. Respondents between the ages of 29 and 39 and 40 and 49 identified family togetherness as an important aspect. The push factor 'Personal gain' also included aspects of family togetherness however, no significant differences were found in the current study between the various age groups. People older than 50 considered the appreciation of natural resources and health benefits as important motives for visiting the park (Kim et al. 2003:173). People with a grade 12 qualification visited the park for personal gain and to participate in park activities, whereas for people with a postgraduate qualification these motives were less important. This could suggest that respondents with higher qualifications might have researched their goals and are perhaps exposed to more stressful situations than respondents with lower qualifications, which would influence their motives for travelling to parks. People with lower qualifications might also be younger and therefore still prefer to be actively busy when on holiday and therefore be more affected by the factors 'Personal gain' and 'Park activities'. For all qualification levels, relaxation remained the strongest motive for visiting parks.
6 IMPLICATIONS
The results of the research conducted in the various parks suggest the following implications. Firstly, it is clear that there are factors that push visitors to visit national parks and also factors that pull them. The results showed that visitors experience a need to relax and to escape from daily routines and that the parks offer opportunities to do this. The product must thus be sustained in such a manner that it continues to offer these opportunities and this should be communicated to the market through various media.
Secondly, the importance of the park attributes should not be underestimated and they should therefore be continually upgraded. These attributes can influence travel decisions by offering a product (accommodation, facilities and activities) of high quality. Continuous maintenance and development of parks is therefore very important. This will also make visitors feel they are receiving value for money when visiting the parks - an issue that is becoming more important for visitors.
Thirdly, since the importance of certain push and pull factors is influenced by socio-demographic characteristics, managers should consider developing certain products according to the differing needs of different groups. People with children are focused on the needs of themselves and the children and consider a visit to the parks both relaxing and of educational value. Parks should offer more opportunities for both, especially during high season. It is also important to inform international visitors about the activities parks have to offer and encourage them to participate in these. This implies the need for a user-friendly website. Visitors at the younger and older ends of the spectrum show less interest in the educational value of the parks and are more attracted by activities and the general nature experience
7 CONCLUSIONS
This study analysed the influence of push and pull factors on visitors to South African National Parks. Although travel motivations have been identified by various tourism research studies in South Africa, they have not been analysed in a push and pull factor context. This study revealed significant results, indicating that the respondents were motivated to visit the parks mostly to relax and to gain personally from their visit. It was also found that parks can attract visitors by offering park activities and by highlighting the educational value of the experience. These factors are also in line with the SANParks mandate, which is to conserve South Africa's biodiversity, landscapes and associated heritage assets, through its system of national parks. SANParks also promotes and manages nature-based tourism and delivers both conservation management and tourism services through a people-centred approach. The push and pull factors identified in this study were found to be influenced by certain socio-demographic characteristics, a finding which emphasises the importance of understanding the market and targeting specific market segments.
REFERENCES
AHN K & KIM S. 1996. A study on visitors' behaviour in Korean National Park. Journal of Korean Landscape, 24(1):32. [ Links ]
ARMSTRONG RW, MOK C, GO F & CHAN A. 1997. The importance of cross-cultural expectations in the measurement of service quality perceptions in the hotel industry. International Journal of Hospitality Management, 16(2):181-190. [ Links ]
AWARITEFE O. 2004. Motivation and other considerations in tourist destination choice: a case study of Nigeria. Tourism Geographies, 6(3):303-330. [ Links ]
BALOGLU S. 1997. The relationship between destination images and socio-demographic and trip characteristics of international travellers. Journal of Vacation Marketing, 3(3):221-233. [ Links ]
BANSAL H & EISELT HA. 2004. Exploratory research of tourist motivations and planning. Tourism Management, 25(3):387-396. [ Links ]
BEERLI A & MARTIN JD. 2004. Factors influencing destination image. Annals of Tourism Research, 31(3):657-681. [ Links ]
CHAIPINIT W. 2008. Motivation and behaviour of Thai outbound tourists to Europe. Thesis for a Master's degree in Business Administration in Hospitality and Tourism Management. Phuket: Prince of Songkla University. [ Links ]
CHAN JKL & BAUM T. 2007. Motivation factors of ecotourists in ecolodge accommodation: the push and pull factors. Asia Pacific Journal of Tourism Research, 12(4):349-364. [ Links ]
CHHABRA D. 2010. Sustainable marketing of cultural and heritage tourism. Routledge: Oxon. [ Links ]
CROMPTON JL. 1979. Motivations for pleasure vacations. Annals of Tourism Research, 6(4):408-424. [ Links ]
DANN GMS. 1977. Anomie, ego-enhancement and tourism. Annals of Tourism Research, 4(4):184-194. [ Links ]
DEVESA M, LAGUNA M & PALACIOS A. 2010. The role of motivation in visitor satisfaction: empirical evidence in rural tourism. Tourism Management, 31 (4):547-552. [ Links ]
FAKEYE PC & CROMPTON JL. 1991. Image differences between prospective, first time, and repeat visitors to the Lower Rio Grande Valley. Journal of Travel Research, 30(2):10-16. [ Links ]
FIELD A. 2005. Discovering statistics using SPSS. London: SAGE. [ Links ]
GÓMEZ-BORJA MÁ, ROMERO CL, DESCALS AM & JIMÉNEZ, JAM. 2010. Building a tourist typology based on motivations for visiting a cultural city. In KOZAK M, GNOTH J & ANDREU LLA (eds). Advances in tourism destination marketing. Routledge: Oxon. p. 233-243. [ Links ]
HEUNG VCS, QU H & CHU R. 2001. The relationship between vacation factors and socio-demographic and travelling characteristics: the case of Japanese leisure travellers. Tourism Management, 22(33):259-269. [ Links ]
HONEY M. 2008. Ecotourism and sustainable development: Who owns paradise? 2nd ed. Washington DC: Island Press. [ Links ]
HSU T, TSAI Y & WU H. 2009. The preference analysis for tourist choice of destination: a case study of Taiwan. Tourism Management, 30(2):288-297. [ Links ]
HUANG J, HUANG C & WU S. 1996. National character and response to unsatisfactory hotel service. International Journal of Hospitality Management, 15(3):229-243. [ Links ]
ISO-AHOLA SE. 1982. Toward a social psychological theory of tourism motivation: a rejoinder. Annals of Tourism Research, 9(2):256-262. [ Links ]
JANG S & WU CE. 2006. Seniors' travel motivation and the influential factors: an examination of Taiwanese seniors. Tourism Management, 27(2):306-316. [ Links ]
JANG S, BAI B, HONG G & O'LEARY JT. 2004. Understanding travel expenditure patterns: a study of Japanese pleasure travellers to the United States by income level. Tourism Management, 25(3):331-341. [ Links ]
KIM SS, LEE C & KLENOSKY DB. 2003. The influence of push and pull factors at Korean national parks. Tourism Management, 24(2):169-180. [ Links ]
KLENOSKY D. 2002. The "pull" of tourism destinations: a means-end investigation. Journal of Travel Research, 40(4):385-395. [ Links ]
KOTLER P, BOWEN J & MAKENS J. 2006. Marketing for hospitality and tourism. 4th ed. Prentice-Hall Inc: Upper Saddle River, NJ. [ Links ]
KOZAK M & BALOGLU S. 2011. Managing and marketing tourist destinations: Strategies to gain a competitive edge. Routledge: New York. [ Links ]
KOZAK M. 2002. Comparative analysis of tourist motivations by nationality and destinations. Tourism Management, 23(3):221-232. [ Links ]
KRUGER M & SAAYMAN M. 2010. Travel motivation of tourists to the Kruger and Tsitsikamma National Parks: a comparative study. South African Journal of Wildlife Research, 40(1):93-102. [ Links ]
LAWS E, FAULKNER B & MOSCARDO G. 1998. Embracing and managing change in tourism: International case studies. New York: Routlege. [ Links ]
LUO Y & DENG J. 2008. The new environmental paradigm and nature-based tourism motivation. Journal of Travel Research, 46(4):392-402. [ Links ]
MASLOW AH, 1943. A theory of human motivation. Psychological Review, 50(4):370-396. [ Links ]
MEHMETOGLU M. 2007. Nature-based tourists: the relationship between their trip expenditures and activities. Journal of Sustainable Tourism, 15(2):200-215. [ Links ]
MORRISON AM. 2010. Hospitality and travel marketing. 4th ed. Delmar, Cengage Learning: New York. [ Links ]
MOSCARDO G, MORRISON AM, PEARCE PL, LANG C & O'LEARY JT. 1996. Understanding vacation destination choice through travel motivation and activities. Journal of Vacation Marketing, 2(2):109-122. [ Links ]
NICKERSON P & JUROWSKI C. 2000. The influence of children on vacation travel patterns. Journal of Vacation Marketing, 7(1):19-30. [ Links ]
PRAYAG G & RYAN C. 2011. The relationship between the 'push' and pull' factors of a tourist destination: the role of nationality-an analytical qualitative research approach. Current Issues in Tourism, 14(2):121-143. [ Links ]
SAAYMAN A & SAAYMAN M. 2006. The socio-demographics and visitation patterns of arts festivals in South Africa. Events Management, 9(4):211-222. [ Links ]
SANPARKS see SOUTH AFRICAN NATIONAL PARKS [ Links ]
SIRAKAYA E & WOODSIDE AG. 2005. Building and testing theories of decision making by travellers. Tourism Management, 26(6):815-832. [ Links ]
SMITH S, COSTELLO C & MUENCHEN RA. 2010. Influence of push and pull motivations on satisfaction and behavioural intentions within a culinary tourism event. Journal of Quality Assurance in Hospitality & Tourism, 11:17-35 [ Links ]
SOUTH AFRICAN NATIONAL PARKS. 2010. Annual report. [Internet: www.sanparks.org/assets/docs/general/annual-report-2010.pdf; downloaded on 2011-09-12. [ Links ]]
SOUTH AFRICAN NATIONAL PARKS. 2011. Brief history. [Internet: www.sanparks.org/about/history.php; downloaded on 2011-09-08. [ Links ]]
STABLER MJ. 1988. The image of destination regions: theoretical and empirical analysis. In GOODALL B & ASHWORTH G (eds.). Marketing in the tourism industry. London: Routledge. p. 133-161. [ Links ]
STEVENS JP. 1992. Applied multivariate statistics for the social sciences. 2nd ed. Hillsdale: Erlbaum. [ Links ]
UYSAL M & HAGAN L. 1993. Motivation of pleasure travel and tourism. New York: Nostrand Reinhold. [ Links ]
UYSAL M, McDONALD CD & MARTIN BS. 1994. Australian visitors to US national parks and national area. International Journal of Contemporary Hospitality Management, 6(3):18-24. [ Links ]
VAN DER MERWE P, SAAYMAN M & KRUGELL WF. 2007. The determinants of the spending of biltong hunters. South African Journal of Economic and Management Sciences, 10(2):184-194. [ Links ]
WANG DG. 2004. Push-pull factors in mountain resorts: a case study of Huangshan mountain as world heritage. Chinese Geographical Science, 14(4):368-376. [ Links ]
WANG K, HSIEH A, YEH Y & TSAI C. 2004. Who is the decision-maker: the parents or the child in group package tours? Tourism Management, 25:183-194. [ Links ]
WILLIAMS A. 2002. Understanding the hospitality consumer. Oxford: Butterworth-Heinemann. [ Links ]
WITT A & WRIGHT PL. 1992. Tourism motivation: life after Maslow. In JOHNSON P & THOMAS B (eds). Choice and demand in tourism. Mansell: London. pp. 33-55. [ Links ]
WITT S & MOUNTINHO L. 1989. Tourism marketing and management handbook. Cambridge: Prentice-Hall. [ Links ]
WOODSIDE AG & LYSONSKI S. 1989. A general model for travellers' destination choice. Journal of Travel Research, 27(4):8-14. [ Links ]
YOON Y & UYSAL M. 2005. An examination of the effects of motivation and satisfaction on destination loyalty: a structural model. Tourism Management, 26(1):45-56. [ Links ]
ZIMMER Z, BRAYLEY RE & SEARLE MS. 1995. Whether to go and where to go: identification of important influences on seniors' decision to travel. Journal of Travel Research, 33(3):3-10. [ Links ]

