


Serviços Personalizados
Artigo
 Inglês (pdf)
 Artigo em XML
 Referências do artigo
Indicadores

Links relacionados
-
 Citado por Google
 -
 Similares em Google
Compartilhar

 Permalink
Journal of Contemporary Management
versão On-line ISSN 1815-7440
JCMAN vol.8 no.1 Meyerton 2011
RESEARCH ARTICLES
Users and providers perceptions about the quality of service in the mobile telephone industry - the case of Uganda
JM ByarugabaI; M TaitII; JK BoschIII
IMakarere University Business School
IINelson Mandela Metropolitan University
IIINelson Mandela Metropolitan University
ABSTRACT
Service providers need to align their service designs to users' expectations. This paper examines two disparities based on the SERVQUAL Model of the Gaps Theory namely Gaps 1 and 5. The paper examines whether users' experiences mirror their expectations of mobile telephone services in the branch of industry in Uganda (Gap 5). Secondly, the paper examines whether providers understanding of users' expectations mirror the real expectations of users (Gap 1). The study uses two samples of 195 providers and 262 users and two research instruments. For the phenomenological part, three focus groups each comprising between six and ten participants was assembled for users and providers of mobile telephone services. Structural equation modelling (SEM) was used to test the theory through confirmatory factor analysis (CFA) and goodness-of-fit tests. The CFA results indicated that the users' and providers' models were not well specified. The goodness-of-fit test results indicated that the researcher's models did not fit their sub-sample data. The paired samples t-test indicated absence of users' Gap 5. The independent samples t-test indicated existence of the providers' Gap 1. Qualitative findings indicated that both Gaps 5 and 1 existed. Strategies to close Gaps 5 and 1 were identified and recommendations made for possible adoption by mobile telephone service providers in Uganda with a view to closing the two Gaps.
Key phrases: Service providers, service users, mobile telephone industry, expected service quality, experienced service quality
1 INTRODUCTION
Uganda's services industry includes telecommunications, education, transportation, health and financial services, to list only examples of the major service industries. In this research, the focus is on the mobile telephone services branch of the telecommunications industry in Uganda (Uganda Communications Commission 2005). The service industry is the largest sector in the Ugandan economy, contributing approximately 40% of the Gross Domestic Product (GDP) and 70% of the formal employment. Further, eight out of every ten new jobs in Uganda are service related thus making it the driving force of the economy (Uganda Export Promotion Board -UEPB).
In the 2003/2004 financial year alone, the telecommunications branch of service industries in Uganda generated US $17.01 million and employed 150 000 citizens of the country (Uganda Telecommunications Sector Policy Review Report 2005:29). In the 2006/2007 financial year, the revenue generated from this branch of industry was estimated to be US $360 million. While indirect employment in the branch of industry was estimated at 350 000 Ugandans, direct employment was 6 062 individuals (A Review of The Post and Telecommunications Sector 2007:10-12).
Prior to 1996, Uganda's telecommunications infrastructure was among the least developed, not only in Africa, but also in global terms, with a teledensity of only 0.21 per one hundred citizens (Shirley, Tusubira, Gebreab & Haggarty 2002: 8,11). Interestingly, with a subscriber base of 10 million, the teledensity in 2009 is 30 per one hundred (Market Review Report 2009, Status of the Communications Market, December 2008). Despite the fact that 80% of the 31 million Ugandans are living in rural areas, up to 70% of the telecommunication services are concentrated in urban areas, leaving the rural majority with the least access to these vital services (A Review of The Postal and Telecommunications Sector 2007; Uganda Telecommunications Sector Review Report 2005). With the subscriber base of 10 million Ugandans (December 2009), the demand for mobile telephone services requires urgent attention both from the Communications Commission and other service providers (Status of the Communications Market 2008).
With deregulation of the telecommunication services in Uganda in the mid 1990s, several mobile telephone service operators took the initiative to provide these vitally needed mobile communication services in Uganda (Uganda Telecommunications Sector Report 2005:15). By December 2008, four providers, namely Mobile Telephone Network (MTN), Uganda Telecom Limited (UTL), ZAIN and WARID provided communication technologies in Uganda. In 2009, the technologies are used by seven mobile telephone service operators (providers), namely UTL, MTN, ZAIN, WARID Telecom, ORANGE Uganda Limited, SMILE Telecom and I-Telecom to satisfy the augmented contemporary communications need of Ugandan users in the mobile telephone branch of industry (A Review of The Telecommunications Sector 2007:6; Status of the Communications Market 2008; Uganda Telecommunications Policy Report 2005:23). It should be noted that only MTN, UTL, ZAIN and WARID were surveyed for this study.
With the continued growth in mobile telephone services in Uganda, two key questions come to the fore. Firstly, are the users receiving the mobile telecommunications services they expect? Secondly, do the providers' perceptions of users' expectations mirror the users' real expectations on mobile telecommunications? The first question implies a potential disparity between users' expected and actual service quality while the second implies a potential disparity between providers' perceptions of users' expectations and what the users' real expectations are. The aforementioned disparities have been investigated in this research. It is important to note that Uganda is a multi-cultural and multi-lingual country. Altogether, there are 32 local languages spoken in Uganda leading to a possibility of many interpretations of the same concept. Since English is the official language in Uganda, a decision was made to conduct the investigation in English (Mbuga 2003). Due to the many local languages, it was considered prudent to adopt positivistic as well as phenomenological research methodologies to allow for a broader perspective of the research problem. This would also increase the validity of the research (Collis & Hussey 2003:76,2009:85).
To have a better understanding of the situation pertaining to service quality perceptions in the mobile telephone branch of industry in Uganda, the SERVQUAL Gaps model of service quality by Parasuraman, Zeithaml and Berry (1985) is useful to illustrate the potential service quality gaps. For the purpose of this research, the focus is on the providers' Gap 1 and users' Gap 5 to assess whether the providers' designed service quality meet clients' expected and actual levels of service quality in the mobile telephone services branch of industry in Uganda.
2 PROBLEM STATEMENT
This investigation focused on whether users' expectations were met and whether providers understood what users expected, for this reason, the study compared the users' and providers' perceptual mindsets of service quality. The problem statement was then phrased in a threefold manner:
• Firstly, do providers understand users' expectations of mobile telephone services? This question requires a comparison between users' expectations and providers' understanding of such expectations (Gap 1).
• Secondly, do Ugandan mobile telephone users experience the services they expected? This question requires a comparison between users' expectations and their actual experiences with the services (Gap 5).
• Thirdly, because the investigations were conducted in the official English language of Uganda despite its limited affiliation to the diversity of cultures and local languages of the respondents, the use of different research methodologies was imperative in order to generate business strategies to close the Gaps 1 and 5 pertaining to the quality of mobile telephone services in Uganda?
3 THEORETICAL OVERVIEW
The SERVQUAL model used in this research is based on the seminal contribution by Parasuraman et al. (1985, 1988) that users judge the service in terms of whether the service received is equal or exceeds what was expected. Literature sources report two conceptualisations of service quality, namely, the Nordic and the American perspectives (Hsieh & Hiang 2004:45). The Nordic perspective defines service quality in global terms as consisting of functional and technical quality, referring to "the delivery process" and "what is delivered" respectively. The American perspective uses the SERVQUAL scale to define service quality along several dimensions. The model depicts a set of gaps numbered 1 to 5. Gaps 1 to 4 represent mobile telephone service providers' potential internal service quality disparities ranging from design to delivery of promised service quality (Zeithaml & Bitner 1996:49; Zeithaml, Bitner & Gremler 2006:46).
Parasuraman et al. (1988:20) originally suggested that users evaluate the quality of a service according to ten service quality dimensions, namely tangibles, reliability, responsiveness, competence, courtesy, credibility, security, access, communication and understanding. Subsequent research tested the dimensions and made considerable modifications which reduced the original ten to five, namely tangibility, reliability, responsiveness, assurance and empathy (Zeithaml et al. 1990; Zeithaml & Bitner 1996). However, the five dimensions have received criticism that they focus on the functional aspects and overlook the technical quality aspects of the service (Kang & James 2004:270). Despite the criticism levelled, the five SERVQUAL dimensions were used in evaluating users' and providers' service quality in the mobile telephone branch of industry in Uganda.
4 RESEARCH OBJECTIVES
The primary objective of the research was to consider users and providers perceptions about the quality of service in the mobile telephone industry in Uganda. In order to obtain the primary objective, an extensive literature overview and an empirical investigation among users and providers of mobile telephones were conducted.
The following secondary objectives were pursued:
• to investigate whether Ugandan mobile telephone users were experiencing the services they expected. This objective implies examining the users' Gap 5;
• to investigate whether Ugandan mobile telephone service providers understand users' expectations. This objective implies examining the providers' Gap 1; and
• to analyse quantitative and qualitative data and recommend possible strategic actions mobile telephone service providers can implement to close Gaps 1 and 5.
5 HYPOTHETICAL MODELS
Based on the problem statement and the SERVQUAL model, three hypothetical models were developed for this research as shown in Figures 1, 2, and 3. The constructs of Figures 1, 2, and 3 are based on an extensive analysis of secondary sources pertaining to service quality. It was noted that Uganda is a multi-lingual country. Due to the multi-language reality of the service environment of users and providers of mobile telephone services in Uganda, structural equation modelling (SEM) was used to test the relationships among the latent and observed variables in the hypothetical models. In order to use multiple sources of data, the strategy of methodological triangulation was adopted (Collis & Hussey 2009:85).
SEM is a multi-variate statistical technique for building and testing statistical models. It is a hybrid technique that encompasses aspects of CFA, path analysis and multiple regressions to estimate a series of interrelated dependence relationships simultaneously (Cooper & Schindler 2006:583; Hair, Bush & Ortinau 2003:724). SEM implies a structure for the co-variances between observed variables, and accordingly it is sometimes called covariance structure modelling. LISREL (linear structural relations) and AMOS (analysis of moment structures) models are more commonly used by researchers using structural equation modelling (Stoelting 2002). In this research, AMOS 16.0 was adopted for analysing the SEM procedures. Given that the researcher had pre-specified hypothetical models to confirm or disconfirm and establish whether they should be accepted or rejected, confirmatory factor analyses (CFA) and goodness-of-fit tests were performed to assess the validity of the hypothetical models depicted in Figures 1 and 2.
Figure 3 required a t-test to establish whether a disparity existed between users' expectations and the providers' designed service. SEM has two principal advantages over other multi-variate techniques. Firstly, multiple and interrelated dependence relationships can be estimated simultaneously. Consequently, SEM as a general linear model can simultaneously estimate relationships between multiple independent, dependent and latent variables (unobserved concepts that are not measured directly). Secondly, SEM has the ability to incorporate latent variables into the analysis and account for measurement error in the estimation process (Cooper & Schindler 2006:584). As such, in contrast to other multi-variate techniques, SEM allows the researcher to assess both measurement properties and test for key theoretical relationships in one technique (Hair et al. 2006.706).
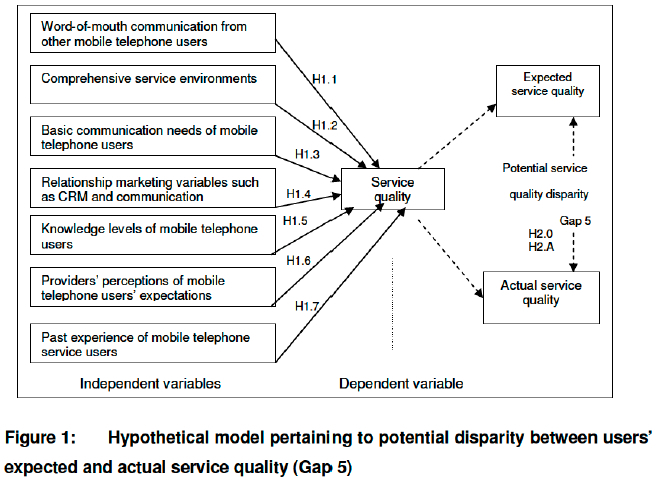
5.1 HYPOTHETICAL MODEL PERTAINING TO POTENTIAL DISPARITY BETWEEN USERS' EXPECTED AND ACTUAL SERVICE QUALITY (GAP 5)
Gap 5 of the SERVQUAL model depicts a potential disparity between expected and actual services experienced by the users of mobile telephone services in Uganda. Figure 1, indicates that the mobile telephone users' service quality (dependent variable) is influenced by seven independent variables. As stated, due to the multilingual service environment in Uganda, the impact of each independent variable on the dependent variable was estimated through SEM procedures. Further, mobile telephone services to Ugandan users were investigated to establish whether a disparity existed between the expected and actual service quality in the branch of industry.
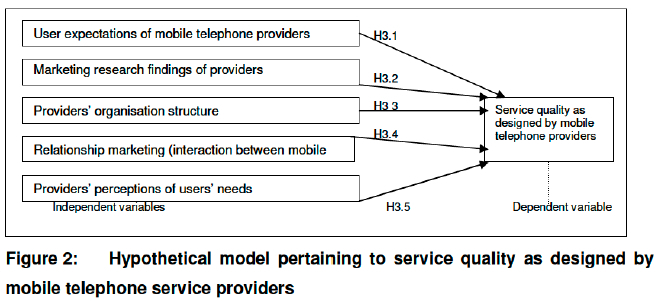
5.2 HYPOTHETICAL MODEL PERTAINING TO SERVICE QUALITY AS DESIGNED BY MOBILE TELEPHONE PROVIDERS
As shown in Figure 2, it is hypothesised that five independent variables impact on service quality as designed by the mobile telephone service providers. This study examined the impact of each independent variable on the dependent variable through SEM procedures. It is important to state that mobile telephone service quality expectations of users depicted in Figure 1 and mobile telephone service quality as perceived by providers depicted in Figure 2 represent the two dependent variables for this research. The relationship between the two dependent variables constitutes the components of Gap 1 shown in Figure 3.
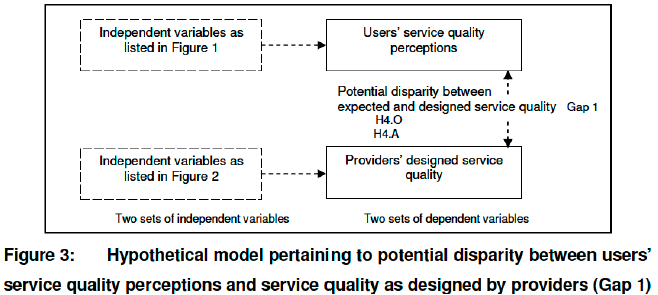
5.3 HYPOTHETICAL MODEL PERTAINING TO POTENTIAL GAP 1
In the seminal publications of Parasuraman et al (1985, 1988), Gap 1 was described as the potential disparity between mobile telephone providers' understanding of the service that mobile telephone users expect. In Figure 1, it was hypothesised that the seven independent variables impacted directly on the dependent variable (service quality). It was further hypothesised in Figure 2 that the five independent variables impacted directly on the dependent variable (service quality as designed by mobile telephone providers).
Figure 3 brought together the two dependent variables, where it was hypothesised that a disparity existed between users' expected service quality and service quality as understood by mobile telephone service providers in the branch of industry in Uganda, which is described as Gap 1 by Parasuraman et al (1988).
6 HYPOTHESES
Although four sets of hypotheses are implied based on the three hypothetical models in Figures 1, 2 and 3, two sets of non-directional hypotheses were key in investigating whether mobile telephone users' expectations were being met and whether providers understood users' expectations of mobile telephone services in Uganda. The first set investigating whether users' expected service quality was being experienced comprised the following non-directional hypotheses:
H2.0: There are no disparities between "expected" and "actual" mobile telephone service quality to users.
H2.A: There are disparities between "expected" and "actual" mobile telephone service quality to users.
The second set investigating the potential disparities between service quality as expected by users and service quality as designed by providers in the mobile telephone branch of industry in Uganda comprised the following non-directional hypotheses:
H4.0: There is no disparity between users' "expected service quality" and "service quality as designed" by providers in the mobile telephone industry in Uganda.
H4.A: There is a disparity between users' "expected service quality" and "service quality as designed" by providers in the mobile telephone services branch of industry in Uganda.
7 RESEARCH METHODOLOGY
Given the three hypothetical models and the operationalisation thereof, the positivistic approach was supplemented by the phenomenological approach as a pre-emptive measure against possible multi-lingual effects of distorted concepts (Collis & Hussey 2003:47; Collis & Hussey 2009:57; Santos 2006:290). The aforementioned nature of the mobile telephone service environment required the use of methodological triangulation strategies in which quantitative data were supplemented by qualitative data to enhance the validity of the study findings (Collis & Hussey 2009:85).
The approaches and strategies described enabled the models to be empirically tested with a view of confirming service quality theory with regard to users' Gap 5 and providers' Gap 1 among users and providers of mobile telephone services in Uganda. Structural equation modelling was used through confirmatory factor analyses and goodness-of-fit tests.
7.1 SAMPLE PROCEDURE AND SAMPLE SIZE
Two sampling methods were considered appropriate for this study, namely, area sampling as the probability sampling method, and judgemental sampling as the non-probability sampling. The samples comprised 195 providers and 262 users of mobile telephone service in Uganda. Two research instruments were used for this study; one to source users' perceptions and the other providers' perceptions of service quality. The statements were linked to a five-point Likert-type interval scale anchored by "strongly disagree (1)" and "strongly agree (5)" (Gronroos 2001:151; Kang & James 2004:270; Zeithaml et al. 1990:175-186). Individual users and providers were the units of analysis.
For the phenomenological part, three focus groups each comprising between six and ten participants was assembled for users and providers of mobile telephone services. The use of focus group interviews as a method of qualitative data collection is widely reported (Cooper & Schindler 2006; Hair et al. 2003; Krueger 1998; McNamara 2008; Miles & Huberman 1994).
7.2 RELIABILITY AND VALIDITY OF THE MEASUREMENT INSTRUMENTS
The quantitative research instruments were tested for reliability by interpreting the Cronbach alpha reliability coefficients of the scale items in the two instruments (Blumberg, Cooper & Schindler 2005:385; Collis & Hussey 2003:58; Kothari 2005:154). The users' instrument had good internal consistency with all Cronbach's alpha reliability coefficients over 0.8 for both expected and actual service perceptions. The providers' instrument revealed acceptable Cronbach's alpha reliability coefficients ranging between 0.67 and 0.71.
SEM was used to validate the study by testing the theory through CFA and goodness-of-fit tests. The CFA established whether the users' and providers' models met the required minimum model specifications. For a well specified model, each of the independent variables needs to have a minimum of three statements (scale items) with factor loadings (pattern coefficients) of > 0.70 to be considered for further analysis. The goodness-of-fit tests established whether the researchers' models fitted their respective sub-sample data. Further, the goodness-of-fit tests determined if the model being tested should be accepted or rejected. Goodness-of-fit tests were performed for the users' and providers' hypothetical models in Figures 1 and 2.
In this research, multiple linear regression analyses were performed to firstly, assess whether the identified seven independent variables impacted on service quality rendered to users of mobile phones in Uganda. Secondly, it was used to assess whether the identified five independent variables impacted on service quality, as designed by the providers of mobile telephone services in Uganda. The paired samples t-test indicated whether or not the users' Gap 5 existed while the independent samples t-test indicated whether or not the providers' Gap 1 existed in the mobile telephone branch of industry in Uganda. Qualitative findings were used to verify quantitative results on both Gaps 1 and 5 among users and providers of mobile telephone services in Uganda. Strategies were identified and recommendations made for possible adoption by mobile telephone service providers in the branch of industry in Uganda with a view of closing Gaps 1 and 5.
8 EMPIRICAL RESULTS
8.1 CFA FOR USERS' EXPECTED SERVICE QUALITY
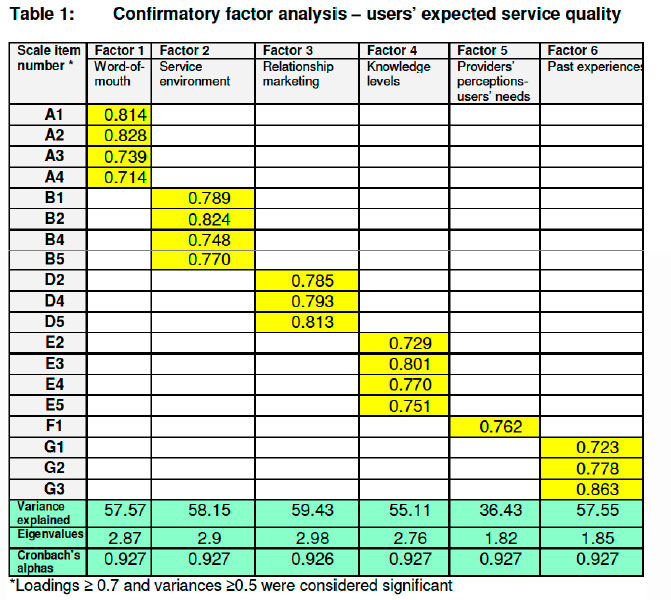
The confirmatory factor matrix for users' expected service quality based on the minimum pattern coefficient (factor loading) threshold value of 0.7 appears in Table 1. The pattern coefficients (factor loadings) represent the correlation coefficients between the variables (rows) and factors (columns). The challenge is to interpret the pattern coefficients (factor loadings) worth considering. Hair et al. (2003) provide a rule of thumb as an approach for making a preliminary assessment of the factor matrix. Factor loadings larger than 0.30 are considered to meet just the minimum level; loadings of approximately 0.40 are considered more important; and loadings of 0.50 or greater are considered as practically significant.
For assessing the validity of the measuring instrument when doing a CFA, it was stated that the pattern coefficients must be 0.70 or higher (Schumacker & Lomax 2004:212). Therefore the larger the absolute size of the pattern coefficients, the more important the loading when interpreting the confirmatory factor matrix. Table 1 shows that the factor "past experience" had only one item which loaded on it, while the factor "basic communication needs" had none.
By convention a factor needs to have one or more scales with loadings >0.7 for inclusion in the regression analysis. The values of the Cronbach's alpha reliability coefficients in Table 1 indicate that they are all greater than 0.9 which reflects good internal consistency of the scale items in the users' research instrument that assessed their expectations of mobile telephone service quality. The construct validity of the scales may be regarded as good. Table 1 also shows that Eigen values were > 1, indicating the variance the independent variables exerted on the dependent variable. Table 1 also indicates that except for the variables "past experience" with a variance explained of 36.43% and "basic communication needs" which were not significant, the variance explained in the dependent variable by the other five independent variables ranges between 55 to 59%.
By convention, independent variables require to explain 50% variance or more of the dependent variable to be included in the specified model. Except for the variable "past experience" that explained only 36.4% of the variance in the dependent variable, which is below the threshold value of 50%, the balance of the independent variables explained more than 50%of the variance in the dependent variable. The results show that the variance in the dependent variable was adequately explained by the six independent variables.
Table 1 further shows the magnitude of the variance in the dependent variable each scale item of the independent variable explained. Some scale items were below the threshold value for inclusion in the pattern coefficients. The fact that half the scale items did not obtain significant factor loadings, indicate a model specification problem with regard to users' expectations of service quality.
8.2 CFA OF USERS' ACTUAL SERVICE QUALITY
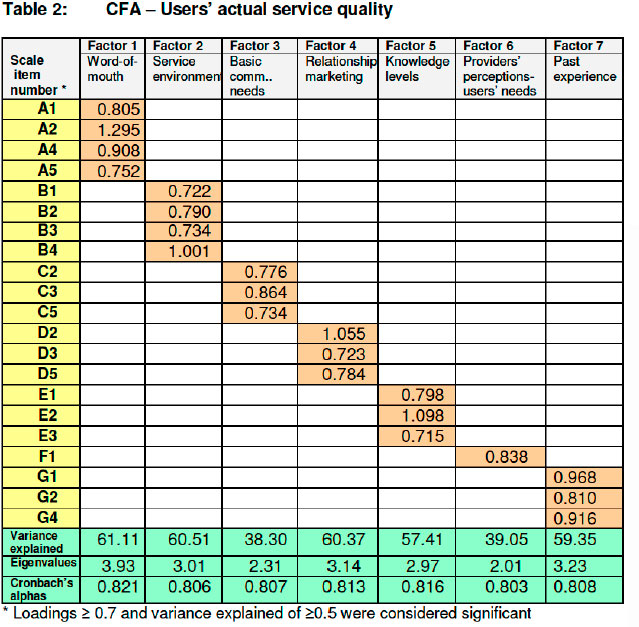
For the CFA pertaining to users' actual service quality, the same procedure as for users' expected service quality was followed. Table 2 shows the CFA matrix for users' actual service with the pattern coefficients (factor loadings) that represent the correlation coefficients between the variables (rows) and factors (columns). As was the case for users' expectations scores, some independent variables had only two items which loaded on them. The same factor loading threshold value of >0.7 was applied in the CFA for users' actual service quality.
From Table 2 it is clear that except for the variable "providers' perceptions of users' expectations" where only one item loaded, the other six independent variables obtained three or more item-loadings above the threshold, thus meeting the minimum requirements to be included in the regression analysis. However, except for the variables 'basic communication needs' and 'providers' perceptions of users' that had one item- loading above the threshold, the other five variables each obtained two item-loadings above the threshold value.
It should be noted that given the good Cronbach's alphas, the variance explained in the dependent variable by each factor was low ranging between 38 and 61%. The highest variance explained was obtained by the variable "word-of-mouth communication" (61%) and the lowest variance explained by "basic communication needs" (38%). According to secondary sources, variance explained in the dependent should be > 50%.
The Eigen values > 1 that accounted for the proportion of the explained variance have been indicated in Table 2. The Cronbach's alpha scores of > 0.8 showed good internal consistency of the scale items. As reflected in the CFA for actual service quality, certain service quality dimensions were not understood by the users in evaluating mobile telephone services.
8.3 CFA OF PROVIDERS' DESIGNED SERVICE QUALITY
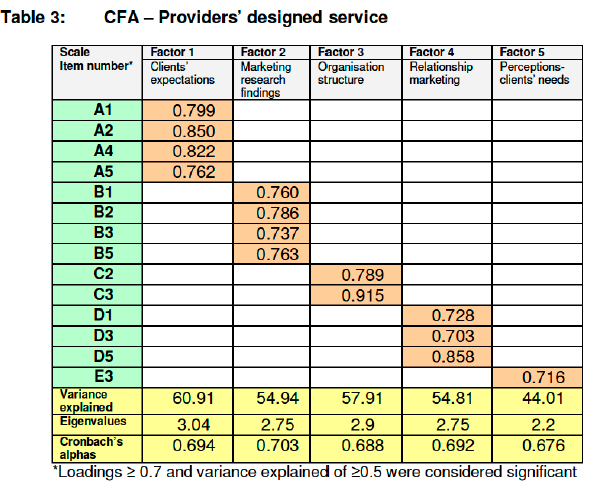
The CFA of the providers' designed service quality is depicted in Table 3. As motivated for users' "expected" and "actual" service quality, CFA for the providers' designed service quality was based on factor loadings of > 0.7.
The CFA factor matrix for providers' designed service quality in Table 3 shows the pattern coefficients (factor loadings) representing the correlation coefficients between the variables (rows) and factors (columns). As was motivated for the users' model hypothetical model, the providers' model specification requires that a variable must obtain three or more item-loadings of > 0.7 in order to be included in the empirical model. Table 3 shows that three of the five independent variables met the minimum requirement of three or more item-loadings of > 0.7 to be considered for further analysis namely "clients' expectations", "marketing research", and "relationship marketing". The variables "organisation structure" and "perceptions of clients' needs" did not meet the minimum requirement of three item-loadings of > 0.7. The findings imply that the providers' hypothetical model in Figure 2 is not well specified.
The findings on Cronbach's alpha reliability coefficients in Table 3 indicate that except for the variable "marketing research findings" with an alpha value of 0.703, all the other variables scored alpha values of less than 0.70. The alpha values reflect weak internal consistency of the scale items in the providers' research instrument which also reflects poor construct reliability. Table 3 also shows Eigen values > 1 which indicate the proportion of the variance explained in the dependent variable. Further, Table 3 indicates the explained variance between 44 and 60% for each independent variable.
8.4 MULTIPLE REGRESSION
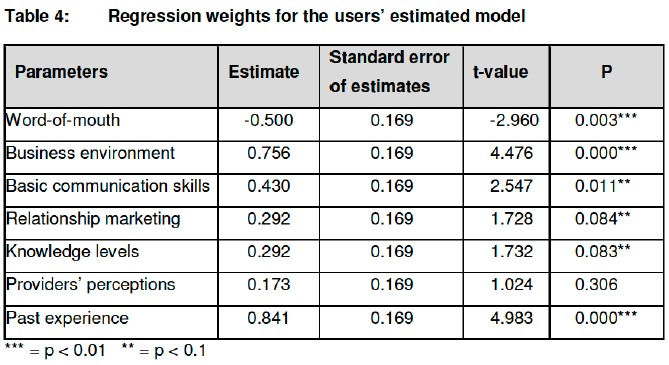
Empirical evidence is available to motivate why "actual experience" scales are the most applicable to assess service quality (Boulding, Kalra, Staelin & Zeithaml 1993:24; Cronin & Taylor 1992:64). On the basis of the aforementioned, only the "actual experiences" scales were used in the multiple regression analysis. With reference to Table 4, the users' hypotheses were tested.
8.5 TESTING OF HYPOTHESES (USERS)
Table 4 shows the regression values for the users' model and the interpretation of the tested hypotheses thereof. Except for the hypothesis H16 whose p > 0.1 was not statistically significant and are hence rejected, the other six hypotheses H1.1, H1.2, H1.3, H1.4, H1.5 and H1.7 obtained p < 0.1 implying they were statistically significant in influencing users' expected and experienced service quality in the mobile telephone industry in Uganda. The six are hence not rejected.
8.5.1 Testing the non-directional hypotheses on the potential disparity between users' expectations and actual experienced quality of mobile telephone services in Uganda
H2.0: There are no disparities between "expected" and "actual" mobile telephone service to users.
The findings revealed that there was no significant relationship between "expected" and "actual" mobile telephone services to users with p value of 0.74 yet the threshold values is p < 0.05. H2.0 is not rejected. Therefore, the alternative (directional) hypothesis is rejected. There is thus sufficient evidence at the 95% level of significance to support the null hypothesis.
8.5.2 Testing of hypotheses (providers)
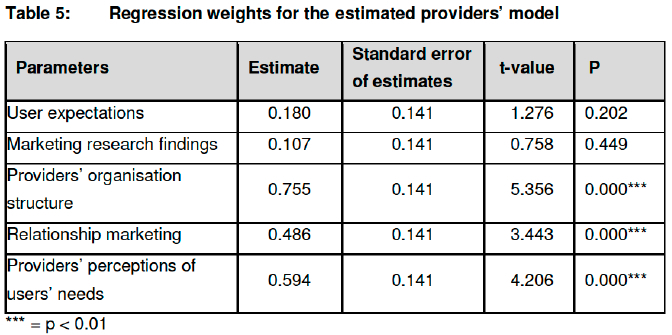
Table 5 shows the regression values for the providers' model and the interpretation of the tested hypotheses thereof. H3.1 and H3.2 indicate p-values of p > 0.1 implying that the relationships are not statistically significant in influencing service quality as designed by mobile telephone service providers in Uganda and are hence rejected. The p-values of H3.3, H3.4 and H3.5 are all with p < 0.01 implying statistically significant positive influences on providers' designed service and are hence not rejected. Therefore, their null hypotheses are rejected as there is sufficient evidence at the 99% level of significance to support the alternative (directional) hypothesis.
8.5.3 Paired samples Mest
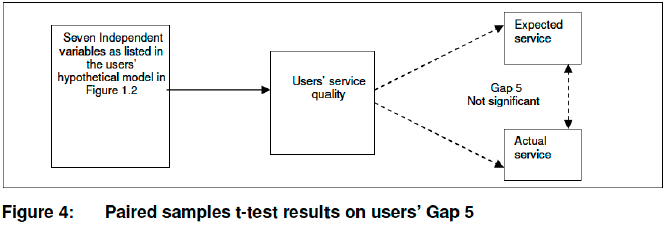
To establish whether a disparity existed between expected and actual service quality of users of mobile telephone services in the branch of industry in Uganda, a paired samples T-test was performed. Equal variances were assumed for this t-test due to pooled estimates of variance of scores from the same respondents for the two service quality perceptions. The paired samples statistics indicate that the means are 18.75 (expected service) and 18.82 (actual service) with a mean difference of -0.0725 and significance of 0.74. Given that the threshold value for significance is < 0.05, the t-test results indicated that disparity between users' expected and actual service quality (users' Gap 5) in the mobile telephone branch of industry in Uganda is not significant as illustrated in Figure 4.
This result implied that mobile telephone users in Uganda did not perceive a difference between the services they expected and the actual service rendered by their service providers.
8.5.4 Independent samples t-test
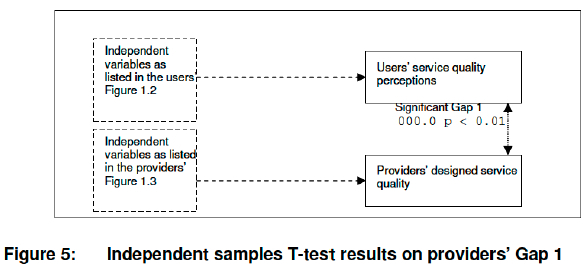
To establish whether a disparity existed between users' expectations of the designed service and providers' perceptions of the users' expectations of the designed (providers' Gap 1), an independent samples t-test was performed. The test was based on unequal variance assumption since the data came from two different samples. The group statistics indicated that the mean for the users' expectations sample of 262 respondents was 18.7519 and the providers' perceptions of users' expectation sample of 195 respondents was 21.0462. The mean difference for users' equal variances assumed sample was -2.2942 with a t-value of -8.038; and for the providers' equal variance not assumed sample was -2.2942 with a t-value of -8.452.
The significance column indicated that both means were significant at the 99% level. This result implies that a disparity exists between users' expectations and providers' perceptions of the users' expectations i.e. the providers' Gap 1 exists between users' expectations and providers' perceptions of the users' expectations in the mobile telephone service branch of industry in Uganda.
8.5.5 Testing non-directional hypotheses on the potential disparity between expected service quality and service quality as designed by providers of mobile telephone services in Uganda
H4.0: There is no disparity between users' "expected service quality" and "service quality as designed" by providers in the mobile telephone services branch of industry in Uganda.
The findings report a significant disparity between users' "expected service quality" and "service quality as designed" by mobile providers (p < 0.05). H40 is rejected. Therefore, the null hypothesis is rejected. There is thus sufficient evidence at the 95% level of significance to support the alternative (directional) hypothesis. The difference in the means implies that users expect less from the providers while providers think they are offering more than users expect to receive.
The t-values for both samples' variances are greater than the threshold value of > 2 further confirming the existence of Gap 1. Further, the difference reflects providers' failure to understand their clients' expectations as depicted in Figure 5.
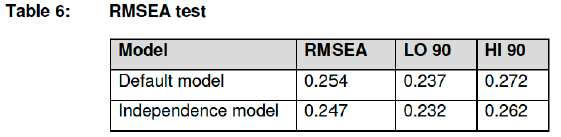
8.5.6 Goodness-of-fit of the users' model
A Root Mean Square Error of Approximation (RMSEA) test gave results as indicated in Table 6. By convention, good models have an RMSEA of < 0.05. Models whose RMSEA is >0.10 have a poor fit. However, RMSEA can be misleading for small degrees of freedom and small samples. This disadvantage does not apply in this research since the users' sub-sample of 262 respondents was not small. From the results in Table 6, it is clear that RMSEA for the users' estimated (default) model is 0.254 which implies that the hypothetical model (Figure 1) could not be confirmed.
8.5.7 Goodness-of-fit of the providers' model
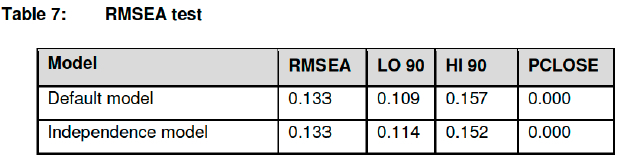
A RMSEA test gave results as indicated in Table 7. As stated earlier, good models have an RMSEA of < 0.05. Models whose RMSEA is > 0.10 have a poor fit. However, RMSEA can be misleading for small degrees of freedom and small samples. This disadvantage does not apply in this research since the providers' sub-sample of 195 respondents was not small. From the results in Table 7, it is clear that RMSEA for the providers' estimated (default) model is 0.133 which implies that the model (Figure 2) could not be confirmed.
9 DISCUSSION
This research contributed to the body of knowledge on service quality perceptions in the mobile telecommunications branch of industry in Uganda in various ways. Given that the multi-cultural, multi-lingual service environment with a prevalence of low education levels could lead to many interpretations of service quality concepts, preemptive measures were taken in which positivistic and phenomenological approaches were adopted to complement each other.
Methodological triangulation was adopted for collecting both quantitative and qualitative data. In this respect, post-survey focus group interviews were used to collect qualitative data to verify survey data to enhance the validity of the study. To establish whether the researcher's hypothetical models were well specified and fitted data from the users' and providers' sub-samples, SEM was used based on SPSS 17.0 and AMOS 16.0 computer software. SEM processes used CFA and goodness-of-fit tests to establish whether the researchers' hypothetical models were well specified and fitted their respective sample data. CFA indicated that the models were not well specified. The goodness-of-fit results rejected both the users' and the providers' hypothetical models because of poor fit to the two sub-sample data.
For an observed variable's path to be considered a significant parameter estimate, it needed to obtain a critical ratio greater than 1.96 and p-value of 0.05 or less as indicators of a good model fit. Informal methods were used to quantify post-survey small numbers of qualitative data to verify quantitative results on Gaps 1 and 5 in the mobile telephone branch of industry in Uganda. A modification of scale items to suit the unique service environment in Uganda was required. The results indicate that quantitative research is not feasible in countries in Africa because of the low levels of literacy in some African countries and the phenomenon of multi-lingualism aggravates the problem in such countries. The research design and methodology used ensured that quantitative results were validated by qualitative findings.
10 CONCLUSIONS AND RECOMMENDATIONS
Qualitative findings indicated that the users' Gap 5 existed between users' expected and actual service thus verifying the presence of Gap 5 contrary to quantitative results which indicated the absence of the same Gap. Both quantitative and qualitative findings indicated that the providers' Gap 1 existed between providers' perceptions of users' expectations and users' real expectations.
Several business level strategies can be pursued to close providers' Gap 1 and the users' Gap 5 in the mobile telephone branch of industry in Uganda. Given the low incomes of most users of mobile telephone services in Uganda, a "no frills" business strategy will be able to meet the expectations of the majority of the users in this type of economic environment. This option will enable providers to offer just the basic communication services i.e. offer no extras.
As most Ugandan mobile telephone service users belong to the low income segment, some providers may also choose to charge lower prices than rivals for good quality service offerings. This option may be adopted to deliver the desired service quality at low prices. For this strategy to succeed there must be a low cost base. With the intensity of rivalry increasing each year in Uganda (four providers in January 2009 and five in March 2009), price competition is inevitable among rivals in the branch of industry, thus justifying the viability of a low price business strategy for quality services. Providers may use a broad differentiation strategy by being unique to a wide range of users' needs and preferences that cannot be satisfied by a standard offering.
Although there are diverse ways of broad differentiation, providers of mobile telephone services in the branch of industry in Uganda may use marketing-based promotional approaches such as power of the brand to demonstrate how their services meet users' needs better than rivals' brands. Providers may also build innovative capabilities to offer unique offerings through increased investments in Research and Development and expertise in designing quality services. Providers may choose to niche in a special smaller sub-segment where they have a competitive advantage by meeting unique expectations of mobile telephone users in Uganda.
Although several conditions are necessary for the success of this strategic option, the target niche segment should be large enough to be profitable and offer good growth potential for the nicher. This strategy may be used to deliver the desired service quality. Mobile telephone service providers may also use one of the service growth strategies by meeting expectations of more users in the current market segment (market penetration); meeting new expectations of users in the current market segment (service development/market extension); meeting expectations of new users with current services (market development); and meeting new expectations of new users (diversification). However, the growth strategies attract different levels of risk as one move from market penetration to diversification strategy and mobile telephone service providers in Uganda should take note of such a fact.
REFERENCES
NO AUTHOR. A review of the postal and telecommunications sector. 2007. [Internet: www.ucc.ug.co; downloaded on 2009-10-04]. [ Links ]
BLUMBERG B., COOPER D.R. & SCHINDLER P.S. 2005. Business research methods. Berkshire: McGraw-Hill Education. [ Links ]
BOULDING W., KALRA A., STAELIN R. & ZEITHAML V.A. 1993. A dynamic process model of service quality: from expectations to behavioural intentions. Journal of Marketing Research, 30(February):7-27. [ Links ]
COLLIS J. & HUSSEY R. 2009. Business research. 3rd edition. New York: Palgrave Macmillan. [ Links ]
COOPER D.R. & SCHINDLER P.S. 2006. Business research methods. 9th edition. New York: McGraw-Hill. [ Links ]
CRONIN J.J. & TAYLOR S.A. 1992. Measuring service quality: a re-examination and extension. Journal of Marketing, 56:55-68. [ Links ]
GRONROOS C. 2001. The perceived service quality concept - a mistake? Managing Service Quality, 11(3):150-152. [ Links ]
HAIR J.F., BLACK W.C., BABIN J.B., ANDERSON R.E. & TATHAM R.L. 2006. Multivariate data analysis. 6th edition. Upper Saddle River, New Jersey: Pearson/Prentice-Hall. [ Links ]
HAIR J.F., BUSH R.P. & ORTINAU D.J. 2003. Marketing research: within a changing information environment. 2nd edition. New York: McGraw-Hill Irwin. [ Links ]
JOHNSON W. & SIRIKIT A. 2002. Service quality in the Thai telecommunication industry: A tool for achieving a sustainable competitive advantage. Management Decision, 40(7):693-701. [ Links ]
KANG G. & JAMES J. 2004. Service quality dimensions: An examination of Gronroos's service quality model. Managing Service Quality, 14(4):266-277. [ Links ]
KOTHARI C.R. 2005. Research methodology: methods and techniques. 2nd edition. India: New Age International Publishers. [ Links ]
KRUEGER R.A. 2002. Designing and conducting focus group interviews. [Internet: www.tc.umn.edu/~rkrueger/about.html; downloaded on 2008-10-25]. [ Links ]
KRUEGER R.A. 1988. Focus groups: A practical guide for applied research. London: Sage. [ Links ]
NO AUTHOR. Market review. 2008. [Internet: www.ucc.co.ug/MarketReviewMarch2008.pdf; downloaded on 2008-10-20]. [ Links ]
NO AUTHOR. Status of the communications market, March 2008. [Internet: www.ucc.com; downloaded on 2009-07-03] [ Links ]
NO AUTHOR. Uganda telecommunications sector policy review. 2005. Policy review report. [Internet: www.ucc.co.ug; downloaded on 2007-10-30] [ Links ]
NO AUTHOR. Uganda communications commission 2005. Funding and implementing universal access: Innovation and experience from Uganda. Kampala: Fountain Publishers Ltd. [ Links ]
NO AUTHOR. World Wide Worx. 2005. Phase 2 &4. The state of the mobile and wireless industries in South Africa 2005. Mobility, 1-92. [ Links ]
MBUGA D. 2003. The official language issue: A look at the Uganda experience. [Internet: www.wikipedia.org/wiki/languanges_of_uganda; downloaded on 2009-07-01]. [ Links ]
MCNAMARA C. 2008. General guidelines for conducting interviews. [Internet: www.managementhelp.org/evaluatn/interviews.htm; downloaded on 2008-10-30]. [ Links ]
MILES M.B. & HUBERMAN A.M. 1994. Qualitative data analysis. 2nd edition. London. SAGE Publications. [ Links ]
PARASURAMAN A., ZEITHAML V.A. & BERRY L.L. 1988. SERVQUAL: a multiple-item scale for measuring consumer perceptions of service quality. Journal of Retailing, 12-40. [ Links ]
PARASURAMAN A., ZEITHAML V.A. & BERRY L.L. 1985. A conceptual model of service quality and its implications for future research. Journal of Marketing, 49:41-50. [ Links ]
SANTOS G.J. 2006. Card sort technique as a qualitative substitute for quantitative exploratory factor analysis. Corporate Communications: An International Journal, 11 (3):288-302. [ Links ]
SEKARAN U. 2003. Research methods for business: A skill building approach. 4th edition. New Jersey: Wiley & Sons. [ Links ]
SHIRLEY M.M., TUSUBIRA F.F., GEBREAB F. & HAGGARTY L. 2002. Telecommunication reform in Uganda. Working Policy Research Working Paper 2864, June. [ Links ]
STOELTING R. 2002. Structural equation modeling/path analysis. [Internet: on www.sfsu.edu/~efc/classes/biol710/path/SEMbpage.htm; downloaded on 2007-07-05] [ Links ]
ZEITHAML V.A. & BITNER M.J. 1996. Services marketing. New York: McGraw-Hill. [ Links ]
ZEITHAML V.A., BITNER M.J. & GREMLER D.D. 2006. Services marketing: integrating customer focus across the firm. New York: McGraw-Hill Irwin. [ Links ]
ZEITHAML VA, PARASURAMAN A & BERRY LL. 1990. Delivering quality service: balancing customer perceptions and expectations. New York: The Free Press. [ Links ]

