


Serviços Personalizados
Artigo
 Inglês (pdf)
 Artigo em XML
 Referências do artigo
Indicadores

Links relacionados
-
 Citado por Google
 -
 Similares em Google
Compartilhar

 Permalink
Journal of Contemporary Management
versão On-line ISSN 1815-7440
JCMAN vol.8 no.1 Meyerton 2011
RESEARCH ARTICLES
Generation y's complaint behaviour and desired service recovery in the South African cellphone industry
Z VercueilI; DJ PetzerII; CF De MeyerIII
IDepartment of Marketing Management, University of Johannesburg
IIDepartment of Marketing Management, University of Johannesburg
IIIDepartment of Marketing Management, University of Johannesburg
ABSTRACT
This article provides insight into Generation Y customers' cellphone network service provider patronage habits; the service failures they have experienced with these providers; their complaint behaviour and the service recovery strategies they consider appropriate. Typical service failures experienced by this cohort include the network not being available; SMSs or MMSs not going through and inadequate network coverage. The results also indicate that Generation Y respondents complain in different ways, and that cellphone network service providers should make provision for different avenues for allowing their customers to complain. Appropriate individual service recovery strategies should also be in place in the event of service failures.
Key phrases: Services marketing, cellphone industry, cellphone network service provider, Generation Y, customer complaint behaviour, service failure, service recovery
1 INTRODUCTION
Minges (1999:586) states that one of the main factors contributing to the rapid growth in the use of cellphones is that it is a substitution for fixed lines and that it reduces long waiting lists for fixed line services. In a study done on cellphone service providers, Oetsmann (2003:1,3) identified that cellphone services provide more affordable access than fixed line services, and due to the ease of cellphone pre-paid services, low-income customers are be able to control their expenditure.
These factors contribute to the increasing demand for cellphone services in South Africa, resulting in cellphone networks being used to full capacity resulting in network traffic congestion. The high levels of network traffic result in various service failures, such as dropped calls, busy networks, network coverage problems, incorrect billing, not receiving voice messages, short messages (SMS) or multi-media messages (MMS) (Mbendi 2010; McCormick 2003:99).
Service failures result in customer dissatisfaction which leads to customer complaints. Wilson, Zeithaml, Bitner and Gremler (2008:373) state that complaint behaviour is an emphatic form of dissatisfaction and can be shown through various forms of responses such as voicing complaints to the business or third parties or exhibiting switching behaviour. In order for cellphone network service providers to respond to customer dissatisfaction and complaint behaviour, it is necessary for them to have service recovery strategies in place. These service recovery strategies can result in customers moving from a state of dissatisfaction to one of satisfaction.
The article aims to investigate the complaint behaviour of Generation Y customers, as well as the service recovery efforts they expect from cellphone network service providers when a serious service failure occurs.
2 LITERATURE BACKGROUND
This section provides a brief description of the cellphone network service provider industry in South Africa. It also focuses on current literature relating to service failure, customer complaint behaviour and service recovery, all concepts relevant to this article.
2.1 BACKGROUND
The cellphone network service provider industry has grown rapidly over the last ten years with five competitors existing in the market at the end of 2010 (South Africa.info 2010:Internet). Vodacom and MTN established themselves in the South African market in 1993 and 1994 respectively, with Cell C entering the market in 2001 (Cell C 2010a:Internet; Datamonitor 2010:7). Virgin Mobile entered the market in 2004, with the fifth competitor 8ta joining at the end of 2010 (MyBroadband 2010:Internet; Virgin 2010:Internet). Vodacom is the market leader with just over half of the market share, followed by MTN who holds a third of the market (32%) and Cell C (14.5%), while Virgin Mobile is aiming to increase its market share to 10% in the near future (Cell C 2010b:Internet; MTN 2009:Internet; Virgin Mobile 2009:Internet; Vodacom 2009:Internet).
Although cellphone patronage is increasing worldwide, the highest growth rate occurred in Africa with an annual average growth rate of cellphone subscribers reaching 50.9% between 2001 and 2006. In comparison, Asia had a growth rate of 23.1%, America 20.1%, Europe 17.4% and Oceania a growth rate of 11.9% during the same period (ITU 2010:Internet). According to Sutherland (2008:8), South Africa has shown rapid growth in the number of cellphone users which has led to the market almost reaching its saturation point in 2008.
The rapid expansion in the number of cellphone users created major network congestion problems on the South African cellular networks. Due to the inability of the networks to cope with demand, South African cellphone users are experiencing frequent service failures such as dropped calls, networks that are not available, SMSs or MMSs not going through, and inadequate network coverage from network service providers (McCormick 2003:99).
It is the contention of the authors that it is important for marketers in the cellphone network service provider industry to understand Generation Y customers' complaint behaviour when a service failure occurs, as well as how to implement a service recovery strategy when a service failure occurs. According to Schiffman, Kanuk and Hansen (2008:471), Generation Y customers are those who are born between 1977 and 1994. They are characterised as technologically savvy customers with high levels of independence, assertiveness and curiosity. The importance of studying Generation Y and their complaint behaviour is supported by Kumar and Lim (2008:570), who state that since Generation Y customers outnumber any other age cohort in cellphone usage, they are an important target market for cellphone network service providers to ensure future profitability.
According to Bakewell and Mitchell (2003:226), this generation is not only very materialistic, but also a driving force behind the customer culture evident worldwide.
Lower (2008:80) adds that Generation Y customers like to be entertained and stimulated; are highly adaptable; process information quickly; are eager to embrace change; and always seek the next challenge. Generation Y is also early adaptors of new and innovative technology. All these characteristics make this generation a lucrative market for products such as cellphones.
2.2 SERVICE FAILURE
Service failures occur when the service encounter experienced by customers falls short of their expectations of the service (Michel 2004:367). Zeithaml, Bitner and Gremler (2006:85) state that services are heterogeneous in nature and that service performance varies between providers, employees and industries. The authors add that the extent to which customers recognise and accept these variations are called the 'zone of tolerance'. The 'zone of tolerance' represents the space between the two levels of customer expectations namely, the adequate service level and the desired service level. When a service is encountered within this range, customers are satisfied with the service and satisfaction remains relatively stable. The perception of a service failure arises when the service provided drops below the adequate service level and customers experience dissatisfaction (Zeithaml et al. 2006:85).
Service failures can generally be grouped into three main categories: (i) service failures related to service delivery system failures (such as unavailable or very slow service); (ii) service failures related to employee responses to customer needs and requests; and (iii) service failures as a result of unprompted and unsolicited employee action (Hoffman & Bateson 2001:352-361).
According to Cranage, Sujan and Godbey (2005:209), customers can respond to a service failure in a number of ways, such as complaining, not complaining, exiting or exhibiting switching behaviour, or by staying loyal. The focus of this article is on possible customer complaint behaviour as a customer response to service failure and is subsequently discussed.
2.3 CUSTOMER COMPLAINT BEHAVIOUR
As mentioned above, one of the repercussions or responses to service failures that businesses have to deal with is complaints from customers (Cranage et al. 2005:209). Ngai, Heung, Wong and Chan (2007:1377) suggest that a complaint can be seen as an action taken by an individual, and it usually involves the communication of something negative with regard to a product or service. Wilson et al. (2008:373) as well as Lovelock and Wirtz (2007:391) postulate that customers who exhibit complaint behaviour usually fall into three categories i) public action (including complaining to the business, complaining to a third party or taking legal action); ii) private action (including switching to a competitor or negative word-of-mouth communication), and iii) taking no action.
Velázquez, Contrí, Saura and Blasco (2006:509) conducted a study with the main objective to analyse the relationship between the different determinants of complaint behaviour. This study concluded that complaint behaviour generally differs according to the customers' type of response to dissatisfaction. Velazquez et al. (2006:509) opine that factors such as the customers' attitude towards complaining, the importance of the situation or product or service, and the probability of the success of the complaint, make a dominant contribution to the explanation of different complaint actions.
Gil, Hudson and Quintana (2006:51) distinguish between two types of service encounters; firstly routine encounters that meet and satisfy the expectations of customers the first time, and the second type of encounter is the service recovery encounter. The service recovery encounter responds to the complaint of a customer and involves actions taken by a business in response to a service failure. Service encounters and service recovery play a critical role in gaining customer loyalty, as once a negative service encounter has been experienced, service recovery is critical to retain loyal customers (Gil et al. 2006:51).
2.4 SERVICE RECOVERY
Zeithaml et al. (2006:214) explain that service recovery can be defined as the action taken by a service provider in response to a service failure. Research has shown that when service providers react effectively towards service failures, it has a strong impact on customer satisfaction, complaint behaviour, word-of-mouth and loyalty. Effective service recovery strategies have multiple impacts such as i) it increases customer satisfaction and loyalty, ii) generates positive word-of-mouth, iii) provides information on how to improve the service, iv) increased experience in service recovery which increases the likelihood for businesses to perform the service right the first time (Zeithaml et al. 2006:214).
Service recovery expectations can be defined as the method by which the customer believes the problem or service failure should be solved (Harris, Grewal, Mohr & Bernhardt 2006:427). Zeithaml et al. (2006:221) identified four expectations that customers might have in terms of service recovery, namely expecting the business to be accountable (including acknowledging and providing an explanation for the failure); expecting to be helped quickly and efficiently; expecting some form of compensation for the service failure and expecting to be treated fairly in the process.
Hoffman and Bateson (2001:366-369) recommend that service recovery strategies allow businesses to i) measure the costs of the service recovery, ii) actively encourage complaints, iii) anticipate needs for service recovery, iv) respond quickly, v) train employees for service recovery by creating customer awareness among employees and empowering staff, and vi) give feedback to customers to let them know how the customer complaint made a difference in the service process of the business.
3. PROBLEM STATEMENT, OBJECTIVES AND RESEARCH HYPOTHESES
The cellphone network provider industry has grown rapidly over the past decade. With the increasing demand for cellphone service provider networks, customers are encountering service failures which lead to customers complaining about the service received. In studying customers' complaint behaviour, businesses can gain a clearer understanding of customers and why they complain. Suggestions can then be made on how to prevent, rectify, and recover from service failures.
This study focuses on Generation Y customers and their complaint behaviour. The question remains do Generation Y customers complain when encountering a service failure from a cellphone network provider, and if they do, to what extent do they complain? The researchers are therefore of the opinion that an opportunity exists for investigating Generation Y customers' complaint behaviour.
The following primary objective is formulated for the study: To determine the complaint behaviour of, and subsequent service recovery efforts desired by Generation Y customers if their cellphone network service provider fails.
The following secondary objectives support the study:
• Uncover demographic characteristics of Generation Y customers.
• Uncover the service failures Generation Y customers have experienced with their cellphone network service provider.
• Determine how Generation Y customers react when suffering a service failure caused by their cellphone network service provider.
• Determine the appropriate service recovery strategy for Generation Y customers when experiencing a service failure caused by their cellphone network service provider.
• Determine whether significant differences exist in terms of demographic and patronage variables with regard to Generation Y customers' actual complaint behaviour when suffering a service failure caused by their cellphone network service provider.
• Determine whether significant differences exist in terms of demographic and patronage variables with regard to Generation Y customers' perception of the appropriate individual service recovery strategies.
The following research hypotheses were formulated for the study:
H1 There are significant differences in terms of demographic and patronage variables with regard to Generation Y customers' actual complaint behaviour when suffering a service failure caused by their cellphone network service provider. This hypothesis is further refined as follows:
H1a There are significant differences in terms of gender with regard to Generation
Y customers' actual complaint behaviour when suffering a service failure caused by their cellphone network service provider.
H1b There are significant differences in terms of the cellphone network service providers Generation Y customers' use, and their actual complaint behaviour when suffering a service failure caused by their cellphone network service provider.
H1c There are significant differences in terms of the type of cellphone network service customer and their actual complaint behaviour when suffering a service failure caused by their cellphone network service provider.
H1d There are significant differences in terms of the length of time that Generation
Y customers use a cellphone network service provider, and their actual complaint behaviour when suffering a service failure caused by their cellphone network service provider.
H2 There are significant differences in terms of demographic and patronage variables with regard to Generation Y customers' perception of the appropriate individual service recovery strategies. This hypothesis is further refined as follows:
H2a There are significant differences in terms of gender with regard to Generation Y customers' perception of the appropriate individual service recovery strategies.
H2b There are significant differences in terms of the cellphone network service providers Generation Y customers' use and their perception of the appropriate individual service recovery strategies.
H2c There are significant differences in terms of the type of cellphone network service customer and their perception of the appropriate individual service recovery strategies.
H2d There are significant differences in terms of the length of time that Generation Y customers use a cellphone network service provider, and their perception of the appropriate individual service recovery strategies.
4. METHOD
4.1 SAMPLE AND DATA COLLECTION
The target population for this study included the Generation Y age cohort, more specifically university students registered for second and third-year marketing at a university in the Gauteng province of South Africa. The study made use of a descriptive research design which is quantitative in nature, with a convenience sampling method to select respondents, as McDaniel and Gates (2005:373) state that this type of sampling method allows the researcher to target a large sample when money and time are limited.
A survey method was used for this particular study and provides an advantage, such as the ease of administering the questionnaire. Self-administered questionnaires were used to collect responses. A total of 331 questionnaires were completed.
4.2 MEASURING INSTRUMENT
The questionnaire used for this study was based on a previous study conducted by Yuksel, Kilinc and Yuksel (2006:17) and was pretested before it was fielded among the target population. The questionnaire consisted of four sections in addition to the introductory section. The four sections included structured questions or closed-ended questions. The introductory section of the questionnaire entailed the instructions for respondents. Two screening questions were included in this section to ensure only data from respondents who currently use a cellphone and who had experienced a service failure in the six months prior to the survey were collected. Only respondents who use Vodacom, MTN, Cell C or Virgin Mobile were included in the study, as the fifth service provider, 8ta, only entered the market after data had been gathered.
Section A obtained a demographic profile of the respondents and information on the respondents' cellphone network service provider patronage habits. Section B gathered information about respondents' general attitude towards complaining, using a modified five-point Likert scale that measures the perception of the respondent by requiring the respondent to indicate his/her level of agreement with a number of items or statements where 1 is 'strongly disagree' and 5 is 'strongly agree'.
Section C obtained information about service failures that respondents have experienced. Section D, the final section of the questionnaire gathered information about respondents' likely complaint behaviour following a service failure. Section D also included a modified five-point Likert scale (as in Section B) to measure service recovery related statements.
4.3 DATA ENTRY, EDITING, CODING AND ANALYSIS
The data on the questionnaires was coded, entered and edited for analysis using the Statistical Package for Social Sciences (SPSS), renamed as Predictive Analytics Software (PASW version 18) in 2010. The data analysis firstly involved the examination of the frequency distribution of the results for each of the scale items included so as to determine whether the data was normally distributed. The normality of the distribution of results of each scale item was determined in order to determine whether parametric or non-parametric tests should be used to test the hypotheses formulated for the study. The distribution of results can be considered normal if it exhibits a skewness of less than an absolute value of 2.00 and a kurtosis of the distribution of less than 7.00 (West, Finch & Curran 1995:79). All scale items used fall within these parameters. Based on this fact and the fact that the sample size is relatively large (n = 331), parametric test were considered suitable for hypotheses testing.
Descriptive statistics (frequencies, percentages, mean scores and standard deviations) were calculated, where applicable, for the different questions asked in the questionnaire to allow for statistical comparison. For hypothesis testing, a p-value of 0.05 or less (a 95% confidence interval and a subsequent 5% level of significance) was indicative that the hypothesis may be supported.
An independent sample t-test was used to determine whether significant differences exist in terms of gender with regard to respondents' actual complaint behaviour when suffering a service failure caused by their cellphone network service provider. The same test was used to determine if respondents differ, based upon the type of cellphone network service customers (prepaid versus contract) they are and their actual complaint behaviour when suffering a service failure caused by their cellphone network service provider. Independent sample t-tests were used to determine differences between the abovementioned groups of respondents in terms of their perception of appropriate individual service recovery strategies the service providers should implement in case of a severe service failure.
A one-way analysis of variance (ANOVA) was furthermore used to test for significant differences in terms of different groups, based upon the cellphone network providers Generation Y customers use; their actual complaint behaviour when suffering a service failure caused by their service providers, and also in terms of the cellphone network service providers Generation Y customers use and their perception of the appropriate individual service recovery strategies the service providers should offer. A one-way analysis of variance (ANOVA) was also used to determine whether there are significant differences in terms of the length of time that Generation Y customers use a cellphone network service provider and their actual complaint behaviour. The same test was used to determine whether there are significant differences in terms of the length of time that Generation Y customers use a cellphone network service provider, and their perception of the appropriate individual service recovery strategies the service provider should implement in case of a severe service failure.
5. RESULTS
This section provides the results obtained regarding the demographic characteristics of respondents; respondents' cellphone network service provider patronage behaviour; service failures experienced; reactions when experiencing service failures and appropriate service recovery strategies they expect.
5.1 DEMOGRAPHIC PROFILE OF RESPONDENTS
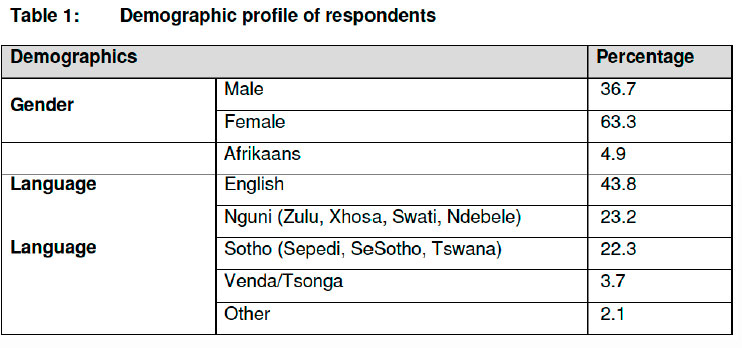
Of the 331 respondents who participated in the study, 36.7% were male and 63.3% were female. The majority of the respondents' home language is English (43.8%) with 23.2% speaking Nguni languages, followed by 22.3% speaking Sotho. Table 1 reflects the demographic profile of participating respondents.
5.1.1. Information regarding respondents1 cellphone network service provider patronage habits
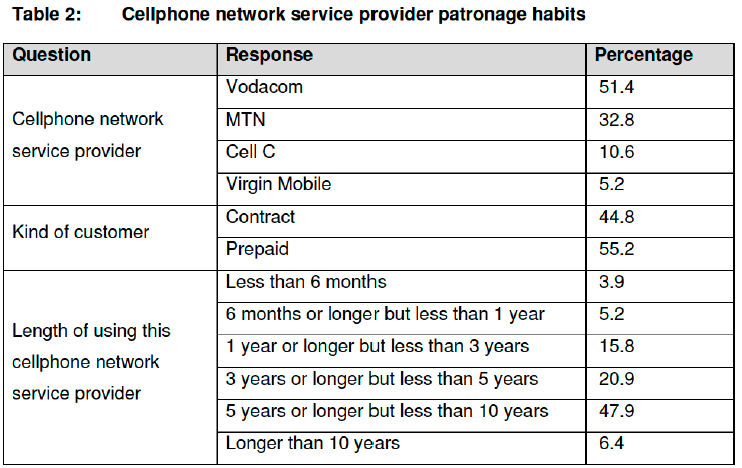
Table 2 presents respondents' cellphone network service provider patronage habits in terms of the service provider they are currently using; the kind of customer that they are; and the length of time that they have been using their current cellphone network service provider.
Table 2 indicates that the majority of respondents use Vodacom (51.4%), followed by MTN (32.8%), Cell C (10.6%) and Virgin mobile (5.2%) as cellphone network service providers. The majority of respondents are prepaid customers (55.2%) and 44.8% of respondents have a contract with the cellphone network service provider. The largest percentage of respondents have been with their respective cellphone network service providers for 5 years or longer, but less than 10 years (47.9%), with 20.9% of respondents being with the cellphone network service provider for 3 years or longer, but less than 5 years.
5.2 SERVICE FAILURES EXPERIENCED BY RESPONDENTS
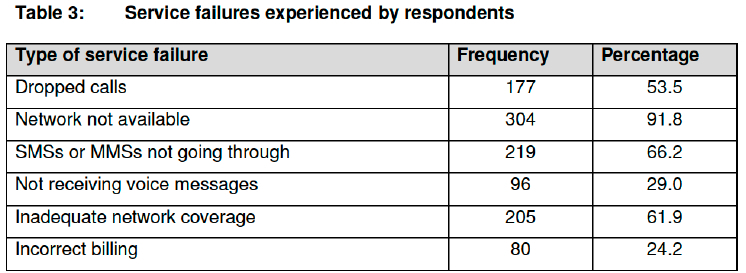
Respondents also had to indicate which service failures they have experienced with their cellphone network service provider in the 6 months prior to the study. Respondents were given the option to choose more than one service failure in this instance. Table 3 indicates the frequency and the percentage of each different service failure as indicated by the respondents.
The table above indicates that service failure experienced most by respondents is unavailable networks (91.8%), followed by SMSs or MMSs not going through (66.2%). Other service failures experienced included inadequate network coverage (61.9%) and dropped calls (53.5%). The service failures with the lowest responses included not receiving voice messages (29.0%) and incorrect billing (24.2%).
5.3 REACTIONS OF RESPONDENTS WHEN EXPERIENCING A SERIOUS SERVICE FAILURE
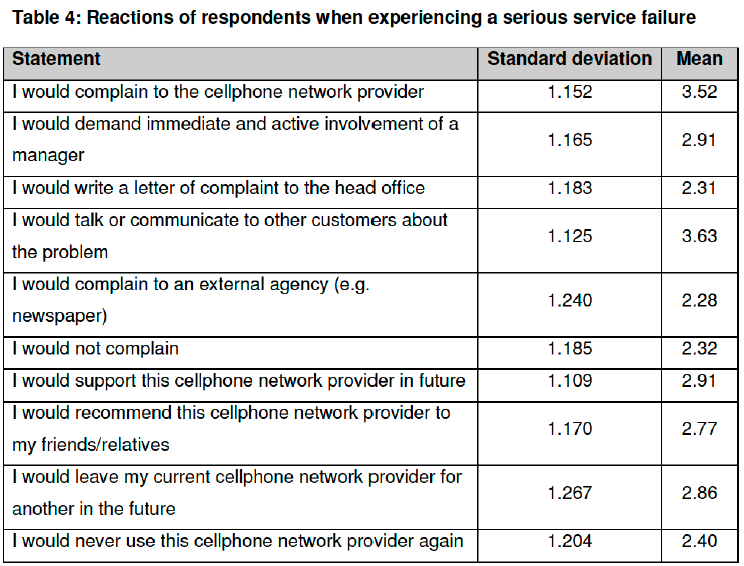
Table 4 provides the standard deviations and mean scores for the level of agreement respondents indicated when presented with possible reactions they would show when presented with what they regard as a serious service failure on the part of the cellphone network service provider.
Respondents agreed most strongly with the statement Ί would talk or communicate to other customers about the problem' (mean = 3.63), followed by Ί would complain to the cellphone network provider' (mean = 3.52). A possible reaction to a serious service failure they agreed with the least, was Ί would never use this cellphone network provider again' (mean = 2.40).
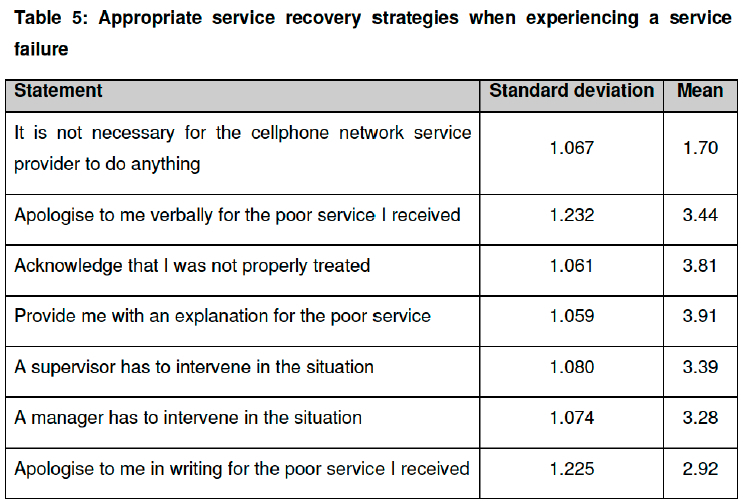
5.4 APPROPRIATE SERVICE RECOVERY STRATEGIES WHEN EXPERIENCING A SERVICE FAILURE
When respondents were asked to indicate the extent to which they thought the following responses from the cellphone network service provider would be appropriate following a serious service failure, the following results became apparent (Table 5).
Respondents agreed most strongly with the statement that the cellphone network service provider should provide the respondent with an explanation for the poor service (mean = 3.91), followed by an acknowledgment that the respondent was not properly treated (mean = 3.81). Respondents agreed least with the statements that it is not necessary for the cellphone network service provider to do anything (mean = 1.70), and that the service provider should apologise to the respondent in writing for the poor service received (mean = 2.92).
5.5 RESULTS OF HYPOTHESES FORMULATED FOR THE STUDY
Several findings were observed with respect to hypotheses formulated for this study. With regard to hypothesis 1 there are significant differences in terms of demographic and patronage variables with regard to Generation Y respondents' actual complaint behaviour when suffering a service failure caused by their cellphone network service provider, the following were uncovered:
• Male and female respondents differ significantly in terms of the scale item Ί would complain to an external agency', where male respondents are significantly more willing to complain (mean = 2.54) than females (mean = 2.12; p-value = 0.03) when suffering a service failure caused by their cellphone network service provider (H1 a).
• There are significant differences in terms of the cellphone network service providers Generation Y respondents' use and their actual complaint behaviour when suffering a service failure caused by their cellphone network service provider in the following instances: respondents from different cellphone network service providers differ in terms of the statement Ί would support this service provider in the future', where respondents from Vodacom (mean = 3.01) and MTN (mean = 3.00) are significantly more willing to support their service providers in the future than respondents from Cell C (mean = 2.17) or Virgin Mobile (mean = 2.81; p-value < 0.000). Respondents also differ significantly regarding the statement 'I would recommend this cellphone network provider to my friends and relatives, where respondents from Vodacom (mean = 2.96) and MTN (mean = 2.80) are significantly more willing to recommend their cellphone network provider than respondents from Cell C (mean = 1.94) or Virgin Mobile (mean = 2.53; p-value < 0.000). Another finding includes a difference between respondents in terms of the statement 'I would never use this cellphone network provider again', where respondents from Cell C (mean = 2.83) and Virgin Mobile (mean = 2.94) are less willing to use the cellphone network provider again than respondents from Vodacom (mean = 2.32) or MTN (mean = 2.30; p-value = 0.024) (H1b).
• Contract respondents differ significantly from prepaid customers in terms of their actual complaint behaviour when suffering a service failure caused by their cellphone network service provider in the following two instances: there are significant differences in terms of the type of cellphone network customer and whether they would write a letter of complaint to the head office, where prepaid respondents (mean = 2.45) are more willing to write a letter than contract respondents (mean = 2.15; p-value = 0.025). A significant difference between contract respondents (mean = 2.62) and prepaid respondents (mean = 2.89) in terms of whether they would recommend the cellphone network provider to friends and family (p-value = 0.041) was observed (H1c).
• There are significant differences in terms of the length of time that Generation Y respondents use a cellphone network service provider, and their actual complaint behaviour when suffering a service failure caused by their cellphone network service provider in the following instance: respondents who have been with their service provider for more than 6 months but less than a year (mean = 3.29), would demand immediate and active involvement from a manager significantly more than those respondents that have been with their service provider for longer than 10 years (mean = 2.70; p-value = 0.499) (H1d).
Hypothesis 1 can be partially supported, since it can be concluded that a number of significant differences exist in terms of demographic and patronage variables with regard to Generation Y respondents' actual complaint behaviour when suffering a service failure caused by their cellphone network service provider.
The following findings with respect to hypotheses 2, that there are significant differences in terms of demographic and patronage variables with regard to Generation Y respondents' perception of the appropriate individual service recovery strategies, were uncovered.
• There are significant differences in terms of gender with regard to Generation Y respondents' perception of the appropriate individual service recovery strategies. Female respondents require an explanation for the poor service (mean = 3.98) more than male respondents (mean = 3.79; p-value = 0.122) (H2a).
• There are no significant differences in terms of the cellphone network service providers Generation Y respondents' use and their perception of the appropriate individual service recovery strategies (H2b).
• There are significant differences in terms of the type of cellphone network service customer and their perception of the appropriate individual service recovery strategies. Contract respondents have a higher perception that a manager should intervene in the service recovery attempt (mean = 3.44) than prepaid respondents (mean = 3.34; p-value = 0.42) (H2c).
• There are significant differences in terms of the length of time that Generation Y respondents use a cellphone network service provider, and their perception of the appropriate individual service recovery strategies. The independent sample t test, however, showed that there is a difference in the length of time that a respondent has been with a service provider and his/her perception of an appropriate service recovery strategy. Respondents who have been with their service provider for longer than 1 year but less than 3 years (mean = 4.01), have a higher perception that the service provider needs to provide them with some form of compensation than respondents who have been with their service provider for 3 years or longer (mean = 3.66; p-value = 0.025) (H2d).
Hypothesis 2 can be partially supported, since it can be concluded that there are significant differences in terms of demographic and patronage variables with regard to Generation Y respondents' perception of the appropriate individual service recovery strategies.
6. MANAGERIAL IMPLICATIONS AND RECOMMENDATIONS
The results of the study indicate that Vodacom is the service provider of choice for Generations Y customers taking part in this study when it comes to providing continued support of a service provider after a service failure and recommending a service provider to friends and relatives. Marketing managers from other cellphone service network providers should take investigate the service strategies Vodacom implements and should perhaps benchmark their own service strategies against Vodacom.
In terms of the type of cellphone network customer, the majority of respondents are prepaid customers. The implication is that marketing managers at cellphone service network providers should either convert these customers to contract customers to make switching more difficult, or have other retention strategies in place to keep prepaid customers loyal. Such strategies could include providing discounts or additional services or lower rates.
The results also indicate that respondents are relatively loyal towards their cellphone network providers, especially in the case of Vodacom and MTN. Vodacom and MTN marketing managers should therefore continue using their superiority in the market as a marketing initiative to retain customers. Cell C and Virgin Mobile marketing managers should develop better service strategies and ensure complaint resolution as soon as possible which can be used to improve their image in the market which could lead to more customers.
Marketing managers can furthermore use the information regarding customer loyalty to their advantage and target customers with loyalty and reward programmes that reward loyalty in a tangible way such as free minutes, SMS bundles and/or reduced call and other service rates. This could be especially useful to foster loyalty amongst those that are less loyal and prone to possible switching behaviour.
Results indicate furthermore, that the majority of respondents regularly experience service failures such as networks that are not available, SMS or MMS messages not going through, as well as inadequate network coverage. Marketing managers need to address the issue of networks that get overloaded with users, which results in inadequate network coverage or completely unavailable networks. Networks and infrastructure should be upgraded to handle the demand placed upon them to reduce the number of service failures experienced.
The results of the study also indicate the Generation Y customers are more inclined to engage in negative word-of-mouth following a service failure. As this Generation uses technology and social networking to communicate with others, cellphone network service providers should appoint social media liaisons to quickly react to negative word-of-mouth that is spread on blogs or social networking sites. By reacting quickly to the negative word-of-mouth, marketing managers at cellphone network service providers could improve satisfaction levels and be seen by customers as caring about their problems.
Respondents differ significantly in terms of gender and the length of time that they have been customers of their respective cellphone network service providers when complaining. Male respondents are more demanding than female respondents when complaining, and respondents who have been with a service provider for more than 6 months but less than a year would demand immediate and active involvement from a manager significantly more than those respondents who have been with their service providers for longer than 10 years. Implications of these findings are that marketing managers need to provide customers with different complaint channels, for instance marketing managers can provide customers with the choice to include managerial involvement in their complaint (specifically for contract customers), or simply to voice a complaint to the person responsible. Other avenues should be presented to encourage complaint behaviour, such as a toll free complaint line or the ability to complain on a website.
Contract customers should be encouraged to register on their cellphone network providers' website where specific avenues for complaining and complaint tracking and resolution can be provided. Marketing managers furthermore need to make use of databases as a convenient tool to identify and classify short-term and long-term customers (amongst other classifications). Short-term customers are new customers and have higher expectations for the service provider than old customers. Marketing managers who know that they are dealing with a new customer can identify certain touch points in the service delivery process beforehand, and anticipate certain service failures that may arise. Employees of the cellphone network service provider should have access to determine how long the customer has been with the service provider and be trained in dealing with customer complaints and the implementation of complaint recovery strategies.
Furthermore, significant differences were uncovered in terms of the cellphone network service providers Generation Y respondents' use and their perception of the appropriate individual service recovery strategies. Significant differences in terms of the type of cellphone network service customers and their perception of the appropriate individual service recovery strategies were observed. Implications for these findings are that marketing managers need to determine what their specific customers feel in order to develop appropriate recovery strategies, as generic strategies will not work. This is due to the fact that respondents differ significantly in terms of the cellphone network service providers Generation Y customers use, and their perception of the appropriate individual service recovery strategies. Marketing managers can obtain this information through the use of service and complaint surveys that are sent out to customers to complete. Cellphone network service providers can provide customers with a blog space on their website, where customers can talk to each other and identify appropriate recovery strategies.
The results of the study also revealed that prepaid respondents also differ in terms of their perception of the appropriate individual service recovery strategy compared to contract respondents. Marketing managers need to customise their recovery strategies for their different types of customers (prepaid versus contract customers). Marketing managers will not be able to use a standard recovery strategy (such as a formal apology from the business) and recovery strategies should therefore be customised. Prepaid customers may receive free airtime as an apology or an attempt to recover from a service failure, whereas contract customers can receive a discount of for example, 10% on an account.
7. LIMITATIONS AND FUTURE RESEARCH
As a convenience sample was used, the results of the study are only representative of those who participated in this research study. This imposes limitations to the generalisation of the results of the study to the entire South African population. For this reason, it is recommended that the study be conducted on a greater variety of customers such as those from other geographical areas, age groups, backgrounds and cultures to determine whether these variables influence the complaint behaviour of cellphone users.
8. CONCLUSION
The research investigates the cellphone service provider patronage habits of Generation Y customers as well as the service failures they experience with their cellphone service providers. The research also provides an exposition of their complaint behaviour once a service failure is experienced. The research lastly uncovers the most suitable service recovery strategies to implement in order to return these customers to a desirable level of satisfaction.
This makes a significant contribution to the understanding of the way Generation Y customers experience service failure, react to them and how they would like cellphone service providers to compensate for these failures.
REFERENCES
BAKEWELL C & MITCHELL VW. 2003. Generation Y female consumer decision making styles: an exploratory study. International Journal of Retail and Distribution Management, 31(2):95-106. [ Links ]
CELL C. 2010a. Cell C is ahead of the curve. [Internet: cellc.co.za/about/vision; downloaded on 2010-12-03. [ Links ]]
CELL C. 2010b. About us. [Internet: cellc.co.za/about/overview; downloaded on 2011-01-18. [ Links ]]
CRIÉ D. 2003. Consumers' complaint behaviour: taxonomy, typology and determinants: towards a unified ontology. Database Marketing and Customer Strategy Management, 11(1):60-79. [ Links ]
CRANAGE D.A, SUJAN H & GODBEY G. 2005. Sharing the responsibility for service failure with customers: the effects of informed choice and outcome foreseeability on customer loyalty and exit. Journal of Hospitality & Leisure Marketing, 13(3/4):207-239. [ Links ]
DATAMONITOR. 2010. Vodacom Group Limited. Datamonitor: 1-26. [ Links ]
GIL SM, HUDSON S & QUINTANA TA. 2006. The influence of service and loyalty on perceived service quality: a study of hotel customers in Spain. Journal of Hospitality and Leisure Marketing, 14(2):47-68. [ Links ]
HARRIS KE, GREWAL D, MOHR LA & BERNHARDT KL. 2006. Consumer response to service recovery strategies: the moderating role of online versus offline environment. Journal of Business Research, 59:425-431. [ Links ]
HOFFMAN KG & BATESON JEG. 2001. Essentials of services marketing: concepts, strategies & cases. 2nd Edition. Sydney: South Western. [ Links ]
ITU. 2010. Information and communication technology (ICT) statistics. [Internet: itu.int/ITU-D/ict/index.html; downloaded on 2010-12-03. [ Links ]]
KUMAR A & LIM H. 2008. Age differences in mobile service perceptions. Journal of Services Marketing, 22(7):568-577. [ Links ]
LOVELOCK C & WIRTZ J. 2007. Service marketing: people, technology, strategy. 6th Edition. Upper Saddle River, New Jersey: Pearson Prentice Hall. [ Links ]
LOWER J. 2008. Brace yourself here comes Generation Y. Critical Care Nurse, 28(5):80-84. [ Links ]
MBENDI. 2010. Telecommunications in South Africa - SA cellular industry. [Internet: www.mbendi.com/indy/cotl/tlcm/af/sa/p0005.htm; downloaded on 2010-10-11. [ Links ]]
MCCORMICK PK. 2003. Telecommunications reform in Southern Africa: the role of the Southern African Development Community. Telecommunications Policy, 27:95-108. [ Links ]
MCDANIEL C & GATES R. 2005. Marketing research. 7th Edition. Hoboken, New Jersey: Wiley. [ Links ]
MICHEL S. 2004. Consequences of perceived accessibility of a bank's service failures. Journal of Financial Services Marketing, 8(4):367-377. [ Links ]
MINGES M. 1999. Mobile cellular communications in the Southern African region. Telecommunications Policy, 23:585-593. [ Links ]
MTN. 2009. About MTN group. [Internet: mtn.com/aboutmtngroup/groupfootprint/southandeastafrica/southandeastafrica_southafrica.aspx; downloaded on 2011-01-18. [ Links ]]
MYBROADBAND. 2010. 8ta powered by Telkom: Pricing and other details. [Internet: mybroadband.co.za/news/telecoms/15836-8ta-powered-telkom-pricing-and-other-details.html; downloaded on 2010-12-03. [ Links ]]
NGAI EWT, HEUNG VCS, WONG YH & CHAN FKY. 2007. Customer complaint behaviour of Asians and non-Asians about hotel services: an empirical analysis. European Journal of Marketing, 4(11/12):1375-1391. [ Links ]
OETSMANN S. 2003. Mobile operators: their contribution to universal services and public access. Vancouver, Canada: Intelecon Research & Consultancy Ltd. [Internet: intelecon_research.com/pdf/mobile%20%26%20us%20-%20for%20rru.pdf; downloaded on 2010-12-03. [ Links ]]
SCHIFFMAN LG, KANUK LL & HANSEN H. 2008. Consumer behaviour: a European outlook. Harlow: Prentice Hall. [ Links ]
SOUHAFRICA.INFO. 2010. South Africa's telecommunications. [Internet: southafrica.info/business/economy/infrastructure/telecoms.htm; downloaded on 2010-12-03. [ Links ]]
SUTHERLAND E. 2008. Counting mobile phones, sim cards and customers. LINK Centre, 1-10, April, 19. [Internet: link.wits.ac.za/papers/link-Mobile_numbers.pdf; downloaded on 2010-12-03. [ Links ]]
VELÁZQUEZ BM, CONTRÍ GB, SAURA IG & BLASCO MF. 2006. Antecedents to complaint behavior in the context of restaurant goers. International Review of Retail, Distribution and Consumer Research, 16(5):493-517. [ Links ]
VIRGIN MOBILE. 2009. Press release. [Internet: virginmobile.co.za/press/php; downloaded on 2011-01-18. [ Links ]].
VIRGIN. 2010. Virgin Mobile South Africa. [Internet: virgin.com/company/virgin-mobile-south-africa/; downloaded on 2010-12-03. [ Links ]]
VODACOM. 2009. Annual report. [Internet: vodacom.com/reports/ar_2009/gr_group_glance.php; downloaded on 2011-01-18. [ Links ]]
WEST SG, FINCH JF & CURRAN PJ. 1995. Chapter 4: Structural equation models with non-normal variables: problems and remedies In HOYLE RH (ed). 56-75. Newbury Park, California: Sage. pp. 56-75. [ Links ]
WILSON A, ZEITHAML VA, BITNER MJ & GREMLER DD. 2008. Services marketing: integrating customer focus across the firm. 1st European Edition. London: McGraw-Hill. [ Links ]
YUKSEL A, KILINC UK & YUKSEL F. 2006. Cross-national analysis of hotel customers' attitudes toward complaining and their complaining behaviours. Tourism Management, 27:11-24. [ Links ]
ZEITHAML VA, BITNER MJ & GREMLER DD. 2006. Services marketing: integrating customer focus across the firm. 4th Edition. Boston, Massachusetts: McGraw Hill. [ Links ]

