


Serviços Personalizados
Artigo
 Inglês (pdf)
 Artigo em XML
 Referências do artigo
Indicadores

Links relacionados
-
 Citado por Google
 -
 Similares em Google
Compartilhar

 Permalink
Journal of Contemporary Management
versão On-line ISSN 1815-7440
JCMAN vol.6 no.1 Meyerton 2009
RESEARCH ARTICLES
To queue or not to queue: an industrial retailer's perspective
A GarnettI; DR GarnettII
IDepartment of Logistics, Vaal University of Technology
IIOperations, IT and Human Resources, Zurich Insurance Company South Africa
ABSTRACT
This article highlights the concept of queue management as a fundamental aspect of the perception of service quality by customers frequenting the retail outlets of an international industrial gas and welding company. To date, research into queuing theory only provides a perspective regarding FMCG retailing. The perceptions of customers regarding inefficient queue management and service delivery were investigated in the industrial retail setting in order to gain perspective on the overall value offered by the company. A hypothesis was made that customers were experiencing service inefficiencies due to system constraints. Based on the internal and external empirical findings, the hypothesis was rejected, but several other problem areas regarding service efficiency and customer relationship management in the industrial retail environment were identified which may be of use for other industrial retailers. A suggested model for mitigating the problem areas was subsequently outlined.
Key phrases: Queuing, industrial retailing, service quality
INTRODUCTION
An organisation may strive for competitive advantages, improved efficiency and effectiveness, performance management or various other strategic imperatives. However, many of these interventions may be voided if an organisation does not address their most important consideration, namely the customer. According to Nicholls et al (1998) the lifeblood of any organisation is undoubtedly their customer. It is the satisfaction of these customers that provides the organisation with the key for continual growth and survival. Service satisfaction is a function of the consumer's experiences and reactions to a provider's behaviour during the service encounter. It is also a function of the service setting. Customer satisfaction provides the necessary linkage between the level of service that an organisation provides, the customer's perception of that service and the customer's future behaviour towards the organisation. A highly satisfied customer will continue to provide repeat business and constant revenues through increased frequency of visits and positive word-of-mouth advertising. This will translate into increased profits for the company. A dissatisfied customer will have the opposite effect. (Grewal et al 2003).
According to Bolton and Drew (1991), satisfaction is the customer's post-purchase evaluation of a product/service offering. A customer is satisfied when an offering performs better than expected and is dissatisfied when expectations exceed performance. Customer satisfaction/dissatisfaction is typically modelled as a function of disconfirmation, arising from discrepancies between prior expectations and actual performance. Grönroos (1983) suggested a paradigm that described service quality as being distinguishable between technical quality (what is done) and functional quality (how it is done). The model indicated the importance of the service provider matching the expected service and the perceived service to one another.
BACKGROUND, RATIONALE AND OBJECTIVES OF THE RESEARCH
When considering the concept of service quality in an organisation, there are several potential areas that could warrant attention. Fisk et al (1993) proposed that service satisfaction centres on four areas, namely: customer expectations of service contrasted with their realization; technical and functional approaches to service satisfaction; influence of time and service quality versus service satisfaction.
The abovementioned, with especial reference to the influence of time on the service satisfaction of customers, was utilised as the basis of the research. This further elicited the concept of queuing and queue management as Davis and Heineke (1994) also point out that the management of queues should be of particular importance to an organisation, as the speed of service delivered has been shown to provide a competitive advantage in the marketplace.
Whilst addressing the topic of customer's views of queuing, Taylor (1994) denotes that the customer's perception of whether or not the service provider is in control of the situation and the manner in which the delayed time is managed or filled will have an indirect impact on the customer's overall rating of value.
It is vitally important for organisations then to exert a degree of control over their relationships with these customers and also the perceptions held by same customers as Davis and Heineke (1994) further elaborate that the customer's perception regarding the performance of the service is more critical that the actual performance itself, although there is frequently a high correlation between the two. This is supported by the work done by Maister (1985) whose fundamental premise was that the perception of the wait determines satisfaction rather than the actual waiting time. He further suggests that people's perception of waiting time is believed to be distorted uni-directionally, so that most customers think they have waited longer than they actually have. Larsons (1987) sums it up succinctly as follows: "waiting is a form of imprisonment, one is doing time-but why? One is being punished not for an offence of one's own, but for the inefficiencies of those who impose the wait. Hence the peculiar rage that waiting engenders, the sense of injustice. Aside from the boredom and physical discomfort, the subtle misery of waiting is the knowledge that one's most precious resource, time, a fraction of one's life, is being stolen away, irrecoverably lost."
Customer waiting can take place at any stage of the purchase process, some waits occur before, during or after the transaction experience. Waiting is considered to have a definite negative effect on the perception of service and service satisfaction. It is therefore one of the most critical service attributes for almost all retailers. A study by Chebat et al (1994) introduced the "halo effect", which concluded that a customer's evaluation of service quality was affected not only by the end service received, but also by the service delivery process itself, which includes waiting time. It is therefore critical, in situations where waiting is inevitable, that companies attempt to provide a high level of satisfaction regarding the waiting portion of the service experience (Davis & Heineke 1998). Very often the actual wait duration can only be controlled and improved upon to a point, the next step would be to manage the customer's perception of the wait (Taylor 1994).
Customers have also indicated that waits provide feelings of uncertainty, anxiety, frustration, annoyance, irritation, stress and anger. Several researchers have shown that when the situation that has caused the delay was avoidable or controllable, then the dominant emotion is that of anger. A higher degree of anger is realised when the customer's perception of the event was that the service provider could have circumvented or mitigated the barrier that prevented the service (Meyer & Mulherin 1980; Reisenzein 1986: Weiner 1980). Similarly, Folkes (1984) found that the more common the delay the less likely that these customers would repurchase.
Research has indicated that the amount of empty queuing time that a person finds tolerable depends on a number of variables; especially the physical environment surrounding the queue, perceptions that a queue is being managed in a socially just manner (i.e. following strictly the first-in-first-out principle), and the presence of indicators of a delay's likely duration (Bennett 1998). Ensuring that there are enough stimuli to keep or occupy the individual's attention can circumvent this. By personally filling the customer's time, a message is conveyed to customers that they have not been forgotten, reducing some of the waiting uncertainty. The time filling could also convey the message that the customer is considered valuable, thereby possibly reducing anger (Taylor 1994).
The research on which this paper is based focused primarily customer's perceptions of service quality and queue management within an industrial company. The organisation on which the research focused (hereafter referred to as Company X) is in the industrial gases and welding industry. This is a global company but the research focused on the South African subsidiary. The industrial retail outlets of Company X are the growth drivers for the organisation and thus seen as the largest opportunity for providing revenue growth. The in-store experience and customer perceptions of service quality are therefore critical areas for the delivery of the planned strategic growth.
The in-store purchasing decision consists of many phases and the one of the facets considered in the compilation of the research problem is the type of relationship that customers have with Company X. The customers could be in the straight re-buy stage or still be in the testing stage. The purchasing process is generally divided into the following areas: locating the product; acquiring technical/product/account information; Making the purchase decision; queuing and completing the purchase transaction. Customers purchasing these products could be in various stages of their decision making, which adds to the purchasing complexity. The organisation is thus required to plan for the differing expectations of customers.
The scope of the research was done on the flow of events from when the customer enters the retail outlet to when leaving with the product/s. Customers frequenting the store could be in various phases of the purchasing decision, depending on the product and relationship maturity, and they could be either the driver or the decision-maker. The following is an example of a possible scenario:
• A mature customer 1 purchasing liquid petroleum gas (hereafter LPG), who is in the straight re-buy phase skips stage 1 - 3 of the purchasing process and moves into stage 4.
• A mature customer 2 who is the decision maker of the business who is purchasing a welding consumable product will have fewer requirements in stage 2, as he will more than likely not request process or technical product information and will move into stage 4.
• A new customer 3 walks into the Company X retail outlet and wishes to start a purchasing relationship with Company X. He would move to stage 4 as the person to assist him is behind the counter.
• A mature customer 4 has completed stages 1 - 4, but is unable to transact due to account problems.
• A driver 5 is sent to collect a list of predefined goods. He moves straight to stage 4.
• A mature customer 6 wishes to purchase a new product and requires sufficient assistance during stage 2 of the purchasing process so that he can complete stage 3. However, he is in stage 4 as the person to assist him is behind the counter.
The above scenario merely requires six customers to be in the store at the same time for these events to occur, which places excess demands on the staffing component of the store and facilitates the possible reduction in service quality. Compounding this problem is that customers can enter at varying times. The customers are deprived of service efficiency due to the fact that they will pass through stages 1 - 3 quickly, but will be delayed in stage 4. The retail staff members are only able to engage with the customer in Stage 5, therefore forcing customers to be delayed in Stage 4, resulting in slower queue management. The main objective of the research study was to determine whether queue management was considered to be a potential problem area in the industrial retail setting, as well as to gain more insight into customer perspectives of service quality offered in the said retail setting.
From the scenario depicted, the problem in question which was researched is that the customers of Company X are experiencing service inefficiencies whilst collecting their products at the Company X retail outlets, which generated to a few possible research questions: What type of service inefficiencies are customers facing? What constitutes value for such a retail customer? What possible changes can be made to improve the overall levels of service satisfaction for the customer? What mechanisms could be instituted to mitigate potential problematic queue management in a retail store? And the hypothesis formulated in line with the research questions is that:
H1: The customers currently frequenting the industrial retail stores of Company X are not satisfied with the length of time it takes to complete the transaction and this is due primarily to system constraints.
METHODOLOGY
The researchers initially made use of an open-ended questionnaire that allowed for a range of possible answers. This was distributed internally amongst employees of company X. The survey was focused mainly on receiving qualitative rather than quantitative data in order to better understand the proposed problem areas in proffering customer service. The researchers identified a list of employees from Company X, comprising representatives from the cross-functional areas (Services, Sales and Retail). A judgement sample of interviewees was drawn based on the following criteria: location to the metropole and direct or indirect regional influence. The researchers made use of structured interviews, which lasted approximately thirty minutes and were either completed by means of face-to-face or telephonic interviews. The data obtained from the internal survey was then used as a basis for developing the survey instrument for the external research.
The external research was primarily focused on customers who frequently collected their products from the Company X industrial retail outlets. A list of 1 500 (sample population) customers was drawn from the Company X database based on their purchasing behaviour. The customers interviewed were then randomly selected from these lists.
The sampling was conducted as follows: given the nature of the research project, a non-probability quota sampling technique was utilised. A total number of 298 customers were interviewed. Samples were determined by region, product category, product use in industry, gender, population group, age and business income. The researchers made use of an experienced, specialised Customer Value Management team to conduct face-to-face interviews with each respondent, based on a structured questionnaire. Each interview lasted approximately forty-five minutes. The Customer Value Management (CVM) methodology utilised by the external marketing research company, was based on service quality research conducted by Parasuraman, Zeithaml and Berry (1988). The constructs evaluated by the CVM process were, however, customised to reflect the South African environment by using inputs from the internal interviews conducted at Company X. The following constructs were measured:
1 Customers' overall value perceptions.
2 The components that make up customer value.
3 The processes that make up the specific components.
4 Specific activities relating to each component of value and service.
5 Loyalty and future intentions.
The research instrument utilised a 10-point scale. Interpretation of the scale for the overall value and for all performance statements was: 1 = 0% (poor value) - 10 = 100% (excellent). Based on industry norms, a rating of 8 on the scale (good) is considered the minimum performance standard. Organisations that are perceived to be providing superior value should be achieving results of more than eighty-nine percent (9 out of 10). The minimum acceptable industry norm is seventy-eight percent. Based on multiple regression analysis, Derived Importance or Impact scores were developed. These impact scores were used to identify drivers and dissatisfiers. For interpretation purposes, drivers and dissatisfiers are distinguished on the following basis:
• High impact - Beta Coefficient of 0.3-1 = Value driver
• Moderate impact - Beta Coefficient of 0.15 - 0.3 = Value driver
• Low impact - Beta Coefficient of less than 0.15 = Dissatisfier / fundamental
RESULTS AND DISCUSSION
The initial findings resulting from the internal survey are as follows: The perceived time spent on the purchase process ranges from fifteen to thirty minutes during peak time and seven to ten minutes during off-peak periods. The most time spent on the purchase process ideally should be between three and five minutes. Three best-in-class competitors were identified and the attributes that made the best-in-class successful were listed as the following: Shop floor assistants; Simple Cash Transaction System; Shelf pricing; Bar-coding; Store layout.
Further interpretation of the findings from the internal research survey identified the following as the perceived problem areas in the industrial retail outlets of Company X: debt issues; staff constraints, as most stores are one-man-driven; lack of product and technical knowledge; lack of pricing information on the shelves and items; incoming phone-calls distract employees; retail aptitude and attitude of the staff currently in the centres is poor; performance measurements are more operations-focused than people-focused and the system for cash sales is too complex requiring too many key strokes. It was hypothesized that all these factors could have a potential effect on the queue management system and customer's perceptions thereof. Further analysis of the data indicated that the root causes of these problems were inter alia: the Order-to-Cash process; the policies and procedures governing the process are not customer-centred; the wrong people are currently fulfilling the role of the order taker and retail outlets are cost-driven and not service-driven.
Based on the conceptualisation of these problem areas, the external research identified the value drivers of the customers frequenting the industrial retail outlets. The research further determined the customers' view of problem areas and opportunities within the retail environment, which could be managed to improve service quality within the stores. Figure 1 illustrates the influence of each component of value on the overall perception of value of the customer.
The following can be deduced from the results: Service efficiency currently has the highest impact on customers' perceptions of overall value and the goal, as a value driver, is a service level of eighty-nine percent. Both customer relationship management and product have been identified as drivers of value perceptions. Price is still important, but affects value perceptions to a lesser degree. Image plays almost no role.
From the figure above it is evident that retail staff is the only value driver in the group of service activities. This means that this must be the specific area of focus required to improve customers' perception of overall value. Both marketing and communication and transactions have a minimal impact on service efficiency and they have to be performed at a minimum industry norm of seventy-eight percent.
The abovementioned figure depicts the current performance levels of the service activities. The performance on the only driver of service efficiency, namely retail staff (at seventy-eight percent) is considerably short of the required target to ensure customer satisfaction (eighty-nine percent). Another point of concern is that marketing and communication (sixty-nine percent) as a business fundamental is also lacking in performance (seventy-eight percent). The transaction (seventy-nine percent) activity is on par with the expected performance to deliver customer satisfaction.
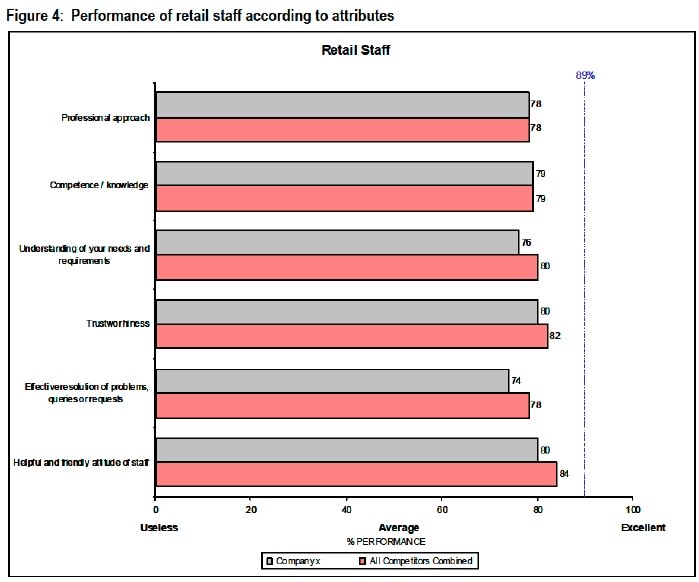
To better understand the opportunity for improving overall customer perception of value, retail staff's performance was further split into specific attributes that needed to be measured. Figure 4 illustrates these attributes.
The figure shows that none of the attributes are close to the desired level of eighty-nine percent. The worst-performing attribute being that of effective resolution of problems, queries or requests (seventy-four percent). When examining the transactions attribute, efficiency of cash transactions was rated as performing at eighty percent, well above the required seventy-eight percent.
CONCLUSIONS AND MANAGERICAL IMPLICATIONS
The initial hypothesis formulated from the research questions was that the customers currently frequenting the industrial retail stores of Company X are not satisfied with the length of time it takes to complete the transaction, due primarily to system constraints. However, a conclusion to be reached based on the results is that the transaction time was not causing dissatisfaction due to the fact that customers had given the cash transaction processing a rating of seventy-nine percent, which is sufficiently meets the required service level of seventy-eight percent. Other concerns are that transaction processing was a business fundamental and not a value driver, therefore even if Company X were to dramatically improve the time spent during the transaction process it would not improve the customers perception of overall value or satisfaction.
The hypothesis has thus been rejected, and the null-hypothesis in this case has been accepted. However, other potential problem areas were identified from the external research which have possible managerial implications. Utilising the findings of the external research it was shown that service efficiency is the largest component that drives value and that the service element within this group that drives the value, was found to be the retail staff which needed to be addressed primarily in order to retain the customers who would consider defecting.
The research showed that the weakest component attributed to retail staff was the effective resolution of problems, queries or requests. Utilising root cause analysis, the researchers decided to direct the focus onto this one specific problem that would provide the best return on investment, namely improving the problem-resolution process at retail outlets. The scope for further research should become far narrower and more focused on the activities that can influence this area of problem resolution. The area regarding resolution of problems required further delineation and the specific issues arising from this were that customers have a problem on their account, customers have a pricing query and customers request particular technical information.
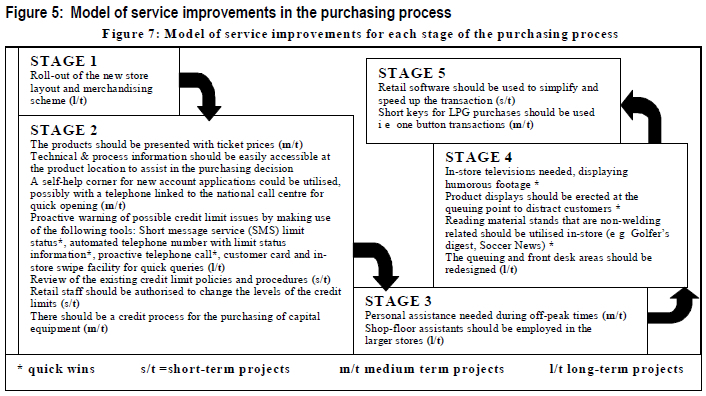
The following model is proposed as a result of the above understanding of the retail environment and the empirical results. Each stage of the purchasing process has been scrutinized and the possible solutions are outlined. The solutions are categorised by ease of implementation, namely quick wins (easiest to implement), short-term projects, medium-term projects and long-term projects. The abovementioned solutions could be implemented in Company X to mitigate the problem areas determined by the research as well as providing insight to other retailers in similar industries regarding customer perceptions. Further research could be undertaken in other environments to verify these results, as the research was limited to the retail situation of one organisation. The model highlights practical solutions to the problem of poor service quality in a retail environment which other organisations should earnestly consider in order to remain competitive.
BIBLIOGRAPHY
BENNETT R. 1998. Queues, customer characteristics and policies for managing waiting-lines in supermarkets. International Journal of Retail and Distribution Management, 26(2):78-87. [ Links ]
BOLTON R. & DREW J. 1991. A longitudinal analysis of the impact of service changes on customer attitudes. Journal of Marketing, 55(1):1-9. [ Links ]
CHEBAT J.C., FILIATRAULT P., GELINAS-CHEBAT C. & VANINSKY A. 1994. Why am I waiting? Effects of customer's mood on the attribution of waiting time and perceived quality of services. Proceeding of the 3rd Annual Research Seminar in Service Management. [ Links ]
DAVIS M.M. & HEINEKE J. 1994. Understanding the roles of the customer and the operation for better queue management. International Journal of Operations and Production Management, 14(5):21-34. [ Links ]
DAVIS M.M. & HEINEKE J. 1998. How disconfirmation, perception and actual waiting times impact customer satisfaction. International Journal of Service Industry Management, 9(1):64-73. [ Links ]
FISK R.P., BROWN S.W. & BITNER M.J. 1993. Tracking the evolution of the services marketing literature. Journal of Retailing, 69(1):61-103. [ Links ]
FOLKES V. 1984. Consumer reactions to product failure: an attributional approach. Journal of Consumer Research, March:421-433. [ Links ]
GREWAL D., BAKER J., LEVY M. & VOSS G.B. 2003. The effects of wait expectations and store atmosphere evaluations on patronage intentions in service-intensive retail stores. Journal of Retailing, 79:259-268. [ Links ]
GRÖNROOS, C. 1983. Innovative marketing strategies and organization structures for service firms. in Berry, L.L., Shostack, G.L. & Upah, G.D., (EdsJ, Emerging Perspectives on Services Marketing. Chicago: American Marketing Society. [ Links ]
LARSONS R.C. 1987. Perspectives on queues: social justice and the psychology of queuing. Journal of Operations Research, Nov-Dec, 35(6):895-905. [ Links ]
MAISTER D.H. 1985. The psychology of waiting lines. in Czepiel, J.A., Solomom, M.R., Surprenant, C.F. (Eds), The Service Encounter: Managing Employee/Customer Interaction in Service Business, MA: Lexington Books. [ Links ]
MEYER J.P. & MULHERIN A. 1980. From attribution to helping: an analysis of the mediating effects of affect and expectancy. Journal of Personality and Social Psychology, 39:201-210. [ Links ]
NICHOLLS J.A.F., GILBERT G.R. & ROSLOW S. 1998. Parsimonious measurement of customer satisfaction with personal service and the service setting. Journal of Consumer Marketing, 15(3):239-253. [ Links ]
PARASURAMAN A., ZEITHAML V.A. & BERRY L.L. 1988. SERVQUAL: a multiple-item scale for measuring consumer perceptions of service quality, Journal of Retailing, 64(1):12-37. [ Links ]
REISENZEIN R. 1986. A structural equation analysis of Weiner's attribution-affect model of helping behaviour. Journal of Personality and Social Psychology, 50(6):1123-1133. [ Links ]
TAYLOR S. 1994. Waiting for service: the relationship between delays and evaluation of service. Journal of Marketing, April, 58(2):56-70. [ Links ]
WEINER B. 1980. A cognitive (attributional)-emotional-action model of motivated behaviour: an analysis of judgements of help-giving. Journal of Personality and Social Psychology, 39:186-200. [ Links ]

