


Serviços Personalizados
Artigo
 Inglês (pdf)
 Artigo em XML
 Referências do artigo
Indicadores

Links relacionados
-
 Citado por Google
 -
 Similares em Google
Compartilhar

 Permalink
Journal of Contemporary Management
versão On-line ISSN 1815-7440
JCMAN vol.5 no.1 Meyerton 2008
RESEARCH ARTICLES
Assessment of construction vehicle utilisation efficiency: a case study
WM ShakantuI; PA BowenI; M MuyaII; JE TookeyIII
IDepartment of Construction Economics and Management, University of Cape Town
IIDepartment of Civil and Environmental Engineering, University of Zambia
IIISchool of the Built and Natural Environment, Glasgow Caledonian University
ABSTRACT
Construction operations utilize large quantities of materials and generate significant levels of waste. Moving these quantities of materials and waste requires significant loaded vehicle transits annually. Given the cost/volume ratio of transport, logistics should be given a pre-eminent role in construction. However, little research has been conducted to ascertain the logistics processes in the construction industry. Notwithstanding the pivotal role transportation has within construction, this element of logistics has rarely been addressed and is little understood within the industry. The purpose of this paper is to document the results of a study investigating the utilisation efficiency of vehicles used in the transportation of building materials and construction and demolition (C&D) waste. A field study was conducted on seven (7) sites in Cape Town to establish the dynamics of construction materials and C&D waste transportation in order to deliver a set of criteria for the assessment of vehicle utilisation efficiency. The key finding from the field study is that vehicle utilisation at only 50% is sub-optimal.
Key phrases: Construction logistics, C&D waste, materials delivery, vehicle utilisation efficiency
1 INTRODUCTION
Construction is fundamentally a manufacturing operation utilizing materials with generally a low cost/high volume ratio. These materials need to be moved to geographically different points of production each time. Consequently, it seems necessary that the logistics function should be of strategic importance in construction (Holweg et al 2005; Lehtonen et al 2005). Given the risk-averseness of modern construction, effective planning and forethought are essential preconditions to successful execution of projects (Kaipia et al 2006). Construction planners need to take into account all the factors related to the production processes of construction projects (Gimenez 2006). It follows, therefore, that construction planners ought to plan materials movements to sites, information distribution and management and all related logistical activities (Briscoe et al 2001 ; Vrijhoef & Koskela 2000; Voordijk et al 2000; Edum-Fotwe et al 2000; Agapiou et al 1998, 1997).
Materials and components used in construction are generally of low cost and high volume in comparison to those of many other industries. This results in a situation where even relatively modest levels of construction need substantial transportation requirements. Thus, construction traffic is likely to account for a significant proportion of all goods vehicle transits in any urban area. Therefore, ordering processes, delivery schedules and vehicle movements in the construction context need to be understood (Auramo et al 2005). Not only does construction consume large quantities of materials, it also generates large quantities of waste (van Wyk 2004; DETR 2000). The reasons for such high waste are many and varied as discussed in Skoyles and Skoyles (1987) and Fellows et al (2002). These vast quantities of materials and waste require a large number of goods vehicle transits in moving them. Ultimately, the industry transports large quantities of components and assemblies into and waste out to cities points of recycling use, re-use, reclamation and disposal.
To meet sustainability requirements, the construction industry needs to address the problem of transporting large amounts of materials and waste to and from cities while mitigating environmental damage in the process. Ideally, efficient use of transport could alleviate or at least reduce this problem (Butner et al 2005). To achieve efficiency, it is necessary to understand and institute efficient vehicle utilization strategies.
Transport requirements may be accomplished through an own private fleet, contracts with transport specialists or common carriage based on individual shipments. There are three factors that are fundamental to transport performance. These are cost, speed and consistency (Vogt et al 2002; Rushton et al 2001).
Cost is the payment for movement between two geographical areas. Therefore, utility in transportation is related to cost of the service. Best utility is obtained when transportation minimizes total logistical system costs while maximizing on-time-in- full (OTIF) delivery of materials when and where required (Cronje et al 2004). Speed is the time required to complete a specific movement of materials from source to the point of need. Because of its relationship to cost, the most desirable method of transportation should be one that balances speed and cost of service (Dornier et a, 1998). The primary key performance indicator (KPI) with regard to transportation logistics would, therefore, be a measurement of OTIF in supplies. In the construction context, this idea is barely known and has not been reported upon in construction literature.
Consistency refers to variations in the time required to perform a specific movement over a number of shipments. Transportation consistency affects both the seller and the buyer's overall inventory commitment and related risks. Speed and consistency combine to create the quality aspect of transportation (Coyle et al 2003; Bowersox et al 2002).
2 VEHICLE SELECTION
Vehicular transport resources play a major role in any construction activity. Decisions regarding vehicle types and their combinations can have an impact on profitability of a construction project. In this respect, the selection of a combination of vehicles types that yields maximum production at minimum cost is necessary.
When selecting vehicles, a number of factors have to be taken into account. These are type of operation, restrictions at the point of loading and load characteristics (Rushton et al 2001).
In construction, goods vehicles are required to undertake a wide variety of jobs. For each of these different jobs, it is important that the most appropriate type of vehicle is chosen. If trucks are for general material hauling, they should be selected on the strength of their adaptability to the purposes for which they will be used. Moreover, they should fit the requirements of the operation. The specific construction operation is the primary factor in the selection of the vehicle to get the job done. These factors are: the physical work to be performed in the operation; and the availability of working space (Peurifoy et al 1996; Russell 1985; Day 1973). The selection of suitable haulers for a given material-moving operation depends on a complete job analysis. Work cycles are an important means of determining this. For a given material-moving operation, the cycle includes loading, hauling, dumping, returning and spotting for the next load (Peurifoy et al 1996).
2.1 Method of loading
There are several methods and aids available for loading construction freight. These include forklift, manual, loader shovels, excavators, overhead gantry and the use of saddle carriers.
Brick manufacturers normally use self-loading vehicles with cranes mounted on the chassis or on a detachable mounting. Large quarry trucks are frequently loaded by loader shovels while wagons are usually loaded by excavators. Hand-loading may be made easier by using a low truck and body. Detachable bodies or containers e.g. roll-on multi-buckets, can be left on the ground for loading and lifted on to the truck by a hydraulic or mechanical hoist (Rushton et al 2001).
Vehicles of articulated type combinations are needed for trucking operations carrying heavy loads. For loads with a low weight but high volume draw-bar combinations are favoured as they provide a high cubic capacity for loading. Articulated semi trailers may be used for vehicles falling between the above two extremes. Rear dump trucks should be used to haul material which flows easily such as sand, gravel, dry earth or coal. This would reduce time required to unload the material (Rushton et al 2001).
Some jobs require a vehicle with a powerful engine while others just require a good clutch and gearbox because of high usage. Middle distance runs require powerful engines. Work requiring lorries to travel short distances in a day, for example, local van deliveries, may make a large number of deliveries in a day and tend to have constraints on vehicle size. These factors: size constraints; short distances; stop and start conditions; and city traffic are the main factors to be taken into consideration when selecting vehicles for this type operation (Nunnally 1993; Harris 1989; Davies 1978; Nichols 1976).
Consequently, the main type of vehicle used is a rigid one with good gearbox and clutch mechanism. Increasingly, urban articulated combinations are used as they offer a huge payload potential while being more manoeuvrable than some rigid vehicles. Moreover articulated combinations are not prone to overloading of the front axle in a diminishing load situation (Rushton et al 2001).
2.2 Restrictions at the point of delivery or loading
One of the important factors to be considered when selecting vehicles is the access and exit restrictions at the point of loading and point of delivery in terms of height, width and weight. Other restrictions can occur between the point of delivery or loading. These include narrow roads, low bridges, weight restrictions, night time restrictions, lack of material handling equipment and low building access (Rushton et al 2001; Peurifoy et al 1996; Russell 1985).
Weight restrictions are a result of controls based on safe operation of construction vehicles. These include truck weight restrictions, dimension requirements such as length and height of trucks, forward distance and rear overhang, projecting loads, front overhang, and rules for over-dimension vehicles, lighting during the day and lighting during the hours of darkness.
Access restrictions pertain to the existence of access between the offloading area and the fixing area as this will play a big part in assessing the chain of materials handling events. Other significant issues relate to the effect of obstructions below or above the site. These include: what the access to the site is like; whether heavy plant can get to the site without damage to local roads; height or load restrictions of bridges; overhead power lines and telephone cables; and ground level obstructions.
In addition, the restrictions include, how much room there is between the new construction and the site boundary, and factors relating to off-loading including one way traffic systems (Nunnally 1993).
Another issue relating to access restrictions is access for handling equipment to part of or all of the new building. Important considerations, in this instance, are width or weight restrictions on existing roads, whether vehicles can be parked in the street for offloading or if provision can be made on site for delivery vehicle parking.
2.3 Load type characteristics
The particular load to be carried is another factor when choosing a vehicle. It is essential to consider the alternatives available regarding best chassis and best body suitable for the particular load. The principle load features are:
• light loads are high space users of vehicles in relation to weight of goods being carried. This is known as a high cube factor. The motive unit of a vehicle frequently carrying such products need not be powerful. A large rigid vehicle with a draw bar trailer is sufficient; and
• for very heavy loads, the choice of vehicles is problematic because of gross vehicle weight restrictions. However, vehicles specifically designed to carry very heavy loads are available.
The type of load also plays an important role in vehicle selection. The product and its weight, size, packaging, value, whether it can be easily handled or not, and susceptibility to damage all combine to influence the choice of type of vehicle and loading required. The physical characteristics of a material largely determine how easy or difficult it is to move it. Materials that can be loaded easily without special equipment or attachments are said to have a high degree of loadability (Russell 1985; Day 1973).
Large trucks are used for quarrying operations and movement of large volumes of earth. For transporting building materials, conventional trucks, i.e. from one (1) to 40 tonnes, are most appropriate. The bodies of trucks that used to haul wet clay should be free of sharp angles and corners. Dry sand and gravel will flow easily from almost any shape of body. Quarry rock should be hauled in bodies with sloping sideboards (Harris 1989; Nichols 1976).
2.4 Terrain to be covered
In addition to the above characteristics, the choice of vehicle should also take into consideration the terrain on which the vehicle will operate. Different engine capacities are required for hilly and flat areas. Also different body types are required for bumpy and smooth terrain. Four-wheel drive capability is usually required for difficult ground conditions. Three axle wagons are used on clays and fine soils where it is necessary to limit the ground-bearing pressure (Harris 1989).
Road Traffic Acts control the width and maximum axle loads of vehicles that may travel on public roads. As a result, there are generally two main types of vehicles, on and off-road vehicles. Off-road vehicles do not have similar controls as on-road vehicles and generally have a greater capacity than on-road vehicles.
Highway trucks should not be used constantly in rough or soft pits or on poorly maintained haul roads or on exclusively steep grade or under big shovels loading course rock. Trucks should be filled to the maximum capacity possible depending on their capability, the condition of haul roads and the severity of road grades (Harris 1989; Nichols 1976; Day 1973).
3 VEHICLE ECONOMY
In order to analyse the economics of a vehicle, it is essential to consider operational costs such as fuel consumption and tyre wear, whole life costs, residual values and ease of maintenance which influence operational costs. Economic feasibility should be based on the rates of established trucking companies and should include driver costs (DETR 1999; Harris 1989).
For the most efficient hauling operation, the size and number of trucks should be balanced with the workload of loaders, for instance, excavators. In a smoothly run haul cycle, the size and number of trucks should be planned so that the loaders are kept as uniformly busy as practicable. It is necessary to use the most efficient excavation methods and use enough truck or haul units so that the loaders are excavators are always busy. Trucks must be operated at the highest possible safe speeds. However, it is uneconomic to use very large dump trucks unless large volumes of earth are to be moved.
Economy is also concerned with the prices and costs of different types of vehicle. The main points to be considered include fixed cost of the vehicle, residual value, whole life costs, utilization factors and ways of acquiring a vehicle, which involve either buying or hiring.
4 DESIGNS AND TYPES OF CONSTRUCTION VEHICLES
The design of construction vehicles has closely followed developments in the equipment industry such as diesel engines and subsequent power shift gears and torque converters. Developments in hydraulics have improved the functional capability of vehicles. The rate of development and diversification of machines is steadily increasing and the techniques of efficient use become more complicated as time goes by (Rushton et al 2001).
4.1 Designs of construction vehicles
Largely, vehicle design is a response to demands of a particular construction job or a combination of jobs. Vehicles are usually identified by the functional category in which they fall. There are three basic divisions, linear, two dimensional and three dimensional types. Two dimensional vehicles form the basis of construction transport. These include ready-mix concrete trucks, general-purpose transport such as light and heavy lorries, tractors and trailers, and dumpers. For the purpose of transporting materials, there is a wide choice of vehicle designs available. Most are used for transporting building materials on public highways. These include conventional trucks, rigid 2-axle, rigid 3-axle and rigid articulated semi trailers. The main vehicle configurations are articulated tractor and trailer, draw-bar combinations and small goods vehicles The main body types are curtain sided, platform, skeletal suitable for carrying containers, demountable and swap bodies, van bodies, tankers, tipping bodies, road-railers suitable for transfer to rail wagons and bulk carriers (Rushton et al 2001).
5 MEASURING PERFORMANCE INDICATORS
According to Harrison and van Hoek (2002) and McKinnon (1996), over 50% of all goods vehicles travelling on British roads are empty. While consuming 12% of all industrial energy consumption in the UK, construction traffic contributes to an ever-increasing impact of road congestion, which causes delays, reduces efficiency and increases fleet operating costs. To optimise route and vehicle utility, operators should aim for improved fleet utilization through 24 hour scheduling and development of more complex trips (McKinnon & Ge 2006). Key performance indicators such as vehicle fill, empty running, time utilization, deviations from route and fuel consumption can assist logistics operators benchmark their operations (Nilsson 2006). Supply chain optimisation tools such as integration of logistics functions, route and vehicle optimisation and reverse logistics have proved to be effective tools that can improve vehicle utility (Yao 2005).
However, currently, the nature and scope of the logistics of construction materials and demolition waste is not well researched. Hence, the dynamics of the relationship between waste and materials are not well understood. Consequently vehicle utilisation efficiencies are not known. The purpose of this paper, therefore, is to assess vehicle utilisation efficiency in construction. The assessment used a case study methodology conducted on seven (7) construction sites in Cape Town between July and November, 2005.
6 THE CASE STUDY
6.1 Site description
A sample of seven (7) sites that would provide sufficient vehicle movements for analysis within a reasonable time period was identified. The selected sites were logistically, rather than statistically significant in the population. The primary selection criteria were: physical size of the development; and construction technology applied. The sites were selected were high rise, reinforced concrete frame mixed use though predominantly residential developments. These sites represented about 80% of all such developments in the Cape Town metropolitan area.
6.2 Method
A two phase pilot study was conducted during the observation period. The first phase was an exploratory study conducted on a large construction site in the Cape Town Central Business District. The main purpose of the first phase was to identify the types and classifications of vehicles and the pattern of their movements. The results obtained were used in the design of a data collection template. In the second phase, the template was pre-tested on another large construction project in the Milnerton area of Cape Town to determine the practicality of using the instrument. During the second phase, visual identification of vehicle fill was adopted. Depending on the body type, fill was measured by deducting the area of the body length and height that was not taken up by the material being moved. The observation protocol adopted was full, ¾ full, ½ full, ¼ full and empty. The quarter scale system was more appropriate as it was easy for the researchers to obtain a higher and consistent accuracy.
The vehicle loading parameters that were established during the pilot studies were summarised as follows:
• classification of vehicle (material delivery/waste removal);
• number of vehicle movements delivering building materials:
• number of vehicle movements for C&D waste removal;
• loading level of vehicle on arrival by volume (Full/¾/½/¼/ empty); and
• loading level of vehicle on departure (Full/¾/½/¼// empty).
In order to assess vehicle utilisation efficiency, data on the volumetric loading of the vehicles on arrival and departure was collected.
6.3 Results
6.3.1Vehicle transits to and from construction sites in Cape Town
Construction vehicle transits occur for a variety of reasons. However, the main ones, at least in logistical terms, and more importantly for this paper, include materials delivery and waste removal. There are various classifications and types of vehicles associated with these transits.
6.3.2Vehicle classifications
The vast majority of construction vehicles that transited the sites observed were for materials delivery. There was also a significant number of movements made by waste removal and 'non specific' vehicles. 'Non specific' vehicles were vehicles that were neither delivering material nor removing waste and were not even classified as staff transport or plant and maintenance vehicles but nevertheless came to the sites. Some of these vehicles belonged to consultants or clients or clients' representatives and were conducting some form of work at sites for a short time, for example, attending a site meeting. Three (3) percent of the total movements were of staff transport and 0.3% were of plant and maintenance vehicles. Figure 1 illustrates the findings.
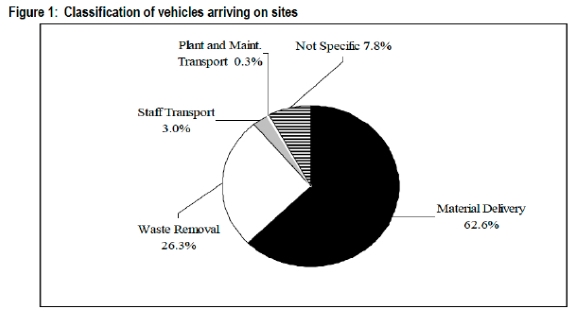
Figure 1 provides important evidence of the fact that almost 89% of the vehicles that went to sites were either delivering material or going to collect waste. Equally important is the fact that almost 10% of the these vehicle movements did not occur for purposes of delivering material or collecting waste but rather for other business related to site management in the case of staff transport or to assist with maintenance and repair or refuelling of site plant and equipment.
The configurations of vehicles that passed through the sites varied. However, there was a preponderance of six types of vehicles. As illustrated in Figure 2 the types of vehicles that went to sites were open, closed, tippers, skips, ready-mix and dump trucks of various tonnages and cubic capacities. Within these vehicle types, there was a total of 91 different tonnage and cubic configurations that were observed.
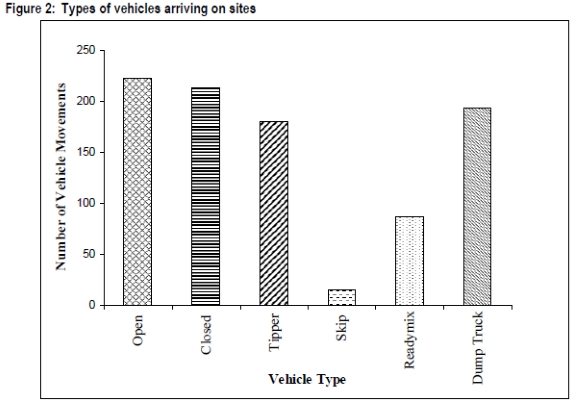
From Figure 2, it is clear that in terms of the number of vehicle movements, there were almost equal proportions of open, closed and tipper type vehicles that went to site. The number of ready-mix vehicle movements was quite low because four out of the seven sites that were observed had their own concrete batching and mixing plant on site.
In addition, Figure 2 shows that there was a significant presence of dump trucks. The large number of dump trucks was a result of the fact that on three of the seven sites studied, there were substantial earth and rock excavation operations. This resulted in large volumes of earth and rock-product which needed to be moved around and off the sites. The preponderance of tippers is explained by the fact that concrete batching and mixing plant on four of the field study sites needed constant supplies of building and river sand, ballast and concrete stone aggregates. Tippers seemed to be the preferred mode of delivering these concrete constituents.
6.3.3 Volumetric loading levels of vehicles on arrival and departure
Data on the volumetric loading levels of the vehicles on arrival and departure was collected. Figure 3 shows that 42% of vehicles arrived on sites empty and 36% fully loaded. This finding illustrated in Figure 3 is significant for two reasons.
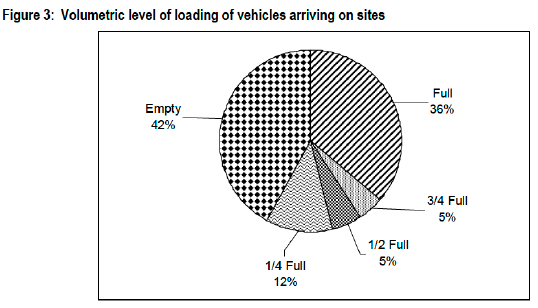
Firstly, it generates for the first time in literature a ratio of the level of loading of vehicles going to sites. The ratio of 42%:36% approximates to 1.2 fully loaded vehicles to one (1) empty vehicle.
Secondly Figure 3 supports the observation by McKinnon (1996) in literature that there is a significant number of empty runs on public roads.
In Figure 4 there was a total of 59% and 29% of vehicle movements which left sites empty and full respectively. Figure 4 demonstrates a ratio of 59%;29% or two to one between empty and full returns. It means that for each fully loaded vehicle movement from site there were a corresponding two vehicle movements which left empty.
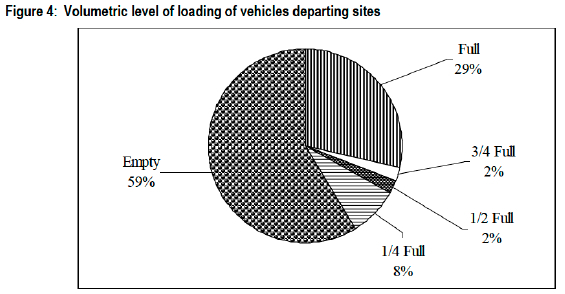
Figure 5 demonstrates the levels of material delivery and C&D waste removal vehicle loadings on arrival. The figure shows that most materials delivery and C&D waste removal vehicles travelled to construction sites fully loaded and empty respectively.
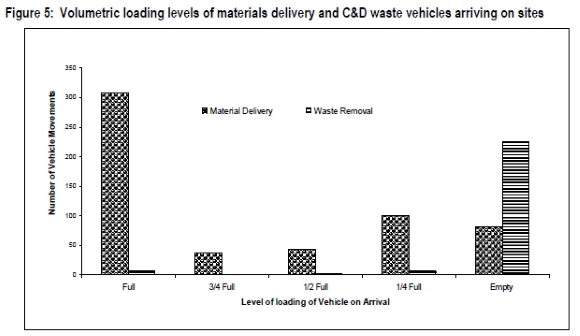
Figure 5 also shows that in addition to the preponderance of delivery vehicles arriving full, there was also a small proportion of ¾, ½ and ¼ full loaded vehicles. This would indicate that these vehicles were either under-loaded at source or arrived at sites after dropping off some of their loads at other sites or depots.
Figure 6 shows volumetric loading of both materials and C&D waste removal vehicles on departure. In Figures 5 and 6 a relationship between level of loading of material delivery vehicles on arrival and on departure became clearly manifested. It can be argued from this relationship that in large part the materials delivery vehicles that came fully loaded left sites empty. This was the case because construction materials delivery vehicles did not take out waste to points of recycling or reclamation.
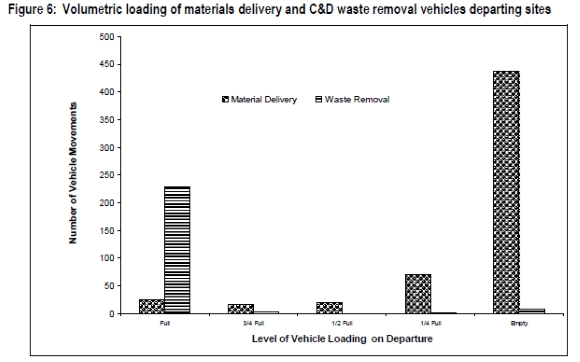
Figure 7 presents the average turnaround times of vehicles that travelled to sites. Closed vehicles seemed to stay longer on sites while dump trucks stayed the shortest time. This can be explained by the nature of the delivery or reason why a particular vehicle had travelled to a site.
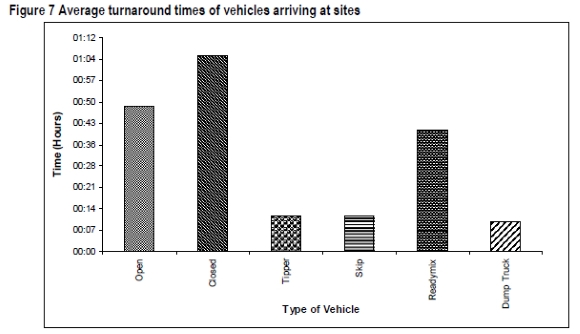
In the case of dump trucks, they were normally utilised for removal of excavated earth or stone or a mixture of both - generally any form of excavated material. Because the excavation was performed by excavators with 1 to 1% m3 capacity shovels, these excavators can load a 10m3 payload capacity dump truck in about 1 to 2 minutes. As a result, the turnaround time of dump trucks was at a minimum level.
Closed vehicles were in the main comprised of 1 tonne "bakkies". These are the type of vehicle site management, visiting engineers, subcontractors and other non specific type of vehicle site visitors came in. As a result of their 9 AM to 5 PM type of job, the drivers of 'bakkies' tended to stay on site long. The turnaround time for such vehicles was rather long - several hours. However, the "bakkies" were not the only type of closed vehicle that transited sites. There were other large cubic capacity vehicles that were closed van type. These stayed a relatively shorter time on site. But on average, average turnaround time for all closed vehicles, for the seven sites, seemed long because of the preponderance of 'bakkies'.
Figure 7 also shows that the dump trucks and skips stayed for a much shorter time on site than the ready mix, open and closed vehicles. This confirms the ease of offloading loose soil or stone based materials.
Figure 8 shows that materials delivery vehicles tended to stay longer on sites than did their waste removal counterparts. This confirmed the fact that ready-mix vehicles, because of the nature of their cargo discharging activity which tends to be controlled by crane skip sizes and crane operations tended to stay very long on sites.
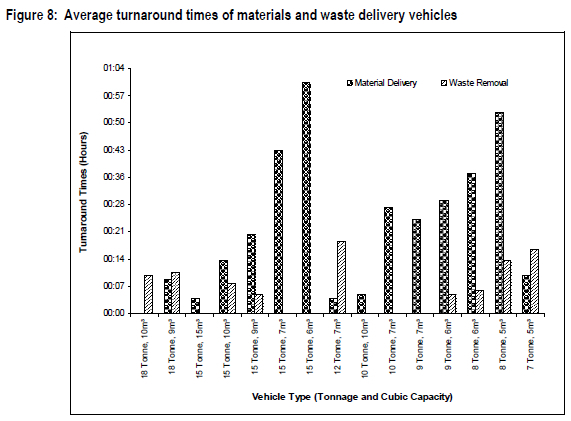
Another issue that came out of the analysis of average turnaround time was that on average, delivery vehicles, that is, open, closed, tippers and ready-mix took approximately 30 minutes to offload before they left.
6.3.4 Vehicle utilisation efficiency
The formula used to establish utilisation efficiency is given by:
UE = ½ [(ADf/PDf )+(ADr/PDr)] x 100, where:
• UE is the Utilisation Efficiency
• ADf is for Actual Delivery on the forward journey;
• PDf is for Potential Delivery on the forward journey;
• ADr is for Actual Delivery on the return journey; and
• PDr is for Potential Delivery on the return journey.
Where delivery is measured by proportion of truck loading i.e. Full/¾½¼/Empty; and Potential Delivery is taken to be 100% or 1.
Figures 9 and 10 show the levels of loading of materials and C&D waste vehicles on arrival and departure.
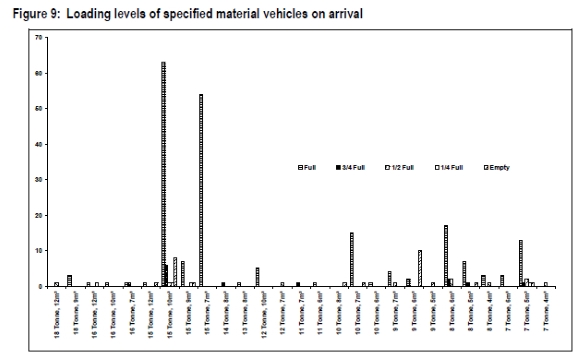
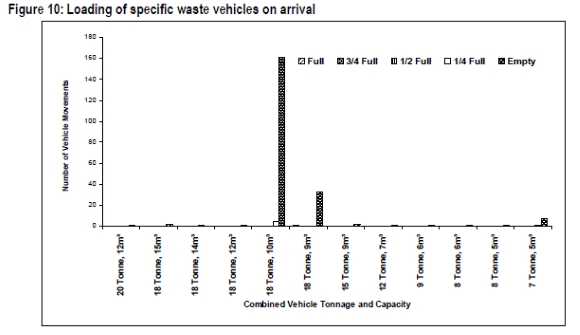
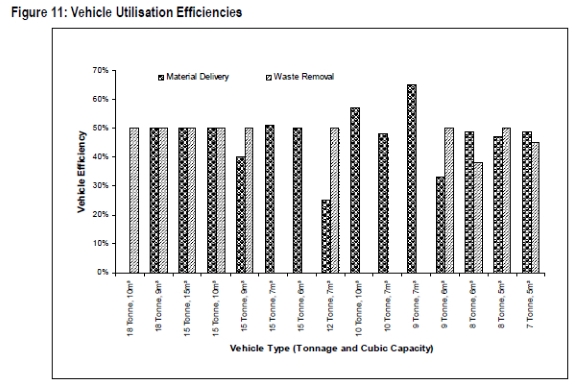
Figure 10 provides loading efficiencies calculated using the vehicle efficiency formula given above. The loading efficiencies for materials delivery vehicles in the range of 7 tonne - 5m3 to 18 tonne - 10m3 configurations were around 50% level or below. The highest loading efficiency was 65% (9 tonne 7m3) and the lowest was 33% for the 12 tonne 7m3 and 9 tonne 6m3 vehicles respectively. From the vehicle loading efficiencies obtained, it can be deduced that the vehicles are under-utilised in terms of loadings versus their maximum capacity. Essentially, the utilisation efficiency supports the need to improve construction logistics through integration of materials delivery and waste removal and load consolidation with other vendors.
7 DISCUSSION OF FINDINGS
7.1 Turnaround times for delivery vehicles
The turnaround times of the vehicles indicate that largely, the vehicles stayed long on sites. This in turn meant that the efficiency of utilisation was low as there was considerable idle time. While the average turnaround times for all delivery vehicle movements was found to be 30 minutes, the highest turnaround times, that was, of closed vehicles was 60 minutes and that of open vehicles was 49 minutes as shown in Figure 8. The turnaround time for ready-mix vehicles was 41 minutes, which was relatively long.
The turnaround time for the ready-mix was long because such vehicles were at the mercy of site off-loading equipment. The process in some instances was quickened by discharging directly into concrete pump buckets. On average the 41 minutes turnaround time for ready-mix vehicles was rather long. Considering that some of the ready-mix vehicles were operated by owner drivers, such long turnaround times would impact on their ability to increase their number of daily runs and hence their profitability. Similarly, in terms of vehicle efficiency, in addition to the fact that ready-mix vehicles are dedicated single use material delivery vehicles their utilization was sub-optimal.
7.2 Prevalence of empty runs
Analysis of the level of loading of all vehicles on arrival on site revealed that only 42% arrived at sites fully loaded. A total of 36% of all vehicle movements arriving at sites were empty. Of the empty runs, material delivery vehicles accounted for 25%. Concerning the total number of vehicle movements departing the sites empty, materials delivery vehicle movements accounted for 82%. Looking specifically at the movements of all materials delivery vehicles, a total of 14% arrived empty and 77% departed empty.
In logistical terms the empty runs are an unsustainable utilization of resources. The empty journey still utilizes fuel and contributes to wear and tear of the vehicles concerned. In addition these vehicles still generate air pollutants which affect the quality of life of people and buildings. In efficiency terms, vehicles running empty in one direction operate at 50% loading efficiency. But those vehicle movements running empty on both journeys are actually operating at 0% loading efficiency.
Therefore in loading terms the logistics of construction materials in Cape Town, focusing on construction vehicle movements relating to the delivery of construction materials to sites were sub-optimal.
7.3 Failure to back-load
The logistics of materials delivery vehicle movements revealed an intriguing observation on site related to the inability to 'back-load'. 'Back-loads' may be an unfamiliar feature amongst construction suppliers. However, even contractors' vehicles also failed to back-load. Logistically, it would seem logical for a contractor to want to use their delivery vehicle to collect any unwanted items on site or at least move items from one site to another. However, this was not the case even in instances where the same contractor was running adjacent sites. A case in point was of a contractor running three sites within 100 metres of each other at the Cape Town Waterfront. The researchers were able to monitor vehicle movements arriving at and departing the three sites from one observation point.
In this particular case, a contractor's materials delivery vehicle arrived at, say site A, off-loaded some 'boxed' materials and then left empty. Soon after, another vehicle belonging to the same contractor arrived at the next site B and in like manner also off-loaded some 'boxed' materials and then left empty. Later, a roll-on 'skip' vehicle from a waste management company belonging to the same contractor arrived at the third site to collect waste. In all three cases, the vehicles moved as though they did not belong to the same contractor. It appeared that the fragmentation in the industry goes to the level of even adjacent sites run by the same contractor! A logical logistics oriented approach to the above situation would have been for the contractor to consolidate the two deliveries made to the two sites and perhaps even use the return journey of the delivery vehicle to collect waste from the third site.
The scenario above also depicts failure of the construction industry to synchronise deliveries to adjacent sites and benefit from reduced service costs brought about by such synchronization. This is in contrast to the situation obtaining in the retail, grocery and other industries where suppliers synchronise deliveries to customers in close proximity as literature indicates. Synchronisation is done by consolidating orders and using vehicles of the right size. The lack of synchronization problem in construction may be a result of either the types of vehicles used or lack of logistics management training and education in the South African construction industry. In terms of vehicle utilization and loading efficiency, failure to back-load results in only achieving 50% efficiency. Fifty (50) percent was sub-optimal loading and vehicle utilisation performance.
7.4 Materials delivery vehicle efficiency
The loading efficiency for vehicles in the 7 tonne 5m3 to 18 tonne 10m3 vehicle configuration ranges were found to be around 50% or below, reflecting low vehicle utilisation. The highest loading efficiency was 65% for the 9 tonne 7m3 and the lowest was 33% for the 12 tonne 7m3 and 9 tonne 6m3 vehicles respectively.
On analysis of the field study results, a ratio of materials deliveries to waste removal vehicles of 2.4:1 was established. The ratio implied that the total output of the construction sector, in terms of its use of transport, could be increased by a third without having to increase the total number of vehicles on the road.
The ratio of 2.4:1 also meant that the benchmark, for construction materials delivery and waste removal was that:
• at least 42% of all construction materials leaving construction sites should be fully loaded with waste; and
• on average 100% of all materials delivery vehicles should be loaded up to 42% of their payload capacity with construction waste on their return journey.
These findings provide a consistent basis for measuring efficiency of vehicle utilisation in terms of building materials delivery and C&D vehicle movement for waste removal.
8 CONCLUSIONS
Currently, many firms in the South African construction industry do not address the logistics element of their operations. This position is inconsistent with that widely cited in literature that logistics is a pre-eminent subset of SCM. Consequently, research highlighting the importance of logistics in construction needed to be done. The preliminary findings were that transportation costs represent approximately 39% to 58% of logistics costs. It would seem apparent that focusing on the reduction of the transportation cost element of materials offers significant opportunity to increase cost effectiveness in construction. It was therefore essential to analyse the logistics of construction materials delivery and waste removal in order to establish what potential improvements could be made.
The findings from analysis of the seven (7) sites revealed that there was a high prevalence of empty vehicle movements both to and from construction sites. On the forward journey, most of the empty runs were made by C&D waste removal vehicles which are traditionally single-use vehicles and therefore normally do not carry cargo on their forward journey. On the return journey, most of the empty runs were of materials delivery vehicles which were often returning to their depots after off-loading their cargo on sites.
Further analysis showed that the consequences of such high numbers of empty runs was that materials delivery and C&D waste removal vehicle loadings and utilisation efficiency levels were approximately 50% only. Fifty (50) percent efficiency is a very low level of vehicle utilisation and it is important to find ways and techniques for improving the status quo.
REFERENCES
AGAPIOU A., FLANAGAN R., NORMAN G. & NOTMAN D. 1997. The changing role of builder's merchants in the construction supply chain. Construction Management and Economics, 16:351-361. [ Links ]
AGAPIOU A., FLANAGAN R., NORMAN G. & NOTMAN D. 1998. The role of logistics in the materials flow process. Construction Management and Economics, 16:131-137. [ Links ]
AURAMO J., KAUREMAA J. & AND TANSKANEN K. 2005. Benefits of IT in supply chain management - an explorative study of progressive companies. International Journal of Physical Distribution and Logistics Management, 35(2):82-100. [ Links ]
BOWERSOX D.J., CLOSS D.J. & COOPER M.B. 2002. Supply Chain Logistics Management. McGraw-Hill/Irwin. [ Links ]
BRISCOE G., DAINTY A.R.J. & MILLETT S. 2001. Construction supply chain partnerships: Skills, knowledge and attitudinal requirements. European Journal of Purchasing and Supply Management, 7:243-255. [ Links ]
BUTNER K., HUPPERT P. & FEARS G. 2005. The GMA logistics survey: Maintaining supply chain performance in food, grocery and consumer products. 1MB Business Consulting Services. [ Links ]
COYLE J.J., BARDI E.J. & LANGLEY C.J. JR. 2003. Management of Business Logistics: A Supply Chain Perspective, 7e. Thormson Learning, South Western. [ Links ]
CRONJE G.J., DU TOIT GS & MOTLALA M.D.C. 2004. Introduction to Business Management, 7e. Oxford University Press. [ Links ]
DAVIES W. 1978. Building Plant and Equipment Sheets. Northwood Publications Ltd. [ Links ]
DAY D. 1973. Construction Equipment Guide. Wiley Interscience. [ Links ]
DEPARTMENT OF ENVIRONMENT, TRANSPORT AND THE REGIONS (DETR) 1999. Transport and the Economy. HMSO. [ Links ]
DEPARTMENT OF ENVIRONMENT, TRANSPORT AND THE REGIONS (DETR) 2000. Building a Better Quality of Life: A strategy for more sustainable construction. HMSO. [ Links ]
DORNIER P., ERNST R., FENDER M. & KOUVELIS P. 1998. Global Operations and Logistics: Text and Cases. John Wiley & Sons. [ Links ]
EDUM-FOTWE F.T., KULULANGA G.K. & McCAFFER R. 2000. Application of organic learning styles to construction management. Journal of Construction Research, 1(1):53-58. [ Links ]
FELLOWS R., LANGFORD D., NEWCOMBE R. & URRY S. 2002. Construction Management in Practice. Construction Press. [ Links ]
GIMENEZ C. 2006. Logistics integration processes in the food industry. International Journal of Physical Distirbution and Logistics Management, 36(3):231-249. [ Links ]
HARRIS F. 1989. Modern Construction Equipment and Methods. Longman Scientific & Technical and John Wiley & Sons, Inc. [ Links ]
HARRISON A. & VAN HOEK R. 2002. Logistics Management and Strategy. Financial Times/Prentice Hall. Industry. CSIR (Boutek). [ Links ]
HOLWEG M., DISNEY S., HOLMSTROM J. & SMAROS J. 2005. Supply chain collaboration: Making sense of the strategy continuum. European Management Journal, 23(2):170-181. [ Links ]
KAIPIA R., KORHONE H. & HARTIALA H. 2006. Planning nervousness in a demand and supply network: an empirical study. Internationaljournal of Logistics Management, 17(1):95-113. [ Links ]
LEHTONEN J., SMAROS J. & HOLMSTROM J. 2005. The effect of demand visibility in product introductions. International Journal of Physical Distribution and Logistics Management, 35(2):101-115. [ Links ]
MCKINNON A.C. 1996. The empty running and return loading of road goods vehicles. Transport Logistics, 1(1):1-19. [ Links ]
MCKINNON A.C. & GE Y. 2006. The potential for reducing empty running by trucks: a retrospective analysis. International Journal of Physical Distribution and Logistics Management, 3(5):391- 410. [ Links ]
NICHOLS JR. H.H. 1976. Moving the Earth, 3e. North Castle. [ Links ]
NILSSON F. 2006. Logistics management in practice- towards theories of complex logistics. The International Journal of Logistics Management, 17(1):38-54. [ Links ]
NUNNALLY S.W. 1993. Construction Methods and Management, 3e. Prentice Hall, New Jersey. [ Links ]
PEURIFOY R.L., LEDBETTER W. & SCHNEXNAYDER C. 1996. Construction Planning, Equipment and Methods, 5e. McGraw-Hill International Book Company. [ Links ]
RUSHTON A.R., OXLEY J. & CROUCHER P. 2001. Handbook of Logistics and Distribution Management, 2e. Kogan Page. [ Links ]
RUSSELL E.J. 1985. Construction Equipment. Reston Publishing Company. [ Links ]
SKOYLES E.R. & SKOYLES J.R. 1987. Waste Prevention on Site. Mitchell. [ Links ]
VAN WYK L. 2004. A Review of the South African ConstructionIndustry. CSIR (Boutek). [ Links ]
VOGT J.J., PIENAAR W.J. & DE WITT P.W.C. 2002. Business Logistics Management. Oxford. [ Links ]
VOORDIJK H., DE HAAN J. & JOOSTEN G.J. 2000. Changing governance of supply chains in the building industry: a multiple case study. European Journal of Purchasing and Supply Management, 6(3-4):217-225. [ Links ]
VRIJHOEF R. & KOSKELA L. 2000. The four roles of supply chain management in construction. European Journal of Purchasing and Supply Management, 6(3-4):169-178. [ Links ]
YAO W. 2005. Logistics network structure and design for a closed-loop supply chain in e-commerce. International Journal of Business Performance Management, 7(4):370-380. [ Links ]

