


Services on Demand
Article
 English (pdf)
 Article in xml format
 Article references
Indicators

Related links
-
 Cited by Google
 -
 Similars in Google
Share

 Permalink
South African Journal of Higher Education
On-line version ISSN 1753-5913
S. Afr. J. High. Educ. vol.37 n.5 Stellenbosch Oct. 2023
http://dx.doi.org/10.20853/37-5-5397
GENERAL ARTICLES
Do assessment loads affect student academic success? An investigation at an Economics Department at the undergraduate level
D. YuI; C. SwanepoelII; D. SimsIII, IV; F. AncianoV
IUniversity of the Western Cape Cape Town, South Africa. Department of Economics. http://orcid.org/0000-0001-9813-7897
IIUniversity of the Western Cape Cape Town, South Africa. Department of Economics. https://orcid.org/0000-0003-0906-8995
IIILearning and Teaching Specialist, Faculty of Economic and Management Sciences, University of the Western Cape, and
IVResearch Associate, Biomedical Engineering and Healthcare Technology (BEAHT) Research Centre, Faculty of Health Sciences, University of Johannesburg, Johannesburg, South Africa. https://orcid.org/0000-0003-4973-0699
VUniversity of the Western Cape Cape Town, South Africa. Department of Political Studies. https://orcid.org/0000-0002-8613-1452
ABSTRACT
Assessments plays an important role in Higher Education as a cornerstone and driver of learning and teaching activities, curriculum development and renewal, achievement of learning objectives and student academic success, as well as the development of graduate attributes. Assessment load, however, in terms of over-assessment (along with under-assessment), is a blurred concept that is difficult to define qualitatively and measure quantitatively. To address this gap in research, based on a comprehensive literature review, we developed a multidimensional assessment index (MAI), with eight indicators, to measure over-assessment. These indicators include features of continuous assessment (total number, mark allocation or size, weighting, degree of difficulty, frequency and scheduling, type, content coverage and repetition) and the presence, or absence, of a single high-stakes final examination. We applied these indicators to a case study of an undergraduate Economics, consisting of 12 modules across 3 years of study, at a university in South Africa. The MAI was then compared with the pass rate, as a measure of student success, and there was a moderate and negative correlation between the MAI (high assessment loads) and pass rate variables. Lastly, the indicator with the strongest correlation with pass rate was the length of assessments (or proportion of continuous assessments with a high mark count). It is hoped that this study helps fill the gaps in existing literature on definition and measurement of assessment loads, and the practical use of the MAI as a tool to evaluate assessment load and inform the design of assessment for student learning and success.
Key words: assessment, higher education, assessment load, over-assessment, underassessment, student success
INTRODUCTION
Assessment is a central and critical practice in Higher Education, yet is poorly understood by academics (Medland 2018; Popham 2009). In the broader context of student learning and success, assessment as a tool for driving learning in desirable ways remains lacking. For assessment to drive student learning desirably, a variety of opportunities for students to demonstrate their competence, in different ways and contexts, needs to take place (Dreyer 2014, 13).
The challenge arises in the balancing of assessment; both students and staff could suffer work-related burnout if there are too many assessment opportunities; if there are too few assessments, one risks not having enough valid information for reliable decision-making regarding attainment of intended learning outcomes (see Table 1). However, defining or quantifying over-, or under-, assessment, and their impact on student learning and success, is unclear. For instance, the term "assessment overload" is complex and contested, and the solution to reducing assessment load is not as simple as it first seems (O'Neill 2019, 1).
When it comes to defining over-assessment, or even assessment load, no simple definition can be found. In South Africa, there are virtually no empirical studies investigating whether we over- or under-assess students. Internationally, there are a handful of empirical studies but none of them considered a wide range of indicators altogether relating to assessment loads. In light of the need for more empirical research on assessment, this study develops a working definition and quantifiable measure of over-assessment by proposing a multidimensional assessment index (MAI). The study first provides a literature review of existing studies on over-assessment; drawing from this review, we develop an eight-fold MAI to measure assessment loads. We apply this index to a case study of 12 economics modules in a university in South Africa. Using descriptive statistics our findings show that a higher MAI (and in turn high assessment loads) is associated with lower pass rate.
LITERATURE REVIEW
Defining over-assessment and under-assessment
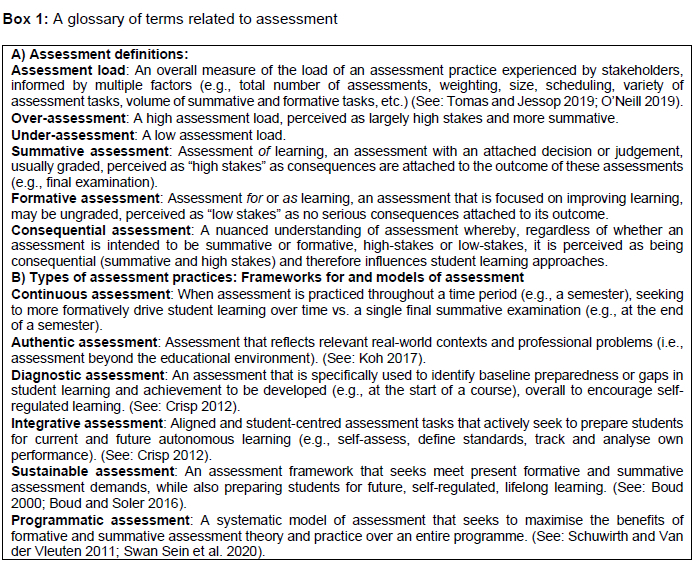
Assessment may be defined as the systematic process of gathering evidence of a student's developing competence - their knowledge, skills and attitudes. Assessment may serve many purposes: selection, direction, motivation and certification as summarised by Natriello (1987). More recently, a proliferation of terms such as summative, formative, continuous, diagnostic, authentic, sustainable, integrative and programmatic assessment have come into dominance (see Box 1 and Figure 1). Broadly speaking, summative assessment refers to assessment of learning, while formative assessment speaks to assessment for learning. The first is considered to be "high stakes", as a decision or judgement is tied to it, whereas the second is considered as a "low stakes" learning and improvement opportunity (Boud 1995). The practice of continuous assessment (CA) seeks to more continually, and formatively, assess students throughout a semester or year, as opposed to having a single, final examination at the end. Critically, however, students often perceive all assessments activities as consequential, or high stakes and summative, thereby missing the intended formative learning opportunities.
When it comes to defining over-assessment, simply counting the total number of assessments is insufficient. Price et al. (2011) note that having a lower number of assessments may imply more high-stakes assessments, which in turn has a negative impact on student learning, as students may perceive these assessments as more stressful and with fewer opportunities to recover from poor performance (i.e., "high stakes" assessments). Cilliers at al. (2012) describe a model of multiple interacting factors that impact on how students respond to assessments, indicating that the learning effects of assessment are not merely limited to the number of assessments. Galvez-Bravo (2016, 95) summarises the literature as such, "There is concern that a large number of assessments and/or repeated assessment of the same learning outcomes may be over-doing the time spent measuring performance and can lead to surface and partial learning, rather than focusing on deeper learning or a real attainment of knowledge and learning outcomes". Although there is no formal definition of over-assessment in quantitative terms, typically it implies a high assessment load, tipping the balance towards summative assessments, to the detriment of formative assessments (Thomas and Jessop 2019).
Pros and cons of high-assessment and low-assessment loads
There are a number of reported, and logical, positive and negative impacts of high- and low-assessment loads on key stakeholders; academics, students and administrative staff (Table 1).
From the student perspective, high assessment loads can lead to fatigue, less time for studying and completion of other assessments, and thus an increased likelihood of not attending classes and committing plagiarism due to assessment (over)load (Harland et al. 2015; Jonkman et al. 2006; Galvez-Bravo 2016). However, regular assessments help students build momentum for learning, studying and subsequently remain up-to-date with the required work and be better prepared for the final summative assessments (Jonkman et al. 2006; Trotter 2006). Conversely, low levels of assessment may lead to student ignorance in terms of their learning progress, and being under-prepared for final assessments.
From the academics' perspective, high assessment loads may also result in fatigue, a lack of time for providing sufficient quality feedback, and teaching preparation, due to time spent on marking. Yet, a positive of regular assessment is earlier identification of "at-risk" students with the possibility of timely support for student learning and success. On the other hand, a risk with under-assessment is that academics may be unaware of students' progress, or lack thereof, with less time to intervene.
An under-represented perspective is that of an administrator; from their perspective, high assessment loads add to their workload in terms of processing marks, which may in turn result in delays in mark and feedback release to students.
Review of past empirical studies
To the authors' knowledge, Cilliers et al. (2012) is the only local empirical study with some relevance to over-assessment. In the field of health sciences education, the authors interviewed students to explore how summative assessment shaped their learning behaviours. The demands of the assessment task and design of the assessment system influence how students respond to summative assessments. Task demands include the type of assessment, assessment criteria, nature of learning materials, availability of past papers, and assessment cues from lecturers and peers. System design speaks to the scheduling pattern of assessments, imminence of upcoming assessments and current workload of the students. For instance, while students may distribute their learning efforts based on how assessments are scheduled within and across courses, the volume and difficulty-level of learning materials also impacts on how students will respond to an assessment. How imminent an assessment is, along with how important, or severe, the potential consequences of the assessment are, further influence student action. This illustrates that the number of assessments is but a single factor in a more complex system.
A handful of international studies were identified in exploring over-assessment. Jonkman et al. (2006) surveyed and had focus groups with 85 undergraduate and postgraduate students from an Australian university to investigate students' perceived workload and assessment preferences. While most students perceived workload to be high, and a reason for student absence from class due to needing to complete assessments, workload did not correlate with the number of hours students spend studying. There was in fact a surprising negative correlation (-0.25) between the number of assessment items and total study hours. Similarly, the more difficult the students perceived an assessment, the less hours they spend studying for it than those who perceived the assessment as easier. However, a positive correlation (+0.37) between the number of credit points and study hours was reported. Students who spent many hours studying perceived workload to be high, but not the difficulty-level, which the authors report is due to these students feeling as though they have a solid understanding of the material.
It was interesting to note that there was a wide range of students' perceptions of the number of assessment items that are best suited to effective learning, some claiming as many as 30, whereas others said only one or two. Regarding examination preparation, 70 per cent of undergraduate students reported that previous assessments helped prepare them, with only 7 per cent requesting a decrease in the number of assessment items. This was not found with postgraduate students. Undergraduate students were in favour of a final examination accounting for 40-50 per cent of their final grade, with the remainder consisting of other assessments, which they found useful for learning and examination preparation. Postgraduate students who were accustomed to CA did not feel over-assessed; whereas students who were experienced in examination-only assessment practices, wished to place less of an emphasis on examinations. Postgraduate students also expressed frustration that the smaller assessments, and the accompanying workload, did not reflect in their final grade (Jonkman et al. 2006).
Different types of assessments were valued by different students: undergraduates preferred assignments and projects, as they tested their knowledge and skills, with orals as the most useful for real-world application; but postgraduates believed assignments, tutorials, larger projects and final examinations to be beneficial, and thought attendance should receive a grade. It is important to note though, that overall the students' ideal assessment practice did not differ significantly from their current assessment practices.
Trotter (2006) interviewed students at a UK university to investigate whether tutorial files satisfied the criteria for effective and efficient assessment, and whether the introduction of tutorial files (which consisted of answers to tutorial and workshop questions) improved students' learning environment. The empirical findings showed more regular tutorials acted as an external stimulus to motivate students to adopt a more continuous learning style, remaining up to date with their work, instead of leaving it until the end of the semester or final examination period. In particular, they felt more motivated and worked harder knowing that their work actually contributed to the final grade. However, 42 per cent of survey participants indicated tutorials took too long despite helping them to improve understanding of the subject and being a nice revision tool; thus, there were recommendations to shorten the tutorials. A benefit of having CA was that students welcomed and responded to regular and early feedback, contributing to learning and behaviour change. An overwhelming 94 per cent of students perceived their learning to improve as a result of CA, and 91 per cent found regular tutorials to be useful revision tools. Overall, Trotter (2006, 505) concludes that, "While continuous summative assessment may be time-consuming to administer, the rewards of an enhanced learning environment for students outweigh the additional burden on staff".
Jessop, El Hakim, and Gibbs (2014) conducted an audit on 23 programs in the UK with specific focus on nine aspects of assessment: number of summative assessments, number of formative assessments, variety of assessment methods, volume of oral feedback, volume of written feedback, timeliness of feedback, explicitness of goals, criteria and standard, and alignment of assessment with program learning outcomes. Numerous empirical findings are worth mentioning. First, the number of formative assessments was as low as zero but as high as 55. Secondly, there were indications from the statistical analysis on the data that higher number of formative assessments, that were not linked to summative assessments and final grade or feedback practices, were associated with lower student satisfaction with the course as well as less fostering of a deep learning approach amongst students. Thirdly, there was a strong positive statistical relationship between students' grasp of learning goals and standards and the quantity and quality of feedback, and overall student satisfaction. Regarding the number of assessments, there were no statistically significant correlations between the volume of summative or formative assessment and quantity of effort by students. Reflecting the earlier findings by Cilliers et al. (2012) the authors conclude, "The number of assessed tasks alone does not significantly influence student effort" (Jessop et al. 2014, 84). While great variation in assessment practices was found across programmes, a consistent finding was more summative than formative assessment items in all programmes, which speaks to the larger culture of assessment; it is not the number of the assessments that is critical in driving student learning so much as the nature of them.
Bree et al. (2014) interviewed undergraduate science students at a university in Ireland, with the aid of an online questionnaire and comparative focus groups, about their redesigned assessment programme, and four key empirical findings arose. First, it was strongly recommended to reduce the number of laboratory reports (preferably from 10 to four) as the students felt they were over-assessed. Secondly, an incremental marking system was suggested (i.e., assessments later in the semester count more towards the final mark), as students improve their understanding of the subject throughout the semester and perform better later on, especially after getting feedback. Thirdly, students emphasised the importance of receiving timely, detailed and personalised feedback as it was essential for the process of feed-forward improvement. Lastly, there were some suggestions of having more group laboratory exercises to improve interaction and opportunities for self-assessing their work prior to submission as further initiatives which help improve students' academic performance.
Harland et al. (2015) interviewed 46 students and 16 lecturing staff at a university in New Zealand to explore their experiences of assessment. Students in general preferred larger and more meaningful inquiry-type assessments (associated with deep learning) over smaller tests which were related to surface learning approaches. No students preferred having a single final examination, accounting for 100 per cent of their grade, or few large high-stakes assessments; but preferred smaller assessments more often. While students were generally happy to accumulate small marks, they felt irritated and stressed by regular assessments. Lecturers on the other hand preferred smaller assessment loads as high volume of grading work, an "assessment arms race", left little time left for formative feedback and slow scholarship; yet, were reluctant to reduce the overall number of assessments despite high marking loads.
Galvez-Bravo (2016) explored the relationship between student achievement and number of assessments across 56 modules at the School of Natural Sciences and Psychology of a UK university, with specific focus on testing the hypothesis that modules with fewer assessments are associated with higher mean marks. The correlation analysis indicated a positive but statistically insignificant relationship existed between mean marks per module and total number of assessments. Moreover, modules with more assessments were associated with higher student feedback or appraisal marks, but this positive relationship was also statistically insignificant. To conclude, decreasing the number of assessments did not necessarily lead to better student performance and greater student satisfaction.
Two recent studies adopted the TESTA methodology (the detailed discussion of the TESTA approach falls beyond the scope of this study, but can be referred to Jessop et al. (2014)). First, Jessop and Tomas (2017) investigated assessment patterns across 73 programs in 14 UK universities by focusing five indicators, namely number of formative assessments, number of summative assessments, variety of assessments, proportion of tasks by examination and amount of feedback. The empirical findings indicate a wide range of assessment practice across programs; for example, the number of summative assessments ranged between 12 and 227, number of formative assessments was as low as zero but as high as 116, the variety of assessment methods used between 5 and 19, and the volume of oral feedback ranged from 40 to 1 800 minutes, and written feedback to students ranged between 950 and 22 000 words.
Tomas and Jessop (2019) used the same data, but rather focused on using the above-mentioned first four indicators to compare assessment loads across teaching- and research-intensive universities. The authors found that while formative assessment load was not significantly different between the two groups of universities, summative assessment load was significantly lower at teaching-intensive universities. Moreover, the percentage of marks obtained from examinations was significantly higher at research-intensive institutions, whereas the variety of assessment methods was greater at teaching-intensive institutions.
To conclude, there is a serious lack of local and international studies on over-assessment, with very few studies that take a wide range of indicators together into consideration to examine the extent of over- or under-assessment. Moreover, there is a lack of consensus on defining and measuring over-assessment, nor empirical evidence on the effects of assessment loads on student learning and success. To date, no study has considered a range of indicators collectively (i.e., a multidimensional index) to examine assessment load. Therefore, our study aims to fill this significant research gap in the existing literature by deriving a MAI (various indicators are considered to derive this index upon considering the above-reviewed past empirical studies, given multiple dimensions of assessment (Price et al. 2011, 479)), whilst remaining mindful of the limitations of a quantitative index in considering additional qualitative factors highlighted in the studies above.
DEVELOPING A MULTIDIMENSIONAL ASSESSMENT INDEX
Drawing from the studies on assessment outlined above, and from grounded experience as academics and practitioners, we have developed an index with eight dimensions to measure over-assessment.
Our first indicator looks at the total number of CAs a student is required to submit. There is a general perception that the higher the number of assessment tasks, the greater the extent of over-assessment, as it could lead to student burnout. For instance, Bree et al. (2014) suggested reducing the number of assessments from 10 to four. Indicator one will test this assumption.
Our second indicator looks at the total marks of each CA that the students are required to submit. In general, the higher the total marks, the greater the "size" of an assessment. This implies it may take a longer time to prepare for and complete the assessment, hence the greater the likelihood of students being overwhelmed (Trotter 2006, 517).
Indicator three examines the weighting of CAs. If too many CAs carry a low continuous assessment mark, students could feel over-assessed and even de-motivated; especially if said mark only counts a small percentage towards their final grade (Harland et al. 2015).
Indicator four assesses the difficulty of each CA (Cilliers et al. 2012; Jonkman et al. 2006). If assessments are too difficult and not pitched at the appropriate level of learning, students may take an unnecessarily long time to complete, and feel over-assessed, or feel a sense of anxiety and unpreparedness for a final assessment of an even higher degree of difficulty. The revised Bloom's Taxonomy level of difficulty index approach used by Dos Reis et al. (2022) is adopted in this study.1 There seems to be no past South Africa and international studies that suggest a particular National Qualifications Framework (NQF) level must be related to a particular Blooms' Taxonomy level, except the Dos Reis et al. (2022) study.
The frequency of CAs is our fifth indicator. Cilliers et al. (2012) speak of the impact of design of the assessment system: how the scheduling pattern of assessments (clustered or dispersed) and their imminence (near or far), along with the prevailing workload of students (high or low), affect how students learn in the face of upcoming assessments. For instance, if assessments happen almost every week, students may not have sufficient time to self-reflect on their performance to improve in subsequent assessment opportunities.2
Indicator six looks at the type of CA (Cilliers et al. 2012). For an assessment to be valid, an appropriate format should align with the intended course learning outcomes. It is also important to have a variety of assessments as this provides a multifaceted view of student performance, as no single assessment type can provide a complete picture of student understanding (Schuwirth and Van der Vleuten 2011). For example, if the same type of CA is given to students, they may find them tedious and feel unprepared for the final assessment of a different type. Usually, we expect a range of assessment types such as tutorials, practicals, class tests and large projects to help students prepare for module tests and exams, as argued by Jonkman et al. (2006).
Indicator seven examines the extent to which students are assessed on the same material. Whilst there is general consensus that assessing students on a prescribed chapter more than once would help students understand the course content and eventually perform academically better, it was pointed out by Galvez-Bravo (2016, 95) that repeated assessment of the same learning outcomes might over-do the time spent measuring performance and lead to surface learning.
Lastly, for indicator eight we look at whether students write a final assessment or a final examination (Hartland et al. 2015; Jessop and Tomas 2017; Tomas and Jessop 2019; Jonkman et al. 2006). If a module only requires the submission of CAs (i.e., there is no final assessment), students might perform better, i.e., the inclusion of final examination may lead to over-assessment and poor academic performance.
METHODS AND DATA
These eight indicators are taken into consideration to derive the MAI to investigate the extent of high assessment load in all undergraduate Economics modules at a university South Africa, namely the University of the Western Cape (UWC), which was established in 1960. It is regarded as a historically Black and disadvantaged university. UWC is one of the 12 universities in the country being classified as a traditional university that offers theoretically-oriented diplomas and degrees, with an aim to be a research-led university in-line with the institution's medium-term operating goals.
Critically, the resource-constrained context of South Africa is relevant to the issue of over-assessment; balancing validity, reliability and educational impact (effectiveness) with feasibility (efficiency) is needed to guard against unnecessary and costly over-assessment practices in an environment with limited human resource capacity. Economics is a compulsory subject in first-year level of the BCom program at this university, and is also a popular subject choice at second-year level (about 30% of students continue with Economics studies at this level after completing first-years) (UWC 2021). It is thus a useful subject to analyse in terms of quantity of significant data and relevance of findings to student success.
Undergraduate Economics modules at UWC
In 2021, the Department of Economics offered 12 undergraduate Economics modules: [A] and [B] are first-year modules, [C], [D], [E] and [F] are second-year modules, whereas [G], [H], [I], [J], [K] and [L] are third-year modules. For students who would like to major in Economics, modules [A]-[F] are compulsory. If students opt for a double-major specialisation (e.g., Economics and Information Systems), they are only required to enrol four third-year Economics modules, with [G], [H] and [I] being compulsory. If students rather opt for a single-major specialisation (e.g., Economics), they are required to enrol all six third-year Economics modules. Moreover, Table 2 shows the class size and pass rate of each module in 2021.
In 2021, due to COVID-19-driven campus lockdown, all learning, teaching and assessment activities took place online, with 60 lecture days (equivalent to 12 weeks) in each semester. Whilst under the normal circumstances (until 2019), Economics students at all undergraduate levels are required to write the final examination; in 2021, the non-exit-level modules at first-and second-year levels became CA based only, i.e., students were only required to submit CAs as a final assessment did not take place. Thus, continuous assessment marks (CAMs) comprised the 100 per cent weight of the final mark. For exit-level third-year modules, both the CAM and final assessment mark were included to derive the final mark.
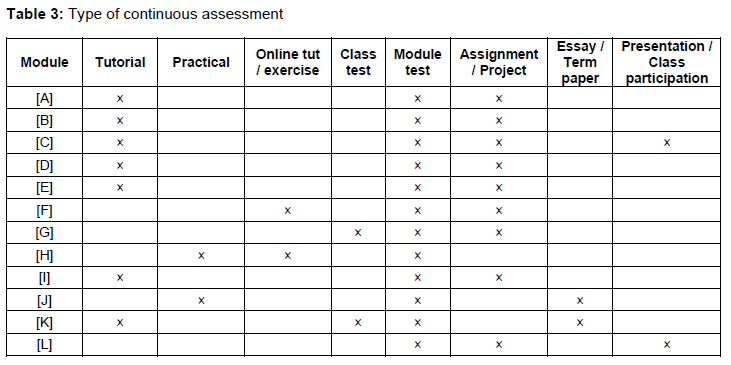
Numerous types of CAs were given to students across the modules under study (see Table 3), ranging from module tests and tutorials to essays, practicals, online exercises and even class participation (with the aid of the learning management system - known as "iKamva" at UWC - discussion forum). Tutorials, practicals and class tests are small-weight CAs with shorter duration and fewer prescribed chapters that aim to help students prepare better for the bigger-weight assessments such as module test. Essays and term papers primarily happened in level-3 modules to let students get exposed to long research paper writing and develop more advanced graduate attributes such as being critically literate. Furthermore, class participation happened purely online (due to lockdown) by compiling statistics on students' participation frequency in the iKamva discussion forum and chat room.
Lastly, the total number of CAs that the students were required to submit during the semester as well as the highest-CAM-weighting assessment(s) of each module are presented in Table 4. With regard to the latter, it can be seen that it was 25 per cent (module test) in modules [A]-[E] but 40 per cent (either module test or assignment) in modules [F]-[L].
Method
In equation terms: MAI = 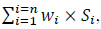 where:
- Wj is the weight of the indicator i.
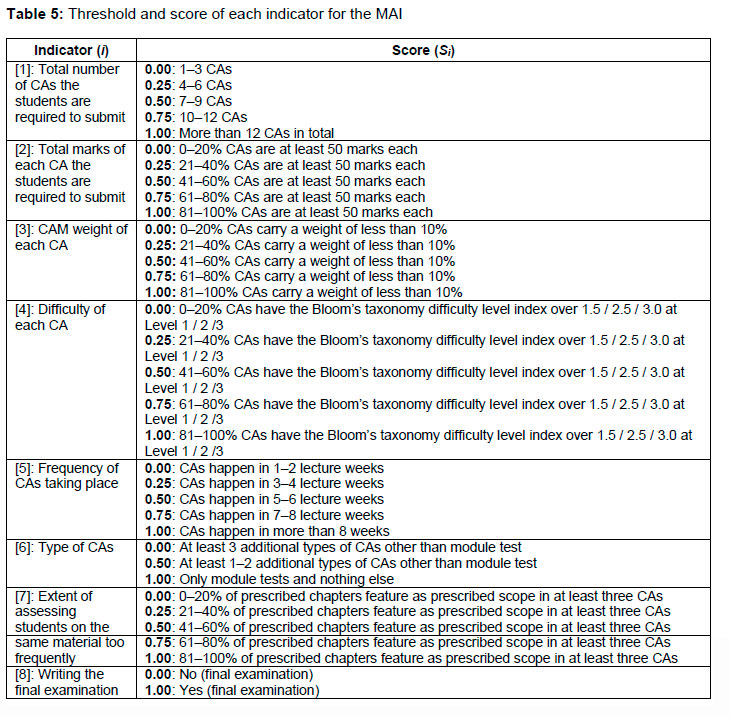
- Si stands for the over-assessment score of the indicator concerned. It is ranged between zero (least over-assessed in this indicator) and one (most over-assessed in this indicator) - refer to Table 5 for detailed explanation.
- MAI is ranged between zero and one. The higher the index, the more serious the students were over-assessed in the module concerned, upon taking all eight indicators into consideration.
Motivation for the inclusion of each indicator is discussed comprehensively above. Where required we have refined the indicators in the application to our case study. In our application of the MAI to the economics modules, for indicator [2], we have used 50 marks as the threshold. For the undergraduate Economics modules, the module test papers usually have a total of 50 marks. Hence, if other "smaller" assessments such as tutorials and practicals also carried 50 marks total, students could feel pressurised and over-assessed. With indicator [3], we have used 10 per cent weight as the threshold. For indicator [4], we have used a revised Bloom's Taxonomy level of difficulty index approach adopted in the Dos Reis et al. (2022) study. That study found an average difficulty index of 2.2 for first-year modules at NQF Level 5, but the focus of that research was on final assessments. Our study places more emphasis on the (possibly easier) continuous assessments during the semester; we assume Bloom's taxonomy difficulty level index threshold of 1.5, 2.5 and 3.0 for first-, second- and third-year modules, respectively.
With regard to indicator [5], students were generally happy to accumulate small marks, while being irritated and stressed by frequent grading (Harland et al. 2015). For indicator [6], we assume that if there are at least three types of CAs other than module tests (e.g., tutorials, assignment, short class test), they help provide a multifaceted view of student performance, while only having module tests and nothing else in the entire module may lead to over-assessment. Next, for indicator [7], we use "three times" as the threshold that students could feel over-assessed if the same chapter is included as the prescribed scope in at least three CAs. Lastly, for indicator [8], in our study this indicator can also be regarded as a "control" variable as it was explained earlier that in 2021, only the third-year modules required students to write the final assessment.
Data
Information in connection with assessments (e.g., total number of assessments, weighting, total marks and date of each assessment) is available in module course outline documents, which can be found on the iKamva course site. As all assessments took place online in 2021, the assessment papers could also be obtained from these iKamva sites.
The UWC Marks Administration System (MAS) captures information on students' marks in each assessment task, CAM, examination mark and final mark, before we used the information to derive the pass rate of each module. Lastly, ethics clearance was approved by the university's Humanities and Social Sciences Research Ethics Committee (reference number: HS22/2/14).
EMPIRICAL FINDINGS
Descriptive statistics on each indicator
Table 6 presents the results on each indicator. For indicator [1] (Total number of CAs the students were required to submit), students needed to submit as few as three in module [L] to as many as 10 in module [K]. The two first-year modules [A] and [B] consisted of nine CAs due to the presence of tutorial take-home exercises and tutorial online exercises (one usually expects tutorials to play a key role at this level). The highest number of 10 CAs in third-year module [K] and subsequently the highest score of 0.75 in indicator [1] is somewhat surprising, but upon further investigation, this module consists of four tutorials and four class tests.
For indicator [2] (Total marks of each CA), modules [F] and [J] require attention as a very high proportion of CAs had a total mark of at least 50. On the contrary, modules [G], [H] and [I] (all at level 3) only had 20 per cent or less of CAs with at least 50 marks in total, and hence were awarded a score of zero in this indicator. Given module [F] is only a second-year module, perhaps there is a need to reduce the total marks of some of the CA tasks to prevent students from feeling over-assessed. The same can be said to module [J] as well, despite being a higher-level third-year module. Moving on to indicator [3] (CAM weight of each CA), modules [A], [B], [C], [F] and [K] consist of a high proportion of CAs with a low CAM weighting. As expected, these low-weight assessments are mainly tutorials.
As far as the results relating to indicator [4] (Difficulty of each CA) are concerned, interestingly, Table 6 shows that it is mainly the lower-level modules (i.e., [A], [B] and [E]) which are associated with a higher proportion of CAs above the Bloom's Taxonomy difficulty level index threshold.
Due to the relatively heavy emphasis on tutorials in first-year modules, it is not surprising that the number of weeks of CA was the highest in modules [A] and [B], and thus these two modules were given the maximum score of one in indicator [5] (Frequency of CAs taking place). For example, in module [A], tutorial take-home exercises happened in lecture weeks 3, 5, 7 and 9 while tutorial online-exercises took place in weeks 4, 6, 8 and 10. With regard to other results, modules [G] and [J] (both offered at third-year) enjoy the lowest score of 0.25 as CAs only happened in four lecture weeks.
Table 3 earlier presented the information on the types of CAs per module. In Table 6, the results show that all but one module had two additional types of CAs in addition to module tests, and hence received a score of 0.5 in indicator [6] (Type of CA). The only exception is module [C] with three additional types of CAs (tutorial, assignment and class participation) to complement the module tests, and thus was given the lowest score of zero in this indicator. As far as the results in connection with indicator [7] (Extent of assessing students on the same material too frequently) are concerned, modules [A] and [B] (both first-year modules) assessed some chapters a high number of times (some chapters were included as prescribed scope in up to five CAs). This result is not surprising, given the abundance of tutorials in these two modules.
As explained in the previous section, all non-exit-level modules did not have final assessment or final examination taking place, and thus modules [A]-[F] were given a score of zero in indicator [8], whereas the score was one for the six exit-level modules [G]-[L]. This indicator can also be regarded as a "control" variable (that students were not required to write the final assessment in some modules) to ensure the empirical findings are comparable across all modules.
Descriptive statistics on the multidimensional assessment index
Using the results of Table 6, the MAI was derived. As a mathematical example, the MAI of module [A] was calculated as follows:

This index was as low as 0.2813 (module [D]) but as high as 0.5938 (module [B]). Interestingly, the two first-year modules [A] and [B] somehow had the highest MAI (0.5625 and 0.5938 respectively), followed by the second-year module [F] and third-year module [K] (0.5000). These four modules were also associated with relatively lower pass rates (80%-85%).
Figure 2 presents an XY-scatter plot to illustrate the relationship between the MAI and pass rate of the 12 modules under study, and the results suggest a negative relationship between the two variables. The correlation coefficient between them was almost -0.7 (-0.6922), which implies the above-mentioned negative relationship was fairly strong.
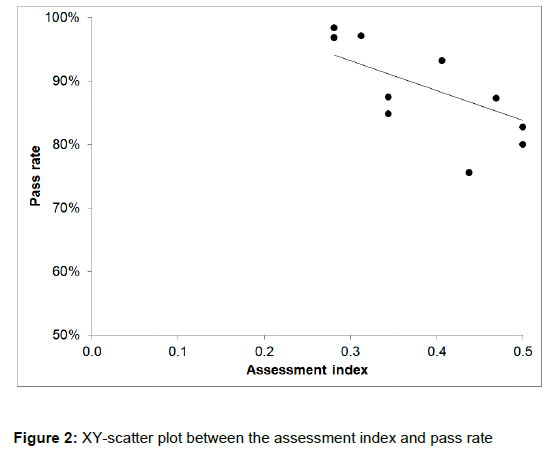
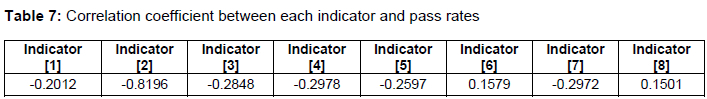
Table 7 shows the correlation coefficient between each indicator and the pass rate variable. In six out of the eight indicators under study, the correlation coefficient with pass rate had the expected negative sign. The negative correlation relationship was most serious between indicator [2] (percentage of CAs worth at least 50 marks) and pass rate (-0.8196). This finding suggests that this indicator could be the key "culprit" variable resulting in over-assessing students. Indicators [3], [4] and [7] are the next three in line, but the corresponding correlation coefficients were weaker (only about -0.3).
CONCLUSION AND RECOMMENDATIONS
This study considered eight assessment load related indicators to derive a MAI to investigate the extent of over-assessment in 12 undergraduate Economics modules, and the relationship (if any) between MAI and pass rate. The empirical findings showed a fairly strong negative linear relationship between MAI and pass rate: over-assessment negatively impacts on student learning and success. In addition, indicator [2] - proportion of CAs worth at least 50 marks total - was the one showing the strongest negative relationship with pass rate.
The findings of the study enable us to understand better what over-assessment (and under-assessment) actually means, as indicators other than the total number of assessments during the semester should also be taken into consideration. In other words, one should not adopt a one-dimensional approach by assuming over-assessment simply means a high number of CAs during the semester, but holistically evaluate the design qualities of an entire programme of assessment versus a single course (Jessop and Tomas 2017; O'Neill 2019), taking the nature, not just the number, of its assessments into account in order to improve assessment design for enhanced student learning and success in Higher Education.
Nonetheless, despite the empirical findings (especially the moderately strong negative relationship between MAI and pass rate), we should not immediately rush to conclude that poor academic performance is entirely attributed to over-assessments, as other factors still play an important role in influencing students' academic performance and success (e.g., student demographic characteristics, school characteristics, lecture and tutorial attendance, etc.) (Bokana and Tewari 2014).
We conclude the study with the following recommendations. Since the empirical findings showed that indicator [2] played the most dominant role in causing over-assessment and a negative impact on pass rate, there may be a need to examine whether the actual hours spent on writing assessments no longer corresponds with the "assignment and tasks" total notational hours as indicated in the module descriptors in the university's undergraduate calendar. Simply put, we need to investigate whether the actual assessment hours far exceed the official notational hours, resulting in students burn-out, over-assessment and subsequently poorer academic performance in the modules concerned. It is also important to assess whether notational hours are underestimated in the context of remote or online education.
Secondly, overlooked and rarely investigated factors such as marking turnaround time, quantity of quality of feedback to students, time gap between assessment submission and publication of feedback on the learning management system site, and even time gap between posting the assessment questions and student submission deadline could also be investigated in a follow-up study. The international empirical literature reviewed in section two suggests the importance of timely and detailed feedback to improve students' performance, yet it is not easy to capture and quantify information on academics' feedback to students and include as an additional indicator in the MAI. Moreover, other factors such as whether academics uploaded the prescribed learning and teaching materials late on the learning management system, or did not upload anything at all, could also play an important role in determining students' performance.
Thirdly, whether the adoption of incremental weighting (i.e., CAs that count a bigger weight of CAM happen towards the end of the semester, after students have a solid grasp of the subject matter) makes a difference to students' performance can be an area of future research. In all 12 Economics modules, there was no indication that the incremental weighting approach was adopted. In future, we can investigate if it is better to have smaller-weight assessments taking place early in the semester, whereas the bigger-weight assessments (which encourage deeper learning) happen towards the end of the semester, to improve students' academic performance.
For exit-level modules with a final assessment, due to tight university deadlines regarding the release of CAM in the final lecture week (or week 12), we usually refrain from giving CAs to students in weeks 11 -12 because these time constraints, making marking and feedback difficult. This raises the question of whether it is possible that the under-assessment of last few weeks' prescribed course content has a negative impact on students' final examination performance and subsequently pass rate. A separate study may be needed in this regard.
Last but not least, if the same study will be conducted across all modules at a particular undergraduate level in the faculty, it is important to consider the number of parallel modules students enrolled in the semester (e.g., students enrolled up to six 10-credit modules in the second-year of their BCom studies as an additional factor that determines if we over/under-assess students, as highlighted in O'Neill (2019). This could be assessed in relation to the indicators looking at frequency and total number of assessments. Our faculty has since piloted an assessment scheduling practice across programmes in an attempt to prevent periods of high assessment loads through more equal assessment distribution.
Overall, further validation of our proposed MAI in other disciplines, and at programme-levels, is needed.
STUDY LIMITATIONS
Two indicators included by the TESTA methodology were not included for the derivation of MAI, namely feedback and alignment of assessments with learning outcomes, as both of which would have been difficult to quantitatively estimate. In general, feedback is practiced in a variety of formats by academics and tutors, yet the specifics (volume and timeliness of feedback) were not specified in the reviewed module course outlines documents. Exploring feedback practices within our faculty remains an ongoing endeavour.
In terms of quantifying constructive alignment, even if module course outline documents contain learning outcomes and assessment details, how these may/not be aligned in practice remains a challenge to measure. Instead, the extent of prescribed chapters included as prescribed scope of assessments (or indicator [7]) was included as a "proxy" indicator. Furthermore, the two TESSA-adopted studies as reviewed earlier (Jessop and Tomas 2017; Tomas and Jessop 2019) also excluded this indicator.
Lastly, in our attempt to quantify assessment load, we cannot ignore the qualitative aspects of assessment: the lived assessment experiences and perceptions of academics and students. Including student voice in our explorations of assessment load and student learning and success, would in particular would contribute towards decolonising assessment practice in South African Higher Education. This forms part of ongoing research in our faculty.
To conclude, our attempt to define and measure over-assessment using a MAI, demonstrating the effects of multiple indicators on student learning, has significant value in the design and practice of assessment - critically, how to evaluate whether or not our assessments are enabling, or constraining, student learning and success. While MAI indicators included may need to be expanded, adapted or refined, and the utility and validation of the MAI remains to be determined in other disciplines and educational settings.
In closing, when seeking to balance the quantitative and qualitative aspects of effective assessment, assessment design and practice, intentional (vs. accidental) use of frameworks such sustainable assessment (Boud 2000; Boud and Soler 2016) and integrative assessment (Crisp 2012), or the systematic model of programmatic assessment (Schuwirth and Van der Vleuten 2011; Swan Sein et al. 2020), that adopt holistic, aligned, long-term and programmatic perspectives, may offer solutions.
ACKNOWLEDGENTS
This work was supported by the university office of the Deputy Vice Chancellor: Academic, under the University Capacity Development Grant (UCDG).
NOTES
1 In this study, the proportion of question of assessment papers in connection with each level of the revised Bloom's Taxonomy was derived, before a score was allocated to each proportion. This score ranged from as low as one for level one (remember) as high as level six (create) of the taxonomy. Afterwards, both the proportions and scores were taken into consideration to derive an overall difficulty index, with a minimum of one and maximum of six. The higher this index, the more difficult the assessment paper was.
2 Note that the first and fifth indicators are not entirely the same - it is possible that a tutorial happens on Monday and module test happens on Friday in the same week, and some can argue that the tutorial happening in the same week can somehow help the students prepare the Friday module test better. Students were generally happy to accumulate small marks, while being irritated and stressed by frequent grading (Harland et al. 2015)
REFERENCES
Bokana, Gerry and Dev Tewari. 2014. "Determinants of student success at a South African university: An econometric analysis." Anthropologist 17(1): 259-277. [ Links ]
Boud, David and Rebeca Soler. 2016. "Sustainable assessment revisited." Assessment & Evaluation in Higher Education 41(3): 400-413. [ Links ]
Boud, David. 1995. "Assessment and learning: Contradictory or complementary?" In Assessment for Learning in Higher Education, ed. Peter Knight, 35-48. Oxfordshire: Routledge. [ Links ]
Boud, David. 2000. "Sustainable Assessment: Rethinking assessment for the learning society." Studies in Continuing Education 22(2): 151-167. [ Links ]
Bree, Ronan, Karen Dunne, Bernadette Brereton, Gerry Gallagher, and John Dallat. 2014. "Engaging learning and addressing over-assessment in the science laboratory: Solving a pervasive problem." All Ireland Journal of Higher Education 6(3): 20601-20636. [ Links ]
Cilliers, Francois, Lambert W. T. Schuwirth, Nicoline Herman, Hanelie J. Adendorff, and Cees P. M. Van der Vleuten. 2012. "A model of the pre-assessment learning effects of summative assessment in medical education." Advances in Health Sciences Education 17(1): 39-53. [ Links ]
Crisp, Geoffrey. 2012. "Integrative assessment: Reframing assessment practice for current and future learning." Assessment and Evaluation in Higher Education 37(1): 33-43. [ Links ]
Dos Reis, Karen, Christie Swanepoel, Derek Yu, and Fiona Anciano. 2022. "Exploring the alignment of first-year summative assessments with Bloom's taxonomy: A longitudinal study." South African Journal of Higher Education 36(5): 37-57. [ Links ]
Dreyer, Johann. 2014. The educator as assessor. 2nd Edition. Pretoria: Van Schaik Publishers. [ Links ]
Galvez-Bravo, Lucia. 2016. "Overassessment in higher education: Does less mean more?" Innovations in Practice 10(2): 93-102. [ Links ]
Harland, Tony, Angela McLean, Rob Wass, Ellen Miller, and Kwong N. Sim. 2015. "An assessment arms race and its fallout: High-stakes grading and the case for slow scholarship." Assessment and Evaluation in Higher Education 40(4): 528-541. [ Links ]
Jessop, Tansy and Carmen Tomas. 2017. "The implications of programme assessment patterns for student learning." Assessment and Evaluation in Higher Education 42(6): 990-999. [ Links ]
Jessop, Tansy, Yassein El Hakim, and Graham Gibbs. 2014. "The whole is greater than the sum of its parts: A large-scale study of students' learning in response to different programme assessment patterns." Assessment and Evaluation in Higher Education 39(1): 73-88. [ Links ]
Jonkman, Mirjam, Friso De Boer, and Jacek Jagielski. 2006. "Are we over-assessing our students? The students' view." Paper presented at the 17th Annual Conference of the Australasian Association for Engineering Education, Auckland, 10-13 December. [ Links ]
Koh, Kim. 2017. "Authentic assessment." In Oxford Research Encyclopedia of Education, ed. George Noblit. Oxford: Oxford University Press. [ Links ]
Medland, Emma. 2018. "I'm assessment illiterate: Towards a shared discourse of assessment literacy for external examiners." Assessment and Evaluation in Higher Education 44(4): 565-580. [ Links ]
Natriello, Gary 1987. "The impact of evaluation processes on students." Educational Psychologist 22(2): 155-175. [ Links ]
O'Neill, Geraldine. 2019. "Why don't we want to reduce assessment?" All Ireland Journal of Higher Education 11(2): 1-7. [ Links ]
Popham, James. 2009. "Assessment literacy for teachers: Faddish or fundamental?" Theory Into Practice 48(1): 4-11. [ Links ]
Price, Margaret, Jude Carroll, Berry O'Donovan, and Chris Rust. 2011. "If I was going there I wouldn't start from here: A critical commentary on current assessment practice." Assessment and Evaluation in Higher Education 36(4): 479-492. [ Links ]
Schuwirth, Lambert and Cees Van der Vleuten. 2011. "Programmatic assessment: From assessment of learning to assessment for learning." Medical Teacher 33(6): 478-485. [ Links ]
Swan Sein, Aubrie, Hanin Rashid, Jennifer Meka, Jonathan Amiel, and William Pluta. 2020. "Twelve tips for embedding assessment for and as learning practices in programmatic assessment." Medical Teacher 43(3): 300-306. [ Links ]
Tomas, Carmen and Tansy Jessop. 2019. "Struggling and juggling: A comparison of student assessment loads across research and teaching-intensive universities." Assessment and Evaluation in Higher Education 44(1): 1-10. [ Links ]
Trotter, Eileen. 2006. "Student perceptions of continuous summative assessment." Assessment and Evaluation in Higher Education 31(5): 505-521. [ Links ]
University of the Western Cape. 2021. "2021 Faculty of Economic and Management Sciences Undergraduate Calendar" Bellville: University of the Western Cape. [ Links ]
UWC see University of the Western Cape. [ Links ]

