


Services on Demand
Article
 English (pdf)
 Article in xml format
 Article references
Indicators

Related links
-
 Cited by Google
 -
 Similars in Google
Share

 Permalink
South African Journal of Higher Education
On-line version ISSN 1753-5913
S. Afr. J. High. Educ. vol.37 n.3 Stellenbosch Jul. 2023
http://dx.doi.org/10.20853/37-3-4835
GENERAL ARTICLES
Curriculum analytics of an open distance learning (ODL) programme: a data-driven perspective
E. O. MashileI; A.FynnII; M. MatoaneIII
IUniversity of South Africa, Pretoria, South Africa. Department of Science and Technology Education. http://orcid.org/0000-0001-7234-9031
IIUniversity of South Africa, Pretoria, South Africa. Directorate of Institutional Research http://orcid.org/0000-0002-0480-8926
IIIUniversity of South Africa, Pretoria, South Africa. Dean and Head of the School of Applied Human Sciences University of KwaZulu-Natal Durban, South Africa https://orcid.org/0000-0002-1824-384X
ABSTRACT
Student support, which is an integral part of a learning programme, is most effective when it is integrated into the design of the curricula, rather than when it forms stand-alone interventions. Identifying those areas that require attention from a student support perspective is often based on the perspectives of the institution and teaching staff involved, rather than on how Students concerned interact with the programme. In this article, we draw on the research fields of curriculum analytics to identify areas of curriculum improvement for an ODL programme using student data. The results of the study indicate the important role that is played by curriculum analytics in designing student support interventions, and in restructuring elements of the curriculum structure to support student success. Such is done by ascertaining what constitutes the learned curriculum versus the planned curriculum, the Temporal Distance between Courses, and any bottlenecks within the programme that might hamper progression. The results, further, underscore the need for an effective execution strategy to be aligned with the principles that guided the development of the curriculum concerned.
Keywords: curriculum analytics, curriculum development, learning analytics, ODL, student support, student success.
INTRODUCTION
Educational outcomes, such as student throughput, have a long history as a measurement of the relative success of programmes and institutions. For some time, student attrition and throughput have been the primary indicators of the efficacy of academic programmes. Although a substantial amount of work has focused on the integration and sequencing of curricula, the evaluations concerned have often been conceptually carried out by a panel of expert reviewers, or by teaching staff within the programmes themselves. With the advent of educational data mining, higher education institutions (HEIs) are now afforded the opportunity to combine the long-term empirical analysis afforded by academic analytics that focus on such student success indicators as completion and course success rates (Greer et al. 2016) into curriculum development discourses. The advent of such fields as learning analytics (LA), curriculum analytics (CA) and academic analytics provides unprecedented access to student data (Dawson et al. 2019; Siemens 2013). Within the context of increasingly diverse student populations, inter-institutional competition and funding constraints, the notion of student success has moved to the forefront of the considerations of many institutions. The increased collection of temporal LA data, in particular, has facilitated the conducting of investigations into how students perform and self-regulate their coursework over time (Brown, DeMonbrun, and Teasley 2018a). However, much of such investigations tend to be focused on Students who are occupied with a single module, with Brown et al. (2018a) arguing that adopting an approach like this does not fully consider the degree of complexity that is faced by those students who register for multiple modules in a particular term. In the current article, we apply CA techniques to a learning programme to identify how the curriculum (in terms of the curriculum structure, the sequencing of modules and the module difficulty) has impacted on the levels of student success.
THEORETICAL UNDERPINNINGS
Curriculum provides the foundational basis for teaching and learning in higher education (Khan and Law 2015; Mälkki and Paatero 2015). It is generally thought to encompass materials, processes, and interactions comprising a course or programme of study with the intention of providing new knowledge, skills (Arafeh 2016), quality programmes, and services (Khan and Law 2015). There are however different conceptions, intentions, and emphases of curriculum in higher education arising from the many perspectives of stakeholders. Given the foregoing, curricular discrepancies often occur between the intended curriculum, the actual implemented curriculum and the assessed curriculum. Establishing a proper alignment between the intended-, actual-, and assessed-curriculum, through, amongst others, curriculum mapping, would ensure educational equity for all students and student achievement (Dutton 2015) and is thus an essential element of curriculum development.
Curriculum development
Curriculum development consist of planning, implementation, and evaluation of curricula as well as the interactions of people, processes, and procedures with the curriculum (Ornstein and Hunkins 2009). Curriculum planning involves many stakeholders, both internal and external, who need to collaborate closely, and takes place at various levels. According to Mälkki and Paatero (2015), curriculum planning at the institutional strategic level entails the consideration of various factors such as national accreditations, university rules and programme traditions, to name a few. At the programme level, curriculum planning consists of, amongst other things, a set of individual courses, which are connected, a learning path, educational goals, educational content, teaching and learning strategies, learning outcomes/competences, and student support. The role of student advising becomes particularly pronounced in flexible programmes where there is a large proportion of student choices with regard to the courses that constitute the curriculum. Pedagogy, learning outcomes or competences, student engagement, student assessment, and so on, are key constituents at the course level (Patton and Prince 2018). Depending on the conceptual framework used, different curriculum planning steps are specified, including situation analysis, communication with stakeholders, goals, content, learning opportunities, modes of presentation, and evaluation procedures (Huilgol 2020; Pereira et al. 2020; Patton and Prince 2018). Undertaking these steps in a careful manner has the benefit of ultimately enhancing student throughput (Morsy and Karypis 2019).
The curriculum design process is systematic, iterative (Méndez, Ochoa, and Chiluiza 2014; Pereira et al. 2020), and shaped by conceptions of learning held by the designers. According to Krogh, Qvortrup, and Graf (2021), curriculum designers are influenced by three distinct but interacting discourses of learning. The first discourse is based on the knowledge society and promotes the concept of competence. The second discourse is based on the concept of efficient learning that draws heavily on educational psychology. The third discourse is based on constructivist conceptions and promotes learner-centred education.
For the different learning traditions, there are suitable curriculum design models that could be used in scaffolding the curriculum development exercise (Modebelu 2015). In this study we utilize the curriculum development model proposed by Mendez et al. (2014), whose design has integrated a data-driven aspect to curriculum evaluation (Figure 1).
To close the loop of curriculum development requires the testing of the curriculum design implemented and refining the design based on feedback from stakeholders. The conceptual model depicted in Figure 1 follows a learner-centred approach to curriculum development whose evaluation makes use of data obtained from the implementation of the curriculum.
Evaluation of the curriculum development exercise is critical in ensuring continued quality, alignment, and renewal (Huilgol 2020). The data used in testing and or evaluating the curriculum is obtained through the use of curriculum analytics.
CURRICULUM ANALYTICS
CA uses analytical tools to collect and analyse educational data, such as programme structures and course grades, during the evaluation process of curriculum development. The analyses help to improve curriculum development, programme-level decision-making, and programme quality (Ochoa 2016b). According to Hilliger et al. (2020), the field of curriculum analytics is still young. It has emerged as a sub-field of LA with the purpose of getting a better understanding of the effectiveness of curriculum strategies and programme outcomes. The ultimate goal of CA is to engage managers and academics in making data-based decisions at the programme-level thereby improving student learning. This focus of CA differs from the numerous LA studies that focus on students enrolled in independent courses or small projects (Dawson et al. 2019).
According to Ochoa (2016a), although several sources of information could be used for curricular analysis, factual data obtained from the curriculum and its usage are invaluable. This data is objective in nature and can be classified into three groups, namely intrinsic, extrinsic, and interaction. Intrinsic information is derived from the curriculum itself. This information could be used from a quality promotion perspective to analyse curricular in relation to compliance with external standards (Arafeh 2016). Intrinsic information could also be used in curriculum mapping processes. For example, course information from university brochures could be fed into a CA tool that automatically detects whether a student has met learning outcomes of a course they did from another institution (Kitto et al. 2020). Extrinsic information is external to the programme and could serve as valuable input during programme re-design. For example, current trends in the job market for computer science students were mined to inform curriculum development (Lunn, Zhu, and Ross 2020). Interaction information is generated when students interact with the curriculum. Information in this group include course selections, assessment data and student data captured on the institution's databases.
CA methods have been used successfully in studies focussing on dropout (De Freitas et al. 2015; Zhuhadar et al. 2019), course recommender systems (Pardos, Fan, and Jiang 2019), and at-risk students (Shelton, Hung, and Lowenthal 2017). Dawson and Hubball (2014) used curriculum analytics to improve strategic curriculum decision-making in a university context. The tool they developed provided visualisations that aid in curriculum improvement. The tool was also able to identify and visualise learning connections between courses (i.e., common course pathways in a learning programme) and to provide valuable information as to whether students completed the programme with the required graduate attributes specified in a programme, thus serving a quality assurance purpose. Joksimovic et al. (2015) examined whether frequency and duration of student-student, student-instructor, student-system, and student-content interactions had an effect on learning outcomes, measured as final course grades. They found that educational level and context of a particular course has a significant impact on supported interaction types, and their importance for student achievement. Time spent on student-system interactions revealed the most significant, consistent and positive effect on final achievement. Ochoa (2016a) proposed a set of metrics that could be used in curriculum analysis. These metrics could be used in combination to enable more complex analyses of the programme such as determining the course concurrency, neglected courses, identification of bottlenecks, section planning, and course similarity. Brown, DeMonbrun, and Teasley (2018) investigated the impact of student performance when students are concurrently enrolled for courses identified as difficult. They studied how students performed in courses co-enrolled with one compulsory introductory course, the focal course. They found that the difficulty level of co-enrolled courses predicted the likelihood of students experiencing academic difficulty in a focal course. They also found that "changing academic performance in co-enrolled courses helped explain changing risk of academic difficulty in a focal course" (Brown et al. 2018, 308). CA studies were also used by Morsy and Karypis (2019) to understand how students' academic level impacts on student success, namely the quality of their passes and the time they take to graduate. They found that degree planning, in terms of the timing of courses and the ordering between them, plays an important role in the student's time to graduation. Their results could then be used by advisors to better guide students, with a potential to help increase academic success. Hilliger et al. (2020) highlights the importance of developing curriculum analytics tools to support continuous improvement of processes in higher education. Their study identified that managers and academics are key stakeholders for a tool aimed at empowering teaching staff to make data driven-analysis at different levels. Secondly, they found that a CA tool should be linked to an institutional process for it to have an impact on continuous curriculum improvement. Thirdly, their study found that implementation of a CA tool helped academics to "collect more and more varied evidence for curriculum discussions at programlevel" (Hilliger et al. 2020, 185), as well as with programme- and course-level information that facilitates reflection on students' core competencies and proficiency levels, which informs programme planning and programme quality.
METHODOLOGY
In the present study, the unit of analysis was the general stream of the Bachelor of Commerce degree at the University of South Africa (Unisa). The programme was selected due to its relatively large number of registered students, and due to its curriculum affording students options in relation to their specialisations. To complete the programme, a student must complete 360 credits. The curriculum consists of 30 modules of 12 credits each, which are to be taken over three years of full-time study, or over six years of part-time study. Students have to choose two majors from a menu of 11 majors, with them having to do Business Management (BM), Financial Accounting (FA) or Economics as a major. For each major, the curriculum specifies which modules are compulsory or elective. The modules may have their prerequisites specified, in which case the prerequisite module must be passed prior to the student taking their module of interest. A corequisite requires a student to take the specified module simultaneously with their module of interest.
Although the National Qualifications Framework specifies broad guidelines for all programmes, institutions are responsible for designing curricula that are unique to their circumstances. In the current study, we researched the interaction of the declared and the learned curricula, as experienced by Students involved. We investigated how students' enrolment patterns impacted on their progression, how specific modules impacted on their time to graduation, and how the curriculum structure impacted on their academic achievement. Being an ODL institution, Unisa transacts with students through distance education, with elements of a blended approach.
The data set, which, for the current study, consisted of two parts, was drawn from the 2011 to 2019 student records, including those relating to students who were still in the process of completing their qualification at the time of the research. The data analysis is based on the cohorts who first registered between 2011 and 2014, thus making it a subset of the entire data set, with it providing information about Students who had had sufficient time to complete the programme, which, for those studying through distance education at the time, lasted six years.
RESULTS AND DISCUSSION
Sequencing of modules in the programme
The temporal position of a module in a curriculum can have either a positive or a negative influence on students' experiences of a specific learning programme. Modules that are difficult to comprehend, or that are not properly structured, can discourage those students who take them, leading to early dropout rates (Brown et al. 2018a). Making the transition from school to university is not easy. This gets confounded when students are expected to use a mode of programme delivery that departs from the typical on-campus delivery, such as ODL. Learning programmes, particularly general formative programmes, are, thus, structured and designed so that Students concerned are properly inducted into the various scholarly disciplines addressed in terms of the qualification sought. The assumption here is that the choice of which modules students take at the start of their courses, and which they proceed to study further down the line, is deliberate, with it being based on sound professional practice. The sequence in which students take modules in a learning programme tends to be expected to correlate with the order of the published curriculum, leading to the investigation of whether such was, indeed, the case for those students who were surveyed in terms of the current study.
A CA metric used to compute the real position of a module in a curriculum is the Course Temporal Position (CTP). The CTP measures the average semester in which Students prefer to take a particular module (i.e., as part of the learned curriculum), with it, as such, establishing the real position of a module within a programme, as opposed to what is set out in the declared curriculum (Ochoa 2016a). In the current study, the CTP was, thus, used to perform a quantitative analysis of the status of the modules in the BCom.
Accordingly, the data set concerned was found to contain certain data elements, in terms of which Students involved had obtained some credits before enrolling for the current programme. Such prior credits were not considered in calculating the CTP. The declared curriculum was presented in the brochures, which opened the way to allowing Students concerned to take a full-time equivalent number of modules, amounting to 120 credits per year. With the programme being offered through distance education, most students who were enrolled for the programme were part-time. The planned semester numbers were, thus, doubled, so as to provide the upper limit of the declared curriculum for the aforementioned part-time students.
Table 1 provides values for the CTP for all compulsory modules in the programme, with the majors chosen being BM and FA. All the CTP values involved can be seen to fall within the declared lower and upper bounds. On analysing the other majors, Rail Transport and Pipelines in the Transport Economics major was found to have been planned for the fifth semester, but actually taken by Students during the fourth semester. Students who took the Statistics major took four of the modules at second level, before even attempting the first-level modules. Accordingly, the need was detected to put measures in place to enforce the correct sequencing of the declared curriculum, since very few students were found to have attempted the second-level modules concerned. The reversed sequencing also meant that a large amount of time tended to lapse between students taking the second- and third-level modules (which is a phenomenon that is discussed further below).
Analysis of the CTP indicates that Students mostly took modules during the period suggested by the curriculum. The CTP metric also shows that Students did not pursue the full-time equivalent number of modules per semester. For example, none of the modules exhibit a CTP value of exactly one. However, many of the CTP values are towards the lower boundary, indicating that a substantial number of Students were taking more modules per teaching period than would have been expected for a purely part-time student. The implication might be that Students concerned tended to overload themselves with coursework, despite studying on a parttime basis.
Time lapse in taking consecutive modules
The declared curriculum, depending on the fields of study or the subject area concerned, might contain hierarchical knowledge structures. In other words, Students might require knowledge or skills developed at the lower levels, for them to be able to achieve learning outcomes at a higher level. The time lapse between taking two consecutive modules is, thus, important, with its measurement being made possible by means of computing the Temporal Distance between Courses (TDI). The TDI measures the number of semesters that, on average, a student takes to register for any two modules. As such, the TDI can "establish the actual sequence in which courses are taken" (Ochoa 2016a).
Table 2 shows the TDI values for all compulsory module pairs in terms of the BM and FA majors. For the first-level compulsory modules, a slight increase can be seen in the order of taking modules, compared to that which can be seen in the case of the declared curriculum. The order of taking modules for the FA modules between the first and second levels differs from that of the declared curriculum, with Students, at most, skipping a semester before taking the second-level modules. In particular, most students appear not to have taken FAC2601 and FAC2602 simultaneously. The order of the learned curriculum could, thus, be made explicit in terms of the declared curriculum. The order of taking modules from the second to the third level is shown to have been delayed by between two and four semesters. The TDI values suggest that the declared curriculum could have been more explicit as to when the modules should have been taken. Curriculum advising, in this context with specific reference to the declared curriculum, clearly requires attention, as is shown by the limited number of scaffolds present in
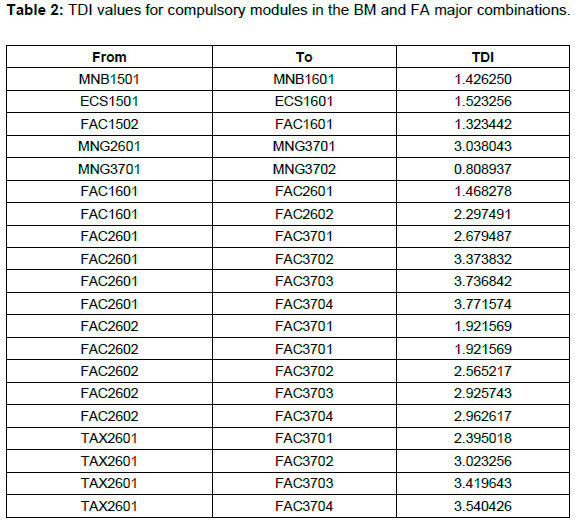
In other words, the declared curriculum was not explicit regarding the order in which the modules were required to be taken at the second and third levels. For those modules where the content of one level was required at another level, knowledge gaps might have been found to occur, when the timing of taking the modules was prolonged, thus resulting in the relevant students' failure of the modules at the higher level.
Curriculum efficacy
A curriculum design feature was the amount of time allocated for Students to complete all the constituent modules. At the time of the study, the programme's duration was three years for a full-time student, and six years for a part-time student. The prolongation of studies was found to have implications for Students themselves, as well as for the university and the society concerned. Students who took longer than average to complete the programme lost out on earning potential and, for those who had taken on loans to cover their tuition fees, their level of indebtedness increased. For the university, and, by extension, for the government, in terms of university subsidy, prolongation of the study period meant that additional expenditure was incurred for each student, and that fewer places were, consequently, made available for normal-term students. For the society, the prolongation of studies meant that fewer individuals than would otherwise have been the case were available to contribute timeously to the socioeconomic development of the country.
With CA being able to compute the efficiency measures of a curriculum, in this section of the study, social networking techniques were employed to analyse the efficacy of the programme. First, the amount of time that Students took to pass the different modules of the programme was calculated, with the metric involved being termed the "course duration" (CDU) (Ochoa 2016a). The CDU was used to illustrate how individual modules contributed to extending the amount of time taken to qualify. In other words, the more time that was spent in attempting a module, the more overall time was taken to complete the programme. The CDU was calculated by averaging the difference between the first time that a student registered for a module and when they passed the module. Variations can be applied in computing the CDU, with the variation used in the current study for computing the CDU having been such that students who had not yet passed the module were excluded from the calculation.
Table 1 provides the values for the CDU in a select number of modules of the programme. The results show that students took an average of one-and-a-half semesters to pass FAC1601, whereas they took, on average, almost two semesters to pass AIN1501. In contrast, some modules, like MNM1503, were always passed the first time that a student registered for them. Analysing the CDU for all the modules in the programme helped in identifying those modules that required the offering of special student support, in that many students were unable to succeed in them the first time that they registered for them.
The CDU was then used, in combination with the CTP and TDI, to analyse the programme for possible bottlenecks. A bottleneck arises when a module that students are required to complete to gain the qualification concerned is passed with difficulty. Ochoa (2016a) describes the steps that can be followed to identify bottleneck modules in a curriculum. Accordingly, those courses with prerequisites were indicated as the nodes on a directed graph. Since the modules in the programme were organised around the majors concerned, with little to no overlap occurring between their modules, we developed the graphs according to each major (see Figures 2 to 4). The horizontal axis of the graphs represents the average relative teaching period, with the averages concerned ranging from zero to eight. The path (arrow) leading from one module to the next, which is called an "edge", used the TDI values between the different modules. We used different edge colours to show which modules were taken in sequence. The red edges represent the modules that were taken more or less in sequence in terms of the learned curriculum. The blue edges indicate TDI values less than 1, implying that a substantial number of students concerned might have taken the modules involved simultaneously. The green edges have TDI values greater than 3, indicating that students skipped two or more semesters before taking the consecutive module, as set out in the declared curriculum. Three was the upper limit, since the declared curriculum of the programme did not provide for sequences to be present at levels 2 and 3, as well as due to the part-time nature of most students in the programme. The module(s) with the lowest CTP value(s) can be seen to constitute the start of the critical paths towards the third-level modules. The modules on the critical paths with a CDU threshold of 1.5, which are highlighted in green, constituted the bottleneck. Such modules contributed to a student spending longer than average in the learning programme.
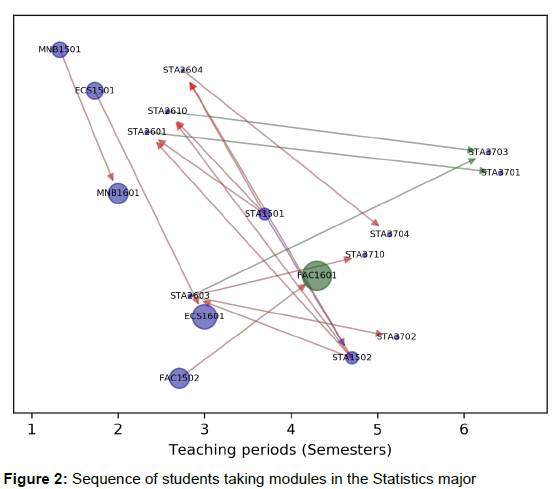
The figure of the learned curriculum clearly shows the real position of the modules. Since the position along the horizontal axis is comprised of the CTP values, the numbers concerned provide the registration patterns of the individual modules in the programme. Using diagrammatic representations shows the variability in the sequencing of modules in the programme. Those registration patterns that are antithetical to the declared curriculum are evident, as is exemplified in the case of the Statistics major (Figure 2). Furthermore, the pictorial view shows the most popular modules in the programme. In the figures, the size of the node is proportional to the number of students registered for the module, as present in the data set. Analysing all the majors showed that the most popular majors (in declining order) for the graduates were BM (88.4%), FA (33.8%), Industrial Psychology (25.7%) and Economics (19.9%). Tourism Management (2.31%), Transport Economics (1.39%) and Statistics (1.39%), also in declining order, can be seen to have been among the least popular majors.
The pictorial view of the curriculum also helped in identifying the degree of flexibility of the programme. A characteristic of a flexible curriculum is the extent to which students involved can choose to select the modules in which they are interested, as well as the sequence in which they take the modules. The above is contrary to the situation that prevails in terms of a fixed curriculum, which has rigid rules regarding which modules constitute the learning programme, and the order in which the modules should be taken. The degree of flexibility could also be determined by the number of elective courses made available to students in relation to the core, or required, modules.
A curriculum with many prerequisites and corequisites is characterised as being more fixed than it is flexible. The distinction between flexible and fixed curricula, as operationalised in the current study, was, thus, a matter of the extent to which the prerequisites and the corequisites were specified in terms of the declared curriculum. A curriculum with many prerequisites and corequisites has relatively few options open for students concerned.
Flexible curricula, like the most generic formative qualifications, are an attempt to present flexible learning pathways, while maintaining standard learning outcomes at the summative assessment level. While the efficacy of the approach can, and should, be disputed, given the chronically low throughput rates in South African HE, flexible curriculum structures still remain in place at several institutions. We therefore argue that, given the prevalence of flexible curricula, it is imperative to develop more transparent, empirically established curriculum sequencing and mapping processes than have been available in the past. Granting heightened transparency to all those stakeholders who are on the optimal learning pathways in terms of the established curricula would allow for such processes to become established.
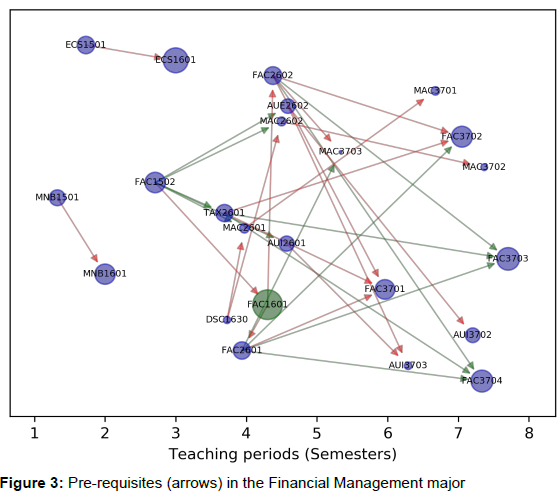
We graphically represented those modules that were specified as prerequisites in the curriculum, by means of an arrow drawn between two nodes. The resultant graphs (e.g., Figure 3) show the multiple prerequisites present in the programme, which left very little manoeuvrability in terms of the electives. On the surface, the presence of a choice of two majors out of eleven seems to offer great enough variety, but following on the initial decision-making, few options were available to students. For example, a student who chose to do FA and Quantitative Management could have, at most, chosen only two to three electives. In general, then, diagonal articulation between majors can be seen to be particularly difficult in cases of curricula with multiple prerequisites and corequisites.
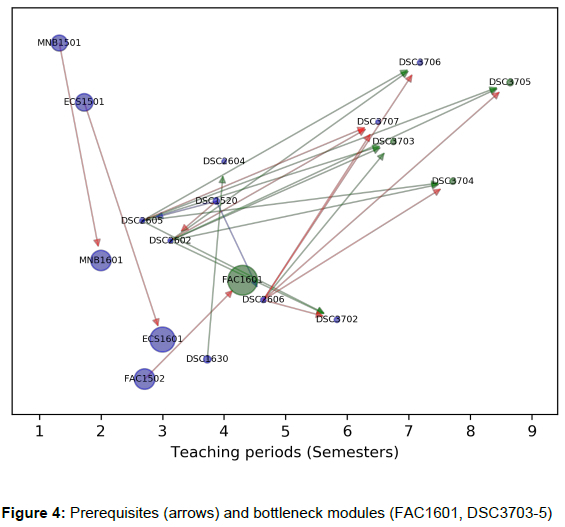
Several edges had a green colour (see Figures 3 and 4), indicating delays in registering for sequenced modules in terms of the learned curriculum. Such delays, as contained in the declared curriculum, are undesirable, and should be discouraged through the provision of timely curriculum-related advice.
In the current study, few modules in the programme could be regarded as bottlenecks. The FAC1601 module, which was compulsory for all students in the programme, was found to be a prerequisite for the taking of second-level modules in terms of two of the most popular majors, namely BM and FA. For such majors, students were required to take five modules at third level, with three such modules in the Quantitative Management major being flagged as bottlenecks (Figure 4). The modules concerned contributed towards delaying students involved from completing the learning programme in time, hence problematising the achievement of the qualification.
Impact of modules on students' achievement
Determining the influence of compulsory modules on students' overall achievement in the programme was covered in this part of the study. Identifying which modules tend to impact, either positively or negatively, on students' achievement is an important consideration in terms of curriculum development (Mendez et al. 2014). Since the programme concerned was structured around the majors that lacked overlapping modules beyond the first level, the compulsory modules, as outlined in the declared curriculum, were analysed.
Operationalising student achievement as the graduation grade point average (GPA), we used a five-point score for the GPA, in terms of which the percentage marks attained were categorised as follows: 80-100 (4), 70-79 (3), 60-69 (2), 50-59 (1), and 0-49 (0) (Great School Partnership 2013).
The results of the analysis of the most popular major in the programme, namely Business Management, are presented below. A total of 316 graduates were found to have taken the compulsory modules for the subject concerned. Subsequently, principal component regression (PCR) was applied to the data set of compulsory modules in the BM major.
The measure of PCR was chosen for the current study, particularly for its ability to overcome the extent of multicollinearity (Reiss and Ogden 2007; Dunn 2019) existing among the different modules concerned. PCR is a multivariate exploratory technique, in terms of which the response variable is regressed upon the principal components (PCs) emanating from a principal component analysis (PCA). By using PCA prior to regression, the indicator variables that are strongly correlated are combined into PCs, which, because they are orthogonal to each other, serve to eliminate the multicollinearity problem.
Calibration metrics were used to determine how many components to retain in the final solution. Specifically, the tracking of the mean standard error (MSE) was done by choosing components in which the cross-validated MSE was at a minimum (Mevik 2004), as is shown in Figure 5. The five PCs, which accounted for 76 per cent of the variance (Table 3), correlated with the GPA concerned.
Using the eigenvectors associated with the first PCs, the study obtained loadings representing how much (weight) each original variable contributed to the PCs concerned (Table 4). The loadings indicate that the PC1 has positive values only, whereas the other PCs can be seen to be responsible for the contrast between positive and negative loadings due to each module.
Determining the impact of the individual modules on the GPA involved building a prediction model based on the measured GPA values (Figure 6), resulting in obtaining a cross-validated correlation of 0.885. The final regression equation for the model is
GPA = 1.940 + 0.300PC1 - 0.053PC2 - 0.027PC3 - 0.032PQ - 0.066PC5 (R2 = 0.9036, cross - validated R2 = 0.8850, MSE = 0.0622)
student's GPA, with those on the left-hand side of the plot having the most negative impact on the GPA. The modules in the middle were found to have a low positive influence, whereas those on the right-hand side of the plot were found to have a more positive influence on students' GPA.
CONCLUSION
The results of the study brought to the fore the tensions existing between the declared curriculum and what students ultimately learned. The accommodation of students' needs, in terms of them preferring to register for modules in particular sequences deviating from the design of the curriculum, was found to negatively impact on some students' success in the programme surveyed. The curriculum sequencing involved, which in general is deemed to be core to the successful scaffolding of learning, was not followed in all instances (O'Neill, Donnelly, and Fitzmaurice 2014).
The programme flexibility, as designed during the curriculum development stages, was found not to have been executed consistently, since some majors and module combinations restricted students' options. The above, coupled with the presence of modules that some students found difficult to pass, resulted in certain cases of bottlenecks occurring in the programme. The presence of bottlenecks in a learning programme tends to reduce the efficiency of HE and, hence, its identification is critical in terms of any related programme evaluation.
Implications for higher education
The results of this study confirm that the use of metrics in testing and analysing programmelevel information helps in improving programme planning. The findings of the present study suggest that HEIs having flexible programmes should consider advising students to take courses in sequences that support ease of progress through the programme rather than select pathways that may hinder their time to graduation. The CA methods used in this study provides insight into pathways in a programme that students who took the course in the past struggled with. Knowledge of these pathways could then be used by advisors, both academic and support, to support students in their selection of courses. Provision of information that feed into student advising has the potential to aid student success and improve students' experience of the institution. The identification and distribution of the data however needs to be targeted towards an institutional process (Hilliger et al. 2020). In this case, the process where the metrics used in this study would bear fruit is in the domain of student advising. To implement such student advising in large-scale programmes, it is recommended that HEIs develop recommender tools (Lonn et al. 2014; Brown, DeMonbrun, and Teasley 2018b) that could reach all registered students, rather than be limited to the few students that may be willing to seek the counsel of student advisors.
Not all students in higher education, the proportion that eventually graduate, obtain passes that allows them to proceed to higher studies, thus impacting on the flow towards research degrees that are necessary for socio-economic development in the country. Enhancing the quality of passes in undergraduate degrees is thus important in facilitating entry to higher studies. The analytical methods used in this study not only identifies bottleneck courses, but also identify those courses that impacts negatively on the quality of the obtained degree. These methods could enable better planning at programme-level by ensuring 1) students do not enrol concurrently for two or more of such courses, 2) curriculum improvement exercises are undertaken, and 3) detailed curriculum mapping exercises are conducted on the affected courses. With the knowledge of which courses negatively impact on the quality of a degree, HEIs could conduct evaluation studies, engaging with stakeholders,
Applying CA in terms of mapping exercises can support the development of student support interventions to the stage where they are capable of responding to the actual challenges experienced by students concerned. The use of CA was, further, able to provide metrics that could, in future, be used to communicate with students involved during student support interventions. Since CD is influenced by contextual factors, the results of this study deepens the practice of LA (Siemens 2013) in an ODL environment. From a research perspective, this study provides evidence of the usefulness of LA in supporting curriculum development and its use in institutions from developing contexts (Herodotou et al. 2020).
REFERENCES
Arafeh, Sousan. 2016. "Curriculum Mapping in Higher Education: A Case Study and Proposed Content Scope and Sequence Mapping Tool." Journal of Further and Higher Education 40(5): 585-611. https://doi.org/10.1080/0309877X.2014.1000278. [ Links ]
Brown, Michael Geoffrey, R. Matthew DeMonbrun, and Stephanie D. Teasley. 2018a. "Conceptualizing Co-Enrollment: Accounting for Student Experiences Across the Curriculum." In Proceedings of the 8th International Conference on Learning Analytics & Knowledge - LAK'18, 305-309. [ Links ]
Brown, Michael Geoffrey, R. Matthew DeMonbrun, and Stephanie D. Teasley. 2018b. "Conceptualizing Co-Enrollment: Accounting for Student Experiences Across the Curriculum." In LAK'18: International Conference on Learning Analytics and Knowledge, 305-309. Sydney, NSW, Australia: ACM. https://doi.org/https://doi.org/10.1145/3170358.3170366. [ Links ]
Dawson, Shane and Harry Hubball. 2014. "Curriculum analytics: Applications of social network analysis for improving strategic curriculum decision-making in a research-intensive university." Teaching and Learning Inquiry 2(2): 59-74. https://doi.org/10.20343/teachlearningu.2.2.59. [ Links ]
Dawson, Shane, Srecko Joksimovic, Oleksandra Poquet, and George Siemens. 2019. "Increasing the Impact of Learning Analytics." In Proceedings of the International Conference on Learning Analytics and Knowledge. Arizona, USA: ACM. https://doi.org/10.1145/3303772.3303784. [ Links ]
De Freitas, Sara, David Gibson, Coert Du Plessis, Pat Halloran, Ed Williams, Matt Ambrose, Ian Dunwell, and Sylvester Arnab. 2015. "Foundations of Dynamic Learning Analytics: Using University Student Data to Increase Retention." British Journal of Educational Technology 46(6): 1175-1188. https://doi.org/10.1111/bjet.12212. [ Links ]
Dunn, Kevin. 2019. Process Improvement Using Data. https://learnche.org/pid/. [ Links ]
Dutton, Ellen E. 2015. "The Implementation of Curriculum Mapping at a Private High School." PhD. Diss. Walden University. [ Links ]
Great School Partnership. 2013. "Grade Point Average." The Glossary of Education Reform. [ Links ]
Greer, Jim, Craig Thompson, Ryan Banow, and Stephanie Frost. 2016. "Data-Driven Programmatic Change at Universities: What Works and How." In Proceedings of the 1st Learning Analytics for Curriculum and Program Quality Improvement Workshop, ed. Jim Greer, Marco Molinaro, Xavier Ochoa, and Timothy Mckay, 30-35. Edinburgh: Learning analytics and Knowledge. [ Links ]
Herodotou, Christothea, Bart Rienties, Martin Hlosta, Avinash Boroowa, and Chrysoula Mangafa. 2020. "The Scalable Implementation of Predictive Learning Analytics at a Distance Learning University: Insights from a Longitudinal Case Study." The Internet and Higher Education 45: 100725. https://doi.org/10.1016/j.iheduc.2020.100725. [ Links ]
Hilliger, Isabel, Camila Aguirre, Constanza Miranda, Sergio Celis, and Mar Pérez-sanagustín. 2020. "Design of a Curriculum Analytics Tool to Support Continuous Improvement Processes in Higher Education." In Proceedings of the 10th International Conferences on Learning Analytics and Knowledge (LAK'20), 181-186. Frankfurt, Germany: ACM. https://doi.org/https://doi.org/10.1145/3375462.3375489. [ Links ]
Huilgol, Shobha V. 2020. "Contextual Curriculum Planning: Tailoring Your Curriculum to the Local Context - An Overview." AI Ameen J Med Scie 3(1): 1-4. [ Links ]
Joksimovic, Srecko, Dragan Gasevic, Thomas M. Loughin, Vitomir Kovanovic, and Hatala Marek. 2015. "Learning at distance: Effects of interaction traces on academic achievement." Computers & Education 87: 204-217. https://doi.org/10.10167j.compedu.2015.07.002. [ Links ]
Khan, Mohammad Ayub and Laurie Smith Law. 2015. "An Integrative Approach to Curriculum Development in Higher Education in the USA: A Theoretical Framework." International Education Studies 8(3): 66-76. https://doi.org/10.5539/ies.v8n3p66. [ Links ]
Kitto, Kirsty, Nikhil Sarathy, Aleksandr Gromov, Ming Liu, Katarzyna Musial, and Simon Buckingham Shum. 2020. "Towards Skills-Based Curriculum Analytics: Can We Automate the Recognition of Prior Learning?" In Proceedings of the Tenth International Conference on Learning Analytics and Knowledge (LAK '20), 171-180. Frankfurt, Germany: ACM. https://doi.org/https://dl.acm.org/doi/10.1145/3375462.3375526. [ Links ]
Krogh, Ellen, Ane Qvortrup, and Stefan Ting Graf. 2021. Didaktik and Curriculum in Ongoing Dialogue. Taylor & Francis. https://doi.org/10.4324/9781003099390-1. [ Links ]
Lonn, Steven, Thomas Brown, West Hall, Ann Arbor, Cinda-sue Davis, Darryl Koch, Chrysler Cntr, and Ann Arbor. 2014. "Customized Course Advising: Investigating Engineering Student Success with Incoming Profiles and Patterns of Concurrent Course Enrollment." In LAK '14: Proceedings of the Fourth International Conference on Learning Analytics and Knowledge, 16-25. [ Links ]
Lunn, Stephanie, Jia Zhu, and Monique Ross. 2020. "Utilizing Web Scraping and Natural Language Processing to Better Inform Pedagogical Practice." In Proceedings of the 2020 IEEE Frontiers in Education Conference. https://doi.org/10.1109/FIE44824.2020.9274270. [ Links ]
Mälkki, Helena and Jukka V. Paatero. 2015. "Curriculum Planning in Energy Engineering Education." Journal of Cleaner Production 106: 292-299. https://doi.org/https://doi.org/10.1016/j.jclepro.2014.08.109. [ Links ]
Méndez, Gonzalo, Xavier Ochoa, and Katherine Chiluiza. 2014. "Techniques for Data-Driven Curriculum Analysis." In Proceedings of the Fourth International Conference on Learning Analytics and Knowledge, 148-157. Indianapolis, IN, USA. https://doi.org/10.1145/2567574.2567591. [ Links ]
Mendez, Gonzalo, Xavier Ochoa, Katherine Chiluiza, and Bram de Wever. 2014. "Curricular Design Analysis: A Data-Driven Perspective." Journal of Learning Analytics 1(3): 84-119. https://doi.org/10.18608/jla.2014.13.6. [ Links ]
Mevik, Bj0rn-helge. 2004. "Mean Squared Error of Prediction (MSEP) Estimates for Principal Component Regression (PCR) and Partial Least Squares Regression (PLSR)." Journal of Chemometrics 18(9): 422-429. [ Links ]
Modebelu, Melody Ndidi. 2015. "Curriculum Development Models for Quality Educational System." In Handbook of Research on Enhancing Teacher Education with Advanced Instructional Technologies, ed. Nwachukwu Prince Ololube, Peter James Kpolovie, and Lazarus Ndiku Makewa, 259-276. Hershey, PA: IGI Global. https://doi.org/10.4018/978-1-4666-8162-0.ch014. [ Links ]
Morsy, Sara and George Karypis. 2019. "A Study on Curriculum Planning and Its Relationship with Graduation GPA and Time To Degree." In The 9th International Learning Analytics & Knowledge Conference (LAK19), 26-35. Tempe, AZ, USA: ACM. https://doi.org/https://doi.org/10.1145/3303772.3303783. [ Links ]
O'Neill, Geraldine, Roisin Donnelly, and Marian Fitzmaurice. 2014. "Supporting Programme Teams to Develop Sequencing in Higher Education Curricula." International Journal for Academic Development 19(4): 268-280. https://doi.org/10.1080/1360144X.2013.867266. [ Links ]
Ochoa, Xavier. 2016a. "Simple Metrics for Curricular Analytics." In Proceedings of the 1 St Learning Analytics for Curriculum and Program Quality Improvement Workshop, 1590: 20-26. [ Links ]
Ochoa, Xavier. 2016b. "Simple Metrics for Curricular Analytics." In CEUR Workshop Proceedings, Vol. 1590, 20-26. CEUR-WS. [ Links ]
Ornstein, A. C. and F. P. Hunkins. 2009. Curriculum Foundations, Principles and Issues. 5th ed. Boston, MA: Allyn & Bacon. [ Links ]
Pardos, Zachary A., Zihao Fan, and Weijie Jiang. 2019. "Connectionist Recommendation in the Wild: On the Utility and Scrutability of Neural Networds for Personalized Course Guidance." User Modeling and User-Adapted Interaction 29: 487-525. https://doi.org/https://doi.org/10.1007/s11257-019-09218-7. [ Links ]
Patton, Anna Louise, and Krista L. Prince. 2018. "Curriculum Design and Planning: Using Postmodern Curriculum Approaches." Journal of Curriculum Theorizing 32(3): 93-114. [ Links ]
Pereira, Jose, Srini Chary, Jeffrey B. Moat, Jonathan Faulkner, Nathalie Gravelle-Ray, Odete Carreira, Diana Vincze, et al. 2020. "Pallium Canada's Curriculum Development Model: A Framework to Support Large-Scale Courseware Development and Deployment." Journal of Palliative Medicine 23(6): 759-67. https://doi.org/10.1089/jpm.2019.0292. [ Links ]
Reiss, Philip T. and R. Todd Ogden. 2007. "Functional Principal Component Regression and Functional Partial Least Squares." Journal of the American Statistical Association 102(479): 984-996. https://doi.org/10.1198/016214507000000527. [ Links ]
Shelton, Brett E., Jui-long Hung, and Patrick R. Lowenthal. 2017. "Predicting Student Success by Modeling Student Interaction in Asynchronous Online Courses." Distance Education 38(1): 5969. https://doi.org/10.1080/01587919.2017.1299562. [ Links ]
Siemens, George. 2013. "Learning Analytics: The Emergence of a Discipline." American Behavioral Scientist 57(10): 1380-1400. https://doi.org/10.1177/0002764213498851. [ Links ]
Zhuhadar, Leyla, Jerry Daday, Scarlett Marklin, Bruce Kessler, and Tuesdi Helbig. 2019. "Using Survival Analysis to Discovering Pathways to Success in Mathematics." Computers in Human Behavior 92: 487-95. https://doi.org/10.1016/j.chb.2017.12.016. [ Links ]

