


Services on Demand
Article
 English (pdf)
 Article in xml format
 Article references
Indicators

Related links
-
 Cited by Google
 -
 Similars in Google
Share

 Permalink
South African Journal of Higher Education
On-line version ISSN 1753-5913
S. Afr. J. High. Educ. vol.37 n.2 Stellenbosch May. 2023
http://dx.doi.org/10.20853/37-2-4862
GENERAL ARTICLES
The development, validation and standardisation of a questionnaire measuring an auditing teaching-learning intervention at a SAICA-accredited university
O. StumkeI; A. M. MoolmanII; V. LeendertzIII
INorth-West University, South Africa. School of Accounting Sciences, https://orcid.org/0000-0001-8240-6298
IINorth-West University, South Africa. School of Accounting Sciences, https://orcid.org/0000-0002-4881-0307
IIINorth-West University, South Africa. Technology Enhanced Learning and Innovative Education and Training (TELIT-SA), https://orcid.org/0000-0002-2090-4272
ABSTRACT
Questionnaires are widely used in the Accountancy field as a data collection instrument. However, previous studies have contentious views on the reliability of questionnaires in academic studies. This study describes the development of a custom-made questionnaire to evaluate the effectiveness of a teaching-learning intervention, the Audit Cube, designed to affect the knowledge, skills, attitudes and values of Auditing of B.Com. honours students in the Accountancy field at a SAICA-accredited university. The questionnaire was distributed to 156 university honours students, whereafter it was validated and standardised. Most of the extracted factors indicated a reliability level higher than 0.9, signifying that the constructs were suitable to address the project's research question and that the questionnaire is valid. In conclusion, this study found that the use of questionnaires in academic studies is deemed reliable if a standardised process is followed in its development. Consequently, the study suggests that custom-made questionnaires should undergo factor analysis to prove the instrument's validity prior to reporting on the findings. The findings of this study may be useful to academics in providing guidelines in developing their own data collection instrument to measure the effectiveness of a teaching-learning intervention and may also support the use of questionnaires by researchers in the teaching-learning environment.
Keywords: questionnaire, reliability, standardise, teaching-learning intervention, validate
INTRODUCTION
The B.Com. Chartered and Financial Accounting programmes have several core modules that form part of the qualification: Accounting, Auditing, Financial Management and Management Accounting, and Taxation. Auditing, specifically, consists of several phases which are all connected. The International Auditing Standards (ISA's) (IFAC 2019), which exceeds a thousand pages, provide the basis on which an audit should be conducted. These ISA's, as contained in the SAICA Student Handbook, form the foundation of the Auditing modules taught within these two programmes.
However, students struggle to master the content, apply the theory (including the ISA's, as well as Auditing textbooks), form a holistic understanding of the Auditing module, and comprehend the nexuses between all the topics. In order to address these identified gaps, a lecturer within the field of Auditing developed a tool, the Audit Cube, as a teaching-learning intervention. The Audit Cube was conceptualised using the Rubik's Cube design and incorporating a combination of gamification and infographics (Lamprecht 2017). The developer also combined the PSQ3R learning strategy by incorporating theoretical content within the ISA's as well as the step-by-step explanation of the audit process. The Audit Cube uses movement, colours, shapes, and diagrams with applicable references to the ISA's. One of the objectives of the Audit Cube is to enhance students' engagement by incorporating some principles for smart teaching from the books Student Engagement Techniques (Barkley 2010), as well as How Learning Works (Ambrose et al. 2010). Additional objectives include: increasing student motivation, developing their critical thinking and accommodating students' learning style preferences (which can be visual, auditory, and/or kinaesthetic learning styles (Vaishnav and Chirayu 2013, 1)). Therefore, the Audit Cube aimed to assist students' understanding of Auditing by easing the studying of the module through presenting them with the bigger picture and explaining the link between different phases of the audit process. The Audit Cube is also not as daunting as the ISA's, especially in the case where English is not the home language of students (which is the case for most of the university students where the study was undertaken, as only 4,4 per cent of the university's population speaks English as home language (Nudelman 2015, 67)). Consequently, the Audit Cube is a unique learning tool as it incorporates a variety of learning styles (both visual as well as kinaesthetic), requires no technology, and uses basic language that links to the Auditing body of knowledge.
Knowledge, skills, attitudes and values are considered to be the foundations of a curriculum. Limiting educational practices to pure transmission of knowledge amounts to deficient and decontextualized learning (Tedesco, Operrti, and Amadio 2014, 539; Pérez-Jorge, Medero, and Moli a-Fernández 2017, 113). Consequently, non-cognitive dimensions such as attitudes and values are integral in developing knowledge and skills, making the learning experience holistic (OECD 2019, 11). An individual's values predict attitudes, influencing decisions made, and ultimately the learning experience (Carrasco and Lucas 2015, 166; Mazana, Montero, and Casmir 2019; Grigoryan and Schwartz, 2021, 966). For this reason, this project investigates all four of these foundations.
To ascertain whether this intervention (Audit Cube) was effective, an instrument was required to capture students' perceptions pertaining to knowledge, skills, attitudes and values. For that reason, the following research question guided this project: How does the Audit Cube affect the development of knowledge, skills, attitudes and values of Auditing of B.Com. honours students in the Accountancy field at a SAICA-accredited university? As the Audit Cube was uniquely developed, no suitable research instrument was available to address the above-mentioned research question. The researchers subsequently conceptualised an instrument based on how to measure mathematics attitudes (Tapia and Marsh 2004) and expanded it with the management of open-book resources (Lamprecht 2011). This process resulted in a custom-made questionnaire, contributing towards a useful research instrument to measure the influence of a teaching-learning intervention.
The use of questionnaires to collect data has increased in popularity in the Accountancy research field (De Villiers 2010; Swart 2013; Stumke 2014; Modisane 2019). More specifically, researchers are turning to data collected from questionnaires to address and answer their Accountancy Education concerns and questions (Wally-Dima 2011; Theuri and Gunn 1998; Romney, Cherrington, and Denna 1996, 59-60). The use of questionnaires to collect data allows for the inclusion of only the pertinent variables for a specific study (Leedy and Ormrod 2010). This in turn leads to precise, tapered research questions that are formulated to be measured (Ivankova, Creswell, and Plano Clark 2007). Irrespective of its growing popularity, the reliability in the use of questionnaires is also disputed by many. Converse et al. (2008, 100), Ebert et al. (2018, 1), Saleh and Bista (2017, 64) and Sills and Song (2002, 22) point out that questionnaires can expect low response rates. Pradhan (1999, 41) indicates that questionnaires can, in some instances, have a 0 per cent response rate with Dey (1997, 215) and Fan and Yan (2010, 132) reporting a drop in the response rates among students. Taking this into account, questionnaires are not seen as the best data collection method.
In order to strengthen the findings and the main objective of this project, it was imperative to validate and standardise the custom-made questionnaire, which measures the effectiveness of the intervention (Audit Cube). The following will be described in the sections to follow: (i) research design and methodology of the study, and (ii) the fourteen stages of questionnaire development followed in the study.
RESEARCH DESIGN AND METHODOLOGY
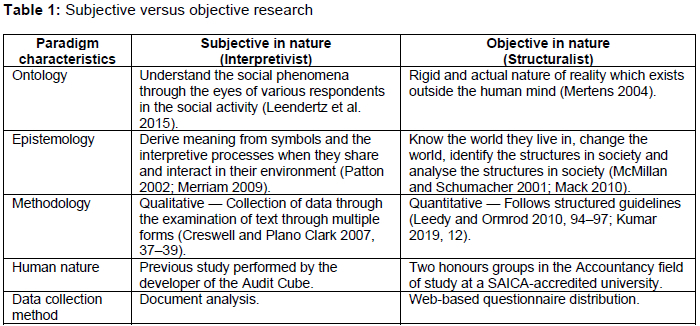
The research objective of the current study was to validate and standardise a custom-made questionnaire, developed to test the effectiveness of a teaching-learning intervention (Audit Cube). This research is objective in nature and therefore rooted in the structuralist paradigm. The research is underpinned on four assumptions: ontology, epistemology, methodology and human nature. Table 1 summarises these four assumptions, subjective versus objective, as well as the related data collection method.
Ontology refers to the world as we know it and what knowledge can be acquired (Burrell and Morgan 1979). The ontological assumption of the objectivist is to obtain the actual knowledge outside the human mind (Mertens 2004), and this is achieved through quantitative data collection strategies to obtain the perceptions of students on the Audit Cube and the use of the Audit Cube. The approach used to obtain the necessary information relevant to ontology and epistemology is known as methodology (Durrheim 2006, 6).
Characteristic to the quantitative research method is deductive reasoning (Babbie 2007, 46; Mentz 2014, 147) when concepts pertaining to a phenomenon are addressed objectively and relationships between these constructs are measured statistically. This study follows a non-experimental design since all the selected respondents will be measured on the pre-defined variables with no manipulation (Maree and Pietersen 2007, 152). This is deemed the most appropriate design since there is no experiment or comparison between two different groups (De Vos et al. 2018, 144). The data collection method used for the project was a questionnaire, which was custom-made to obtain the necessary data for analysis. Creswell et al. (2010, 155) and Mouton (2001, 103) argue that the collection of data using a questionnaire is the quantitative data collection instrument most often used in research. Recent research conducted by Modisane (2019, 97-98), Swart (2018, 211), and De Villiers (2015, 34) in the Accountancy field support the use of questionnaires for data collection.
Rattray and Jones (2007, 235) explain that the process followed in the development of a questionnaire should be discussed in as much detail as possible to ensure the effective report on data collected. In addition, De Vos et al. (2018, 190) argue that the information required for the study should be clear before a questionnaire is developed. This can be achieved through a literature study to obtain the main concepts of the information required (Grinnell and Unrau 2008, 110). Consequently, the custom-made questionnaire was developed based on a literature probe and research conducted when the Audit Cube was initially conceptualised. In developing the questionnaire, guidelines were followed to ensure that the process is valid (Grover and Vriens 2006, 84). This study followed the fourteen stages approach in questionnaire development, as outlined by Cohen, Manion, and Morrison (2011), and is set out in Table 2.
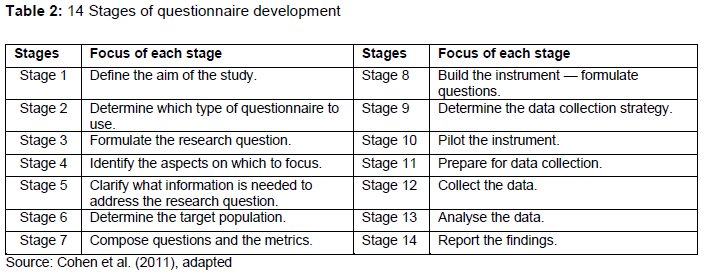
STAGES OF QUESTIONNAIRE DEVELOPMENT
The following sections discuss the 14 stages of questionnaire development and design as outlined by Cohen et al. (2011).
Stage 1: Define the aim of the study
Mentz (2014, 149) states that using a custom-made questionnaire enables the researcher to collect data to quantify and report on it statistically. Babbie (2016, 26), Grinnell and Unrau (2008, 106) and Salkind (2006, 99) argue that to quantify is to measure. This is achieved by assigning numbers to non-numerical data to represent them numerically. Babbie (2016, 26) states that when data are quantified it will be easier to combine, compare, and summarise. In an attempt to identify relationships between specific events or in describing the nature of the current circumstances, data can be collected from a multitude of respondents in the same setting through a questionnaire (Cohen et al. 2011). Consequently, the research question of the project was: How does the Audit Cube affect the development of knowledge, skills, attitudes and values of Auditing of B.Com. honours students in the Accountancy field at a SAICA-accredited university?
Stage 2: Determine which type of questionnaire to use
This study follows a structural non-experimental design (De Vos et al. 2018, 144) to measure the effectiveness of the Audit Cube as a teaching-learning intervention. This falls within the cross-sectional questionnaire type. Cross-sectional design collects data on the trends, attitudes and belief of respondents through a single data collection method (Creswell and Creswell 2018, 149; Kumar 2019, 172).
Stage 3: Formulate the research question
Before a questionnaire is developed, the required information to be obtained from the questionnaire should be clear (De Vos et al. 2018, 190). This can be achieved through examining literature relevant to the study (Grinnell and Unrau 2008, 110). Subsequently, and in line with the research question of the project, the aim of this questionnaire (divided into Parts A - F) was to: [1] measure the audit knowledge embedded in the Audit Cube (Part B), [2] measure the perceptions of students on how the Audit Cube assists in incorporating the ISA's with the knowledge in the textbooks through the use of different colours (Part C), [3] measure the perceptions of students on how the Audit Cube assists in incorporating the ISA's with the knowledge of the textbook in terms of studying the content (Part D), [4] measure the attitudes of students towards the general usefulness of Auditing (Part E), [5] enquire about the design features of the Audit Cube, and [6] request any suggestions to improve the Audit Cube experience (Part F). Part A considered information regarding personal and demographic information.
Taking this into account, the information required from the questionnaire was deduced from the literature on the management of open-book resources (Lamprecht 2011) and a questionnaire on the perceptions of students with regard to Mathematics (Tapia and Marsh 2004, 16). The questionnaire designed for this study was based on the perceptions students have of the use of the Audit Cube.
Stage 4: Identify the aspects on which to focus
The researchers examined the questionnaire and agreed on what they would like to report on for this study. Overall, three main themes emerged, [1] Audit knowledge (Part B), [2] Skills (Part C and D), and [3] Attitude and values (Parts E).
The researchers focussed on these themes due to observations that Auditing students tend to spend less time on the Auditing module due to their lack of understanding thereof, as well as the module's deep theoretical foundation. The expectation was that, with the development of the Audit Cube, students would be able to conceptualise the audit process as a whole, and the concepts and constructs would fit together in a more logical way. Ultimately, the aim of the Audit Cube was to assist students' understanding of Auditing by easing the studying of the module and the questionnaire was designed to measure its effectiveness.
Stage 5: Clarify what information is needed to address the research question
Neuman (2011) outlined the different categories of questions that should be posed which was used as a basis for the three focus areas identified in Stage 4. These categories include respondents' attitudes, beliefs or opinions, behaviour, characteristics, expectations, self-classification and knowledge. Subsequently, the three focus areas are grouped accordingly in Parts B to E of the questionnaire taking into account Neuman's question categories.
Stage 6: Determine the target population
It is seldom that an entire population can be tested (Yates 2004, 25), which is where a sample, providing similar information as the population, should be selected (Yates 2004, 25). Stoker (1985) provides a guideline for what sample size will be acceptable in a study. He concludes that if the population is 100, a response rate of 45 per cent (45 responses) will be acceptable. Similarly, if the population is 200, a response rate of 32 per cent (64 responses) will be acceptable. Financial Accountancy (FA) and Chartered Accountancy (CA) honours students were selected to partake in this study. Though the Auditing modules studied by these students are different, the FA honours is accredited as a bridging course towards the CA honours, and both group's Auditing modules are therefore based on the ISA's (the focus of the Audit Cube). The response rate is expected to be a representation of the two groups. Since this study focussed on the Audit Cube, which was only distributed to and used by 156 students (95 FA honours students and 61 CA honours students), these students were the population of this study. Based on Stoker's (1985) guidelines, a response rate of 52 will be acceptable. A total of 67 students completed the custom-made questionnaire.
Stage 7: Compose questions and the metrics
In developing a questionnaire, De Vos et al. (2018, 190-202) and Swart (2018, 212) outline certain considerations, which was applied to this study as follows:
• Questionnaire instructions: The questionnaire was accompanied by a brief, but specific introduction. The heading identified what the questionnaire is about, "Knowledge, Skill, Attitude & Values of Auditing with use of the Audit Cube". It further indicated that the questionnaire would not take more than 15 minutes to complete. Confidentiality was emphasised and the fact that participation in the questionnaire remained voluntary.
• Usable format for respondents: Monette, Sullivan, and DeJong (2002, 163) indicate that when all the question responses are known, the use of close-ended questions is appropriate. In fact, most researchers use the Likert scale for close-ended questions (Welman, Kruger, and Mitchell 2005, 174; Neuman, 2006, 207). Therefore, where this study aimed to measure the student's perceptions on the formulated questions by either disagreeing or agreeing to the close-ended questions, the responses were based on a Likert scale of four. The four options available avoided neutral responses and were: strongly disagree, disagree, agree, and strongly agree. In addition to the close-ended questions, open-ended questions avail respondents the opportunity to provide their views in their own words, which was added to the end of the questionnaire.
• General question format: Husser and Fernandez (2013, 1) explain that when making use of web-based questionnaires, the use of radio buttons will be the most appropriate answering option if a limited number of responses are available. Radio buttons were consequently applied in this questionnaire for the close-ended questions. Three open-ended questions were asked at the end where respondents could provide their thoughts on the benefits, adjustments and general perceptions of the Audit Cube.
The appearance of the questionnaire was influenced by the fact that it is web-based. Google Forms' web tool was used to design the questionnaire. An appropriate theme was selected for the intended sample group. As identified in the instructions of the questionnaire, the questionnaire time for completion was limited to 15 minutes. This is in line with Creswell et al.'s (2010, 158-68) argument that a questionnaire should not exceed 20 minutes. The estimated time was determined through conducting a pilot study prior to the circulation of the questionnaire and self-completion by the researchers.
• Ordering of questions in the questionnaire: Mouton (2011, 102-104) indicates that the sequence of questions should start with the general questions, then non-threatening questions followed by more sensitive and personal questions. This questionnaire started with general and non-threatening questions, being the demographics of the student (university attending (control question), student number (voluntary), age and gender, whether the student owned an Audit Cube, and race). This was followed by more sensitive questions, being the student's Auditing knowledge and how the Audit Cube influenced it. The next section of questions focussed on more specific skills based on everyday use of Auditing and studying Auditing. The more sensitive and personal questions followed when focus was placed on the student's attitude towards Auditing in the sense of usefulness in career and studies, Auditing in general, comfort level with Auditing content, benefits of the Audit Cube, Audit Cube perceptions, and negative perception(s) about Auditing. Lastly, three open-ended questions were asked to gain information on how students felt about the Audit Cube. All the questions that are similar in nature were grouped accordingly.
• Piloting the questionnaire: A group of academic trainees that were students in the two honours programmes the previous year were used to assess the clarity and structure of the questionnaire.
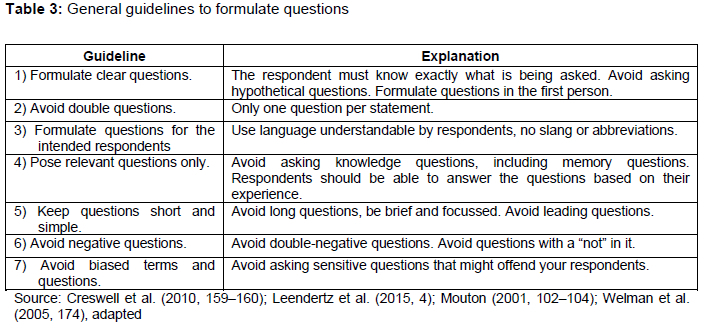
Stage 8: Build the instrument - formulate questions
Seven guidelines based on a literature review were followed in formulating the research questions (as set out in Table 3).
Part A: Personal and Demographic information
Part A mainly focussed on the personal and demographic information of the respondents. These questions included [1] university attending, [2] student number (voluntary) [3] age, [4] gender, [5] do you own your own Audit Cube, and [6] race. For all the questions, except Question 2, respondents could only select a single radio button as a response and all questions, except Question 2 was compulsory to complete.
Parts B-E: Knowledge, skills, and attitudes and values
Parts B to E entailed the answering of the students' knowledge, skills, and attitudes and values towards the use of the Audit Cube and Auditing in general. The statements posed were categorised under the first three main themes identified: [1] Auditing knowledge; [2] Skills -based on everyday use of Auditing and the studying of Auditing; [3] Attitude towards Auditing in the sense of usefulness in career and studies, Auditing in general, comfort level with Auditing content, benefits of the Audit Cube, Audit Cube perceptions, and negative perceptions about Auditing, as well as values based on open-ended questions on the best and worst features of the Audit Cube and any suggestions. For Parts B to E, respondents had the option of selecting their view of the posed statements within the different categories by selecting one of four options (1 = strongly disagree, 2 = disagree, 3 = agree and 4 = strongly agree) by means of a radio button.
Part B specifically focussed on the knowledge relating to Auditing using the Audit Cube: examining the benefit derived through the use of the Audit Cube and understanding the different Auditing concepts using the Audit Cube.
Part C focussed on the skills obtained or enhanced through using the Audit Cube in everyday studies. The assistance the Audit Cube provided in preparing for the open-book exam, where applicable, was also considered.
Part D examined the Auditing skill of the participant but focussed more on the benefits derived from the Audit Cube in studying Auditing for a test or an exam. Here the visual aspects of the Audit Cube and how it influences learning was investigated.
Part E focussed on the different attitudes of the respondents towards Auditing. Focus was placed on: [1] the usefulness of Auditing in your future career, [2] the usefulness of Auditing in studying your selected course, [3] Auditing in general, [4] comfort level with regard to Auditing content, [5] benefits of the Audit Cube, [6] general Audit Cube perceptions, and [7] negative perceptions about Auditing.
Part F: Best, worst and suggestions with regard to the Audit Cube
Part F was structured as open-ended questions that allowed respondents to voice their personal opinions with regard to the Audit Cube. Here any comment, positive or negative and any suggestions to improve the Audit Cube could be typed in.
Stage 9: Determine the data collection strategy
De Vos et al. (2018, 193) explain that the administration of the questionnaire will be influenced by its format. In this study, a web-based questionnaire was administered, which is considered to be the most appropriate method to distribute a questionnaire (Grinnell and Unrau 2008, 298).
Based on Fan and Yan (2010, 133), there are four steps when using web-based questionnaires as applied in this study:
• "Step 1 involves the development of the questionnaire. After developing the questions, it was uploaded onto the web.
• Step 2 relates to how respondents, for this study referred to as students, receive the relevant link or instructions to the questionnaire. Included here is how the students were selected to partake in the study, how they were contacted and how the link or instructions to the questionnaire was delivered. All FA and CA honours students received the link via an announcement on the learner management system.
• Step 3 concerns the completion of the questionnaire. Students logged into the web page to start the questionnaire, submitted their answers and logged out of the web page.
• Lastly, Step 4 entailed the downloading of the data by the researcher for analysis and interpretation." (De Vos et al. 2018, 190-202).
Stage 10: Pilot the instrument
De Vos et al. (2018, 195) argue that another essential part of using a questionnaire is performing a pilot study prior to the circulation thereof to the selected sample. Thus, the questionnaire was sent and completed to a group of academic trainees. This step ensured that any errors were identified and corrected, that all questions are clear and understood by the respondents, that the flow of the questionnaire is logical, and that the time to complete the questionnaire is sufficient (Modisane 2019, 105). After responses were received from the pilot group, minimal spelling errors and ambiguous questions were adjusted. The time to complete the questionnaire was confirmed to be 15 minutes.
Stage 11: Prepare for data collection
Ethical clearance was obtained prior to the distribution of the questionnaire from the university's ethics committee.
Stage 12: Collect the data
The circulation of the questionnaire was done by posting the relevant questionnaire link on the learner management system. A due date was also included to provide students with a time frame for completion. Students were informed in class and per the learner management system announcement that the questionnaire was available and that, by following the link provided, they could complete the questionnaire. Students were then re-directed to the questionnaire on Google Forms. A "next" button appeared at the end of the questionnaire. When students selected it, they received a message that their responses have been captured and thanked them for their participation.
Stage 13: Analyse the data
Google Forms provides a function where data are downloaded in Microsoft Excel format. The spreadsheet was outlaid per question, per student, and with timestamps when the student completed the questionnaire. North-West University Statistical Services analysed the data using several statistical procedures (descriptive statistics, factor analysis, and Cronbach's alpha).
Stage 14: Report the findings
The following sections will report the results from the statistical inferential conducted to: (i) give insight into the demographics of the respondents who completed the questionnaire, (ii) provide an overview on the respondents' knowledge, skills, attitudes and values towards the Audit Cube and (iii) validate the constructs of the questionnaire.
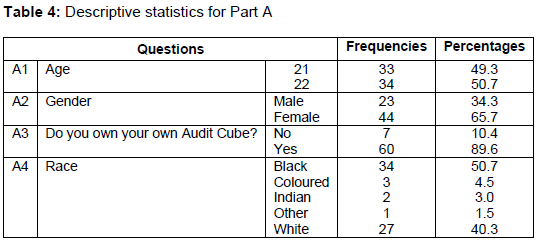
Part A: Personal and Demographic information
The personal and demographic information was set out by means of frequencies and percentages (Table 4). The age of the respondents corresponded to the general age of students in an honours programme. The female respondents (65.7%) were more than the male respondents (34.3%). Most of the respondents (89.6%) owned their own Audit Cubes, and where this was not the case, the Audit Cubes were made available to students during contact sessions, enabling all students to engage with the Audit Cube. The respondents were mainly Black (50.7%) or White (40.3%). This data aligns with the general student population's race, gender and age ratio distribution at the institution.
Part B to E: Knowledge, skills, and attitudes and values regarding the use of the Audit Cube
In order to validate the statistical inferential, the following statistical tests were conducted: (i) factor analysis to identify whether the construct which the related to knowledge, skills, and attitudes and values of the Audit Cube and (ii) construct validity through factor analysis were applied to group the questions of the questionnaire meaningfully. Construct validity validates the extent to which the questionnaire used in this research for data collection, corresponds with the theoretical context (Cohen et al. 2011; Neuman 2011) of the knowledge, skills and attitudes and values of Auditing. After factor analysis had been conducted on Parts B to E, a reliability test using Cronbach's Alpha was conducted to: (i) ascertain whether the extracted factors have an acceptable reliability level of at least 0.7, (ii) determine if the extracted frequencies were significant, and (iii) if the questions within the questionnaire were valid. This study used representative reliability to ensure that the data and findings were suitable, predictable, reliable and replicable, and to minimise the external sources of variation in the data (excluding acute answers from the data analysis) (Cohen et al. 2011; Neuman 2011). For the Alpha coefficient, the following categories applied to this factor analysis: > 0.90: very highly reliable, 0.80-0.90: highly reliable, 0.70-0.79: reliable, 0.60-0.69: marginally reliable, < 0.60: low reliability (Cohen, Manion, and Morrison 2017). All the extracted factors showed very high reliability (above 0.90).
Factor analysis: Knowledge-based questions of the Audit Cube (Part B)
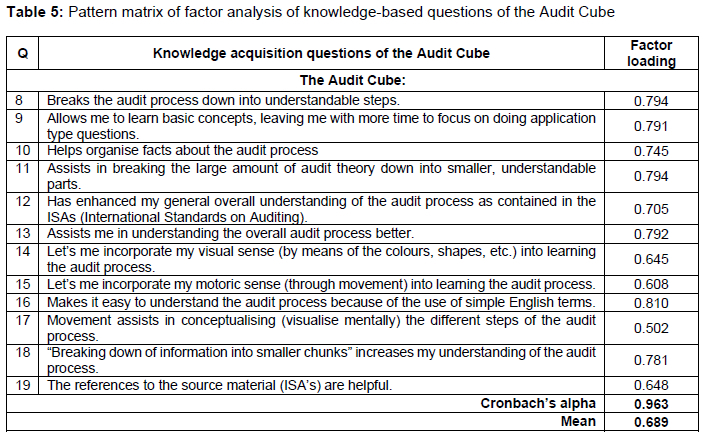
The Kaiser Meyer Olkin (KMO) measure of 0.929 indicated adequate data for factor analysis with a total variance of 72 per cent. One factor was extracted for the knowledge-based questions of the Audit Cube. Communalities varied from 50 per cent to 82 per cent. None of the items included for the knowledge-based items of the Audit Cube were extracted from the questionnaire. This indicates that the knowledge acquisition items embedded in the Audit Cube were valid. Table 5 summarises the statistical data as reported on.
Students pointed out that the Audit Cube assisted greatly with knowledge acquisition, through increasing understanding and organisation of the vast amounts of information. The incorporation of different learning styles (visual and kinaesthetic) also assists students with knowledge acquisition. This is in line with Mahmoud, Ahmed, and Ibrahim (2019, 12), who encouraged the use of various learning styles to enhance effectivity, flexibility and resourcefulness in individuals, enabling them to profit from a wide variety of learning opportunities.
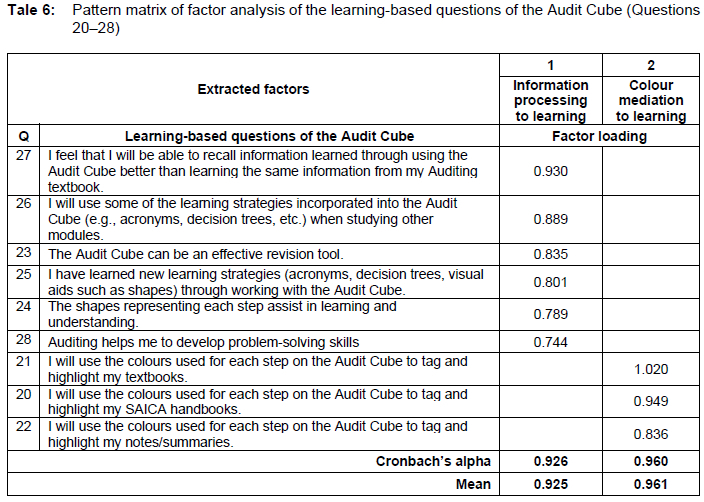
Factor analysis: Learning-based questions of the questionnaire
The KMO measure of 0.733 indicated adequate data for factor analysis with a total variance of 62 per cent. Two factors were extracted of the questions pertaining to learning: (i) information processing to learning and (ii) colour mediation to learning.
The students indicated that the Audit Cube assists them to process the information of the subject through various processes - understanding, recalling information, summarising and problem-solving. Furthermore, the students confirmed that the use of colour in the Audit Cube mediates information processing. This is substantiated with colour psychology as previous research found that colour may have valuable connotations and can influence people's understanding (Elliot and Maier 2014, 95) and emotions (Valdez and Mehrabian 1994).
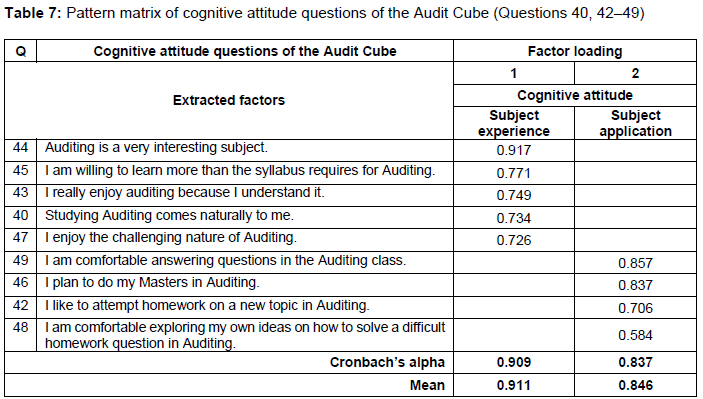
Factor analysis: Attitudes and values-based questions of the questionnaire
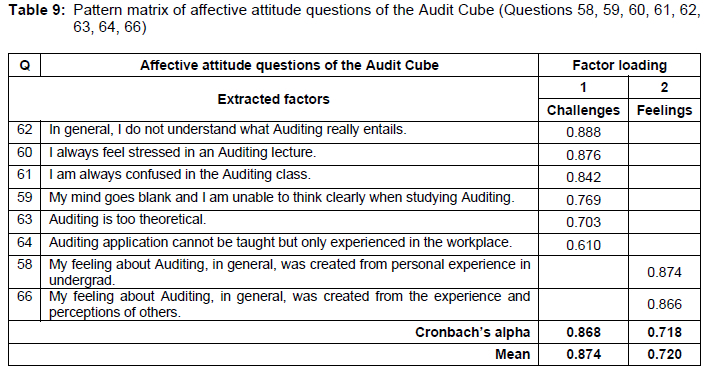
Five factors were extracted which related to the attitudes and values of students towards the Audit Cube. The first two factors (subject experience and subject application) related to cognitive aspects of attitude (Table 7). The third factor related to the student's personal experience (Table 8), and finally, challenges and feelings (the fourth and fifth factors) are set out in Table 9.
Two factors related to the cognitive aspects of attitude. The KMO measure of 0.876 indicated adequate data for factor analysis with a total variance of 70 per cent. Factor 1 (subject experience) focuses on students' attitude pertaining to the experience of the module, whereas Factor 2 (subject application) relates to students' attitude towards the application of the subject. Some of the items had a factor loading of <0.5 and were excluded from the questionnaire (such as questions 29-39 and question 41).
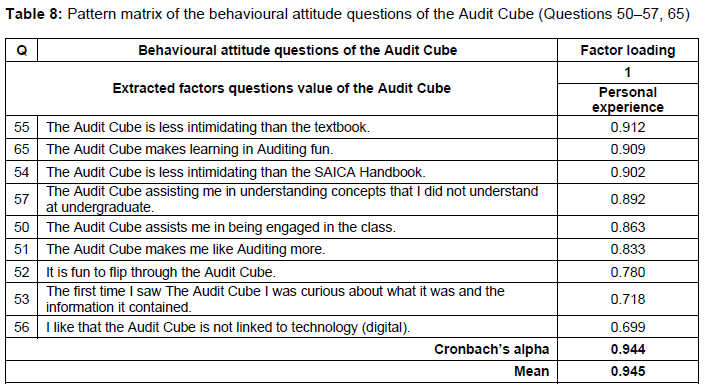
The KMO measure of 0.893 indicated adequate data for factor analysis with a total variance of 60 per cent. Factor 1 (personal experience) relates to the behavioural attitude of students as they engage with the content and format of the Audit Cube. Although few students indicated their intention of furthering their Auditing studies subsequent to their honours degree, students' cognitive attitude towards the module was generally positive, which enhances learning. It has been found that attitudes affect individuals' decisions (Carrasco and Lucas 2015, 166) and therefore learning and performance (Mazana et al. 2019). The researchers highlighted that measuring cognitive attitude is difficult to measure through quantitative measures and should be explored through subjective engagement with the participants. However, even though the majority of students indicated that they were willing to learn more than the Auditing syllabus requires, found the module interesting, enjoyed the challenging nature of the module, and enjoyed attempting homework, the descriptive statistics ranged between 58 per cent and 64 per cent, indicating that a large part of the population's attitude toward the Auditing module was not ideal. The findings of the questions contained in Table 8 does however indicate that the Audit Cube address this to some extent.
Although only 57 per cent of students indicated that the Audit Cube made students like the Auditing module more, students were positive that it made the learning thereof fun (75%). Students found the simple design of the Audit Cube to be user-friendly, while increasing class engagement and fun, which will lead to an improved attitude towards Auditing. This is due to affect, behaviour and cognition being prevalent components in forming an individual's attitude (Breckler, 1984, 1191).
The KMO measure of 0.758 indicated adequate data for factor analysis with a total variance of 48 per cent. Factor 1 (challenges) focuses on the students' affective attitude pertaining to the challenges they experience of the subject at university level as well as within the workplace, whereas Factor 2 (feelings) relates to the students' personal experience in their undergraduate and during their engagement with their peers. When students experience challenges when engaging with particular content, they will become despondent and have a negative attitude towards that outcome, which in turn will influence their attitude and learning.
Twenty per cent of students indicated that they do not understand what Auditing really entails, but students also indicated that the Audit Cube assists with understanding (descriptive statistics from Table 5's questions that relate to understanding ranged from 81% to 91%). Most students' feeling about auditing was influenced by personal experience undergrad (80%) and from the experience and perceptions of others (54%). Sixty per cent of students were of the opinion that the module is too theoretical, but that the Audit Cube assisted to break the large amount of theory down into smaller, understandable chunks (89% - Question 12 from Table 5). However, students generally did not have a negative affective attitude around Auditing, which would contribute to meaningful learning (Mazana et al. 2019).
CONCLUSION
Questionnaires are commonly used as an instrument in measuring the effectiveness of teaching-learning interventions, despite some researchers' concerns relating to the reliability thereof. By following a standardised process of 14 stages, the current study's researchers developed, validated and standardised a questionnaire to measure the affect of the Audit Cube on the knowledge, skills, attitudes and values of Auditing of B.Com. honours students in the Accountancy field at a SAICA-accredited university. The questionnaire provided a foundation to ascertain whether the core curriculum aspects, knowledge, skills, values and attitudes were measured when utilising the Audit Cube. Furthermore, the researchers realised that for a deeper understanding of aspects relating to values and attitudes, subjective approaches to data collection should be included.
The factor analysis conducted extracted factors with very high reliability (>0.9), emphasising the significance of the analysis. This study, therefore, encourages researchers using custom-made questionnaires to undergo factor analysis to prove the instrument's validity prior to reporting on the findings of the questionnaire. Such a validation and standardisation process enhance the credibility of data collected from a questionnaire.
This study may be beneficial to academics in providing guidelines in developing their own questionnaire to measure the effectiveness of a teaching-learning intervention and may support the use of questionnaires by researchers to measure whether the intend of developing the artefact was worthwhile.
Since this project only focussed on the development, validation and standardisation measuring of an Auditing teaching-learning intervention, further research can be conducted on the reliability of questionnaires on teaching-learning interventions of other core Accountancy modules. In order to expand on the results of the study, some structured interviews could be conducted to substantiate the results of the quantitative data (Carrasco and Lucas 2015) as this was evident when the researchers conducted correlation analysis and found only one practically significant relationship with the factors and the mediation of colour for learning, which was not included in this article.
REFERENCES
Ambrose, S. A., M. W. Bridges, M. DiPietro, M. C. Lovett, and M. K. Norman. 2010. How learning works: Seven research-based principles for smart teaching. John Wiley & Sons. [ Links ]
Babbie, E. 2007. The practice of social research. 11th Edition. Belmont: Thomson Wadsworth. [ Links ]
Babbie, E. R. 2016. The practice of social research. 14th Edition. Boston, USA: Cengage Learning. [ Links ]
Barkley, E. F. 2010. Student engagement techniques: A handbook for college faculty. San Francisco: Jossey-Bass. [ Links ]
Breckler, S. J. 1984. "Empirical validation of affect, behavior, and cognition as distinct components of attitude." Journal of Personality and Social Psychology 47(6): 1191-1205. [ Links ]
Burrell, G. and G. Morgan. 1979. Sociological paradigms and organisational analysis. Brookfield, VT: Ashgate. [ Links ]
Carrasco, J. and K. Lucas. 2015. "Workshop synthesis: Measuring attitudes; quantitative and qualitative methods." Transportation Research Procedia 11: 165-171. [ Links ]
Cohen, L., L. Manion, and K. Morrison. 2011. Research methods in education. 7th Edition. London: Routledge. [ Links ]
Cohen, L., L. Manion, and K. Morrison. 2017. Research methods in education. 8th Edition. Routledge. [ Links ]
Converse, P. D., E. W. Wolfe, X. Huang, and F. L. Oswald. 2008. "Response rates for mixed-mode surveys using mail and e-mail/web." American Journal of Evaluation 29(1): 99-107. [ Links ]
Creswell, J. W. and J. D. Creswell. 2018. Research design: Qualitative, quantitative and mixed methods approaches. 5th Edition. California: SAGE Edge. [ Links ]
Creswell, J.W., L. Ebersohn, I. Eloff, R. Ferreira, N. V. Ivankova, J. D. Jansen, J. Nieuwenhuis, et al. 2010. First steps in research. 4th Edition. Pretoria: Van Schaik Publishers. [ Links ]
Creswell, J. W. and V. L. Plano Clark. 2007. Designing and conducting mixed methods research. California: SAGE Publications Ltd. [ Links ]
De Villiers, R. 2010. "The incorporation of soft skills into accounting curricula: Preparing accounting graduates for their unpredictable futures." Meditari: Research Journal of the School of Accounting Sciences 18(2): 1 -22. [ Links ]
De Villiers, R. R. 2015. "Evaluating the effectiveness of a newly developed simulation in audit education." North-West University Potchefstroom, South Africa. [ Links ]
De Vos, A. S., H. Strydom, C. B. Fouché, and C. S. L. Delport. 2018. Research at grass roots: For the social science and human services profession. 4th Edition. Pretoria: Van Schaik Publishers. [ Links ]
Dey, E. L. 1997. "Working with low survey response rates: The efficacy of weighting adjustments." Research in Higher Education 38(2): 215-227. [ Links ]
Durrheim, K. 2006. "Research design." In Research in practice: Applied methods for social sciences, ed. M. Terre Blanche, K. Durrheim, and D. Painter, 33-59. Cape Town: UCT. [ Links ]
Ebert, J. F., L. Huibers, B. Christensen, and M. B. Christensen. 2018. "Or web-based questionnaire invitations as a method for data collection: Cross-sectional comparative study of differences in response rate, completeness of data, and financial cost." Journal of Medical Internet Research 20(1): 1 -13. [ Links ]
Elliot, A. J. and M. A. Maier. 2014. "Color psychology: Effects of perceiving color on psychological functioning in humans." Annual Review of Psychology 65: 95-120. [ Links ]
Fan, W. and Z. Yan. 2010. "Factors affecting response rates of the web survey: A systematic review." Computers in Human Behavior 26(2): 132-139. [ Links ]
Grigoryan, L. and S. H. Schwartz. 2021. "Values and attitudes towards cultural diversity: Exploring alternative moderators of the value-attitude link." Group Processes & Intergroup Relations 24(6): 966-981. [ Links ]
Grinnell, R. M. and Y. A. Unrau. 2008. Social work research and evaluation: Foundations of evidence-based practice. New York: Oxford University Press. [ Links ]
Grover, R. and M. Vriens. 2006. The handbook of marketing research: Uses, misuses, and future advances. United Kingdom: SAGE Publications Inc. [ Links ]
Husser, J. A. and K. E. Fernandez. 2013. "To click, type, or drag? Evaluating speed of survey data input methods." Survey Practice 6(2): 1-7. [ Links ]
IFAC. 2019. SAICA Student Handbook 2019/2020. South Africa: LexisNexis. [ Links ]
Ivankova, N. V., J. W. Creswell, and V. L. Plano Clark. 2007. "Foundations and approaches to mixed methods research." In First steps in research, ed. K. Maree. Pretoria: Van Schaik. [ Links ]
Kumar, R. 2019. Research methodology. 5th Edition. United Kingdom: SAGE Publications. [ Links ]
Lamprecht, J. 2011. "The effective management of resource material in open-book assessment by accounting honnours students in Auditing." Mini-dissertation, University of the Free State, Bloemfontein. [ Links ]
Lamprecht, J. 2017. Audit Cube. South Africa. [ Links ]
Leedy, P. D. and J. E. Ormrod. 2010. Practical research. 9th Edition. Upper Saddle River: Merrill. [ Links ]
Leendertz, V., A. S. Blignaut, S. Ellis, and H. D. Nieuwoud. 2015. "The development, validation and standardisation of a questionnaire for ICT professional development of mathematics teachers." pythagoras 36(2): 1 -11. [ Links ]
Mack, L. 2010. "The philosophical underpinnings of educational research." Polyglossia 19: 1-7. [ Links ]
Mahmoud, H. G., K. E. Ahmed, and E. A. Ibrahim. 2019. "Learning styles and learning approaches of bachelor nursing students and its relation to their achievement." International Journal of Nursing Didactics 9(03): 11-20. [ Links ]
Maree, K. and J. Pietersen. 2007. The quantitative research process. Pretoria: Van Schaik. [ Links ]
Mazana, M. Y., C. S. Montero, and R. O. Casmir. 2019. "Investigating students' attitude towards learning mathematics." International Electronic Journal of Mathematics Education 14(1): 207231. [ Links ]
McMillan, J. H. and S. Schumacher. 2001. Research in education: A conceptual introduction. 5th Edition. New York: Addison Wesley Longman. [ Links ]
Mentz, M. 2014. "An integrated audit evidence planning model to quantify the extent of audit evidence." Doctor's thesis, University of South Africa, Pretoria. http://hdl.handle.net/10500/18477. [ Links ]
Merriam, S. B. 2009. Qualitative research: A guide to design and implementation. 2nd Edition. San Francisco: Jossey-Bass. [ Links ]
Mertens, D. M. 2004. Research and evaluation in education and psychology: Integrating diversity with quantitative, qualitative, and mixed methods. 4th Edition. Thousand Oaks: SAGE Publications Ltd. [ Links ]
Modisane, T. C. 2019. "Establishing a competency framework for the integration of workplace Information Technology knowledge and skills within an Internal Audit education programme and training." North-West University (South Africa). Vanderbijlpark Campus. [ Links ]
Monette, D. R., T. J. Sullivan, and D. R. DeJong. 2002. Applied social research: Tool for the human services. 5th Edition. Orlando: Harcourt College. [ Links ]
Mouton, J. 2001. How to succeed in your Master's and Doctoral studies. A South African guide and resource book. Pretoria: Van Schaik Publishers. [ Links ]
Mouton, J. 2011. How to succeed in your master's and doctoral studies: A South African guide and resource book. 11th Edition. Pretoria: Van Schaik. [ Links ]
Neuman, W. L. 2006. Social research methods: Qualitative and quantitative approaches. 6th Edition. Boston: Pearson Education Inc. [ Links ]
Neuman, W. L. 2011. Social research methods: Qualitative and quantitative approaches. 7th Edition. Boston: Pearson Education Inc. [ Links ]
Nudelman, C. 2015. "Language in South Africa's higher education transformation: A study of language policies at four universities." University of Cape Town. [ Links ]
OECD see Organisation for Economic Co-operation and Development. [ Links ]
Organisation for Economic Co-operation and Development. 2019. "OECD future of education and skills 2030 Concept Note." https://www.oecd.org/education/2030-project/teaching-and-learning/learning/attitudes-and-values/Attitudes_and_Values_for_2030_concept_note.pdf. (Accessed 17 November 2021). [ Links ]
Patton, M. Q. 2002. Qualitative research and evaluation methods. Thousand Oaks. 3rd Edition. California: SAGE Publications Ltd. [ Links ]
Pérez-Jorge, D., F. B. Medero, and E. Molina-Fernández. 2017. "A study of educational programmes that promote attitude change and values education in Spain." Asian Social Science 13(7): 112130. [ Links ]
Pradhan, K. 1999. "The internet in Nepal: A survey report." The International Information & Library Review 31(1): 41-47. [ Links ]
Rattray, J. R. and M. C. Jones. 2007. "Essential elements of questionnaire design and development." Journal of Clinical Nursing 16(2): 234-243. [ Links ]
Romney, M. B., J. O. Cherrington, and E. L. Denna. 1996. "Using information systems as a basis for teaching accounting." Journal of Accounting Education 14(1): 57-67. https://doi.org/10.1016/0748-5751(95)00030-5. [ Links ]
Saleh, A. and K. Bista. 2017. "Examining factors impacting online survey response rates in educational research: Perceptions of graduate students." Online Submission 13(2): 63-74. [ Links ]
Salkind, N. J. 2006. Exploring research. 6th Edition. New Jersey: Pearson Education. [ Links ]
Sills, S. J. and C. Song. 2002. "Innovations in survey research: An application of web-based surveys." Social Science Computer Review 20(1): 22-30. [ Links ]
Stoker, D. J. 1985. Sampling: Personal communication to the author. Pretoria: Human Sciences Research Council. [ Links ]
Stumke, O. 2014. "Bridging the expectation gap of IT competencies between accountancy trainees, SAICA and employers." Dissertation, North-West University. [ Links ]
Swart, J. J. 2013. "Audit materiality and risk: Benchmarks and the impact on the audit process." Dissertation, North-West University. [ Links ]
Swart, J. J. 2018. "Audit methodologies: Developing an integrated planning model incorporating audit materiality, risk and sampling." PhD. North-West University. [ Links ]
Tapia, M. and G. E. Marsh. 2004. "An instrument to measure mathematics attitudes." Academic Exchange Quarterly 8(2): 16-22. [ Links ]
Tedesco, J. C., R. Opertti, and M. Amadio. 2014. "The curriculum debate: Why it is important today." Prospects 44: 527-546. [ Links ]
Theuri, P. M. and R. Gunn. 1998. "Accounting information systems course structure and employer systems skills expectations." Journal of Accounting Education 16(1): 101-121. https://doi.org/10.1016/S0748-5751(98)00005-0. [ Links ]
Vaishnav, R. S. and K. Chirayu. 2013. "Learning style and academic achievement of secondary school students." Voice of Research 1(4): 1-4. [ Links ]
Valdez, P. and A. Mehrabian. 1994. "Effects of color on emotions." Journal of Experimental Psychology: General 123(4): 394. [ Links ]
Wally-Dima, L. 2011. "Bridging the gap between accounting education and accounting practice: The case of the University of Botswana." IUP Journal of Accounting Research & Audit Practices 10(4): 7. [ Links ]
Welman, C., F. Kruger, and B. Mitchell. 2005. Research methodology. 3rd Edition. Cape Town: Oxford University Press. [ Links ]
Yates, S. J. 2004. Doing social science research. London: SAGE Publications Ltd. [ Links ]

