


Services on Demand
Article
 English (pdf)
 Article in xml format
 Article references
Indicators

Related links
-
 Cited by Google
 -
 Similars in Google
Share

 Permalink
South African Journal of Higher Education
On-line version ISSN 1753-5913
S. Afr. J. High. Educ. vol.36 n.5 Stellenbosch Nov. 2022
http://dx.doi.org/10.20853/36-5-4784
GENERAL ARTICLES
Exploring the alignment of first-year summative assessments with Bloom's Taxonomy: a longitudinal study
K. dos ReisI; C. SwanepoelII; D. YuIII; F. AncianoIV
IUniversity of the Western Cape Cape Town, South Africa. Dos Reis and Venter Education Associates, Cape Town, South Africa. https://orcid.orq/0000-0003-4625-6004
IIUniversity of the Western Cape Cape Town, South Africa. Department of Economics. https://orcid.org/0000-0003-0906-8995
IIIUniversity of the Western Cape Cape Town, South Africa. Department of Economics. https://orcid.org/0000-0001-9813-7897
IVUniversity of the Western Cape Cape Town, South Africa. Department of Political Studies. https://orcid.org/0000-0002-8613-1452
ABSTRACT
The correlation between the level of difficulty of assessments, Bloom's Taxonomy as well as pass rates of courses has been a seriously under-researched area in South Africa. In this study, we proposed the revised Bloom's taxonomy level of difficulty index, before we examined 112 first-year 2017-2019 final and supplementary assessment papers from the Economic and Management Sciences Faculty of a university in Western Cape.
The descriptive statistics showed that these assessment papers are different in terms of duration, total marks, type of questions asked as well as pass rates. It was also found that these first-year summative assessments asked questions mainly at levels two (understand) and three (apply) of the revised Bloom's Taxonomy. In addition, the correlation and econometric analysis did not find a strong correlation between the level of difficulty index and pass rates. Nonetheless, the above-mentioned results need to be interpreted with great caution, because strictly speaking, one should also control for differences in other characteristics (e.g., students' personal characteristics, school characteristics and lecture attendance).
To conclude, there is no explicit national policy that guides higher education institutions (HEIs) on how to use Bloom's or any other taxonomy to assess students at the appropriate National Qualifications Framework (NQF) level. Hence, our findings suggest that there is a need for a national assessment policy framework to guide HEIs on how to assess undergraduate students at different cognitive levels as required by the NQF.
Keywords: Revised Bloom's Taxonomy, assessment, undergraduate first-year studies
INTRODUCTION
The quality of assessments is pertinent to student success at all higher education institutions. Written assessments are regarded as the most reliable method of testing students in higher education across the globe (Jabbar and Omar 2015). However, internal coherence, appropriate progression and alignment of assessments with the relevant National Qualifications Framework (NQF) level remain underexplored and contentious issues. While there is a wealth of studies on assessments in higher education, there is a major gap in researching how first-year summative assessments align with cognitive levels such as those codified in Bloom's Taxonomy.
Multiple types of assessments are used to establish students' understanding of the knowledge and skills required of a module taught over a semester or an academic year. It is also common practice in higher education to use "sit down" assessment (examinations), particularly when conducting summative assessments (Omar et al. 2012). Hence, written formal assessments are used as a medium for academics to establish if students have obtained the knowledge and comprehension of what was taught. In addition to this, academics are also able to assess to what extent students can apply the theory in a given situation (Jabbar and Omar 2015).
In South Africa, final examinations are written in high schools. According to the South African Qualifications Authority (SAQA 2012), all accredited higher education institutions of learning degree programmes need to be offered in compliance with the NQF, which stipulates that assessments should be done to nurture high-level cognitive skills in an integrated manner (SAQA 2012). Therefore, assessment standards must line up with the appropriate NQF level. In our proposed study the focus will be on undergraduate first-year modules, meaning that NQF level 5 needs to be adhered to.
Mawa, Haque, and Ali (2019) argue that while there is a strong emphasis on the effective assessment of learning in higher education, most academics do not have the required knowledge and skills to know what constitutes effective assessment practices in higher education or apply such knowledge. The challenge for academics with little or no skills in assessment lies not only in professionally crafting questions in suitable language but also aligning them with the appropriate NQF level (Jabbar and Omar 2015). In some cases, the same examination questions are repeated over several years and in other cases, questions are poorly formulated. Moreover, the proper sequencing of complexity across an academic programme from the first year to the final year is often not clearly reflected in examination papers. This challenge is further exacerbated when good-quality question papers that test critical thinking are explicitly required.
Tremblay, Lalancette, and Roseveare (2012) assert that questions in assessments should be posed across all cognitive levels to distinguish between the average, above-average and excellent students. While Weir and Roberts (1994) argue that assessments that are of good standard will produce samples of students' abilities in any subject, a concern highlighted by Ontong and Bruwer (2020) is that higher education institutions are developing students with rote knowledge often by using previous academics years' assessments. Kembo's research shows that in some cases academics expect students at undergraduate level to provide word-for-word replication of lecture notes. If this is how students are trained to respond, then they will not be trained to think critically (Kembo 2020).
A recent document on student success at a South African university (UWC 2019) noted that "significant structural challenges exist in relation to curriculum; not only have some curricula remained unchanged for a decade and more, but that academic staff who ought to be leading curriculum innovation often do not have the skills and tools required to do so, which in itself goes far in explaining the lack of changes to curricula. In addition, there is a distinct lack of alignment between what is taught and what and how learning is assessed". The document further notes "curriculum incoherence" and suggests we engage in regular review of modules, curricula, programmes, departments and other entities. Curriculum rules and policies must be guided by robust review and evaluation processes, which are regularly interrogated and renewed. The document does not reflect on the integrity, quality and nature of actual assessments at this tertiary institution.
While examination papers are moderated (internally and externally) and signed off by the departmental chairpersons, school directors, as well as internal and external moderators, there has not been a comprehensive look at the fundamental quality and internal integrity of exam papers at the South African tertiary institutions. Given that summative assessments count substantially towards student success, and anecdotal evidence suggest that there may be significant poor practices in setting exams. Exam questions are meant to be well-formulated, grammatically sound, comprehensible, weighted appropriately and at the appropriate level. Ideally, the exam paper should "stretch" students and not merely test for memory. Exam questions need to be changed every year.
It is against this background that this study aims to explore how first-year summative assessments of degrees offered at a university in the Western Cape province, in the Economic and Management Sciences (EMS) faculty meet basic criteria and align with Bloom's Taxonomy and whether papers are set to the appropriate NQF level. Firstly, this study will evaluate question papers from 2017-2019 with the objective to ascertain the cognitive levels of each question using Bloom's Taxonomy. Secondly, we sought to understand the cognitive level percentages allocated to each question paper to make a comparison of the standard of assessing first-year students over a three-year period across all modules. Assessment questions are analysed and each question is given a category based on the Bloom's taxonomy cognitive level. In this article, we use Anderson et al. (2001)'s revised Bloom's Taxonomy, to illuminate the standard of assessing students across all degree programmes offered in the EMS Faculty.
This research study could help to establish greater awareness of the importance of critical and analytical thinking as a graduate attribute and promote a more structured and graduated standard for setting summative assessments aligned to the appropriate NQF cognitive level.
RESEARCH QUESTIONS
This study evaluates first-year summative assessments written from 2017-2019 (three academic years). We also examine the extent to which papers are replicated from year to year. A guide from the list of verbs used in Anderson's (revision of Bloom) is used to analyse the questions and descriptive statistics are used to describe the trends in testing for each year.
This study poses three research questions, firstly, at what levels of Bloom's Taxonomy are academics posing questions in summative assessments in first-year EMS modules? Secondly, to what extent are the cognitive levels assessed across all first-year modules of a similar standard, with reference to Bloom's revised Taxonomy? Thirdly, is there a correlation between pass rates and levels of Bloom's Taxonomy at which summative assessment questions are posed?
CONCEPTUAL FRAMEWORK
The original Bloom's Taxonomy was revised in 2001 to incorporate conceptual advancements in education that had taken place since 1956 (Anderson et al. 2001). Unlike the original Bloom's taxonomy, the revised Bloom's Taxonomy is presented as a two-dimensional framework with knowledge and cognitive dimensions (Anderson et al. 2001, 4). An objective usually contains a verb and a noun (Anderson et al. 2001, 4). The noun refers to the knowledge that should be acquired by the student (the subject matter) and the verb is the action that is required (what should be done with the subject matter) and thus refers to the cognitive process (Anderson et al. 2001, 4; Krathwohl 2002, 213). The Knowledge Dimension encompasses four main types (Anderson et al. 2001):
• Factual Knowledge is described as discrete facts, elements and terms with which students must be acquainted. It comprises knowledge of terminologies and precise details and elements. Examples include diverse business concepts.
• Conceptual knowledge dwells more on the inter-relationships among variables/basic knowledge elements and larger structures, rather than discrete information. It encompasses knowledge of classifications and categories, principles and generalizations, and theories, models, and structures. Examples comprise various accounting concepts.
• Procedural knowledge is the knowledge of how to do things relating to methods, techniques, and processes. It includes knowledge of subject specific skills and algorithms; subject-specific techniques and methods, and criteria for determining when to use appropriate procedures. Examples would include journal entries, financial statements, and ledger accounts.
• Meta-cognitive knowledge is described as general cognition as well as self-cognition, including contextual and provisional knowledge.
The Cognitive Process Dimension comprises six reasoning processes (Anderson et al. 2001):
• At the first level, Remember, is described as the ability to retrieve information from long-term memory via recall and recognition. An example could include listing the characteristics of a sole proprietor.
• The second level, Understand, entails making meaning of relevant communication in any format through interpreting, exemplifying, classifying, summarising, inferring, comparing, or explaining. At this level, for example, students could be required to explain the objectives of a particular business entity.
• The third level, Apply, involves the use of previously acquired learning in a different situation which could be familiar/routine (execute) or unfamiliar (implement). An example would be drawing a supply and demand graph related to Economics.
• The fourth level, Analyse, describes the ability to break-down information, find relationships between different parts and determine how the parts fit into a whole. It comprises of differentiating, organising, and attributing. Analysing a case study would fall into this category.
• The fifth level, Evaluate, entails making discernment based on criteria which could be internal (i.e., checking) or external (i.e., critiquing). An example includes advising an entrepreneur on choosing an appropriate business entity.
• The final level, Create, involves combining elements to make something new or novel, sub-categorised as generating, planning, and producing. For example, if students develop a business plan according to the needs of the consumer market could fall under this category.
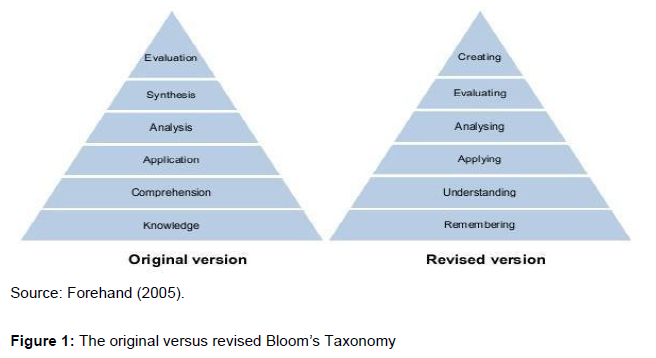
The cognitive dimension still has the six categories of the original taxonomy. However, the terminology was changed from nouns to verbs and the top two levels were exchanged. The term "knowledge" in the lowest level was also renamed "remembering" (Forehand 2005; Krathwohl 2002, 214), while "comprehension" was renamed "understanding" (Krathwohl 2002, 214). "Synthesis", which changed places with "evaluation", was renamed "creating" (Krathwohl 2002, 214). The two versions are illustrated in Figure 1.
NQF LEVEL FIVE AND BLOOM'S REVISED TAXONOMY
Many elements of the revised Bloom's taxonomy are present in the requirement for students to achieve NQF level 5 (the level associated with first-year at a university). There are ten indicators in NQF level 5 which we shall draw to show the overlap between these and Bloom's taxonomy. First, NQF level 5 indicators require students to obtain knowledge literacy, and be able to demonstrate the awareness of how knowledge or a knowledge system develops and evolves within their area of study. Drawing on this scope of knowledge, a learner should then be able to "demonstrate an informed understanding of the core areas of one or more fields, disciplines or practices, and an informed understanding of the key terms, concepts, facts, general principles, rules and theories of that field, discipline or practice" (SAQA 2012, 8).
Once understanding is attained a student should be able to demonstrate the ability to select and apply standard methods, procedures or techniques within the field, discipline or practice, as well as plan and manage an implementation process within a structured and supportive environment. Learners must also use problem solving to demonstrate the ability to "identify, evaluate and solve defined, routine and new problems within a familiar context, and to apply solutions based on relevant evidence and procedures or other forms of explanation appropriate to the field, discipline or practice, demonstrating an understanding of the consequences" (SAQA 2012, 8).
NQF level 5 further requires learners to access, process and manage information, in order to "demonstrate the ability to gather information from a range of sources, including oral, written or symbolic texts, to select information appropriate to the task, and to apply basic processes of analysis, synthesis and evaluation on that information" (SAQA 2012, 8). Thus, NQF level five supports the first five levels of Bloom's revised taxonomy and does not require students to "create". It also places less emphasis on evaluating and analysing and more focus on knowledge attainment and understanding.
DATA AND METHODS
At the EMS Faculty of the university under study, six full-time undergraduate programs are offered, namely Bachelor of Administration (BAdmin), Bachelor of Commerce (BCom), BCom Extended Curriculum Program (ECP), BCom Financial Accounting, BCom Accounting and BCom Accounting ECP. About 750 new first-year students are accepted by the faculty in each academic year. A weighted system is adopted to calculate entry points of the applicants based on their Grade 12 performance, and the applicants should have attained a minimum of 27 points to be considered for acceptance into the undergraduate degree programs (UWC 2021, 39).
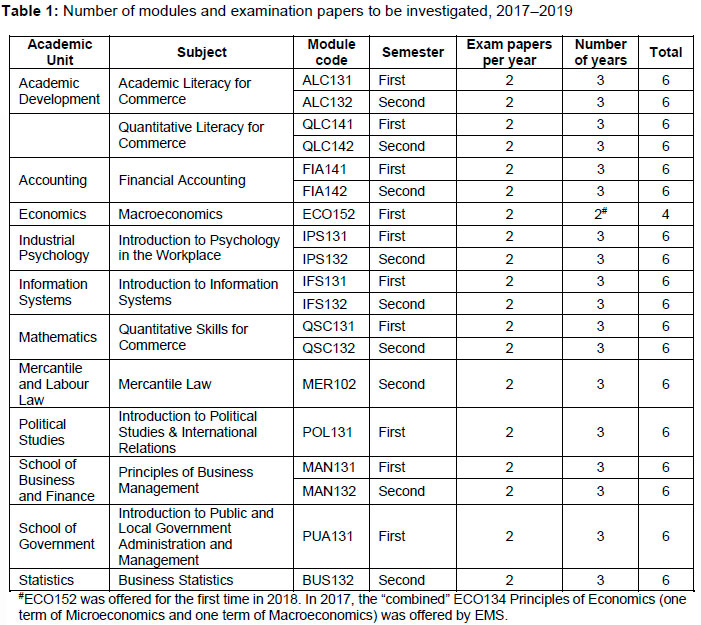
In this study, we use the final and supplementary examination papers of 19 mainstream undergraduate first-year modules, with 112 papers altogether, as shown in Table 1. These 19 modules are identified by the university's Academic Planning Unit as "at risk" modules associated with relatively lower pass rates in recent years. All modules are offered by various academic units from the EMS Faculty, with the exception of the following four modules, whose home department is outside the EMS: QSC131 and QSC132 (Department of Mathematics), MER102 (Department of Mercantile and Labour Law) as well as BUS132 (Department of Statistics and Population Studies). Nonetheless, we still include these modules for the empirical analysis because for some of the BCom programmes these modules are compulsory for the first-year students.
To answer our research questions as set out in the Introduction, we combine and utilise three sources. The first source is the abovementioned final and supplementary assessment papers, which are available on the university's Examination Paper Repository (UWC 2020). The second key statistics that are required for our analysis, are the pass rates of these modules and the performance of the students in the respective modules. The pass rates are obtained from the university's Marks Administration System (MAS). Ethics clearance was given by the Research Office of the university in October 2020.
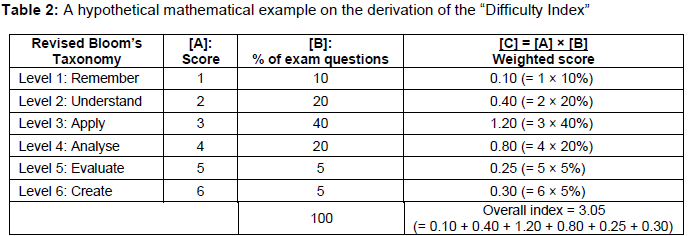
To quantify the level of assessment, we derive the proportion of questions in the assessment papers in connection with each level of the Revised Bloom's Taxonomy, before allocating a score between one (lowest level: remember) and six (highest level: create). The overall difficulty index is derived as: Σ6i=1Pi x Si, where Pi stands for the proportion of questions asked on a particular level of the taxonomy, and St is the score allocated to each level (between one and six). Table 2 further explains the derivation of the index with a hypothetical mathematical example. This index has a minimum value of one (if all questions relate to level 1) and a maximum value of six (if all questions are relevant to level 6).
There are some exam papers that involve bonus questions and a choice of questions, whilst in other papers the total marks stipulated on the cover page do not correspond with the actual totals. For these papers, the "real" total marks are analysed to derive the index. For example, in the 2017 BUS132 final exam paper, whilst the total marks are 100, there is 4-mark bonus question at the end of the paper. Hence, the "real" total marks are 104. As a second example, in all the MAN131 and MAN132 final and supplementary exam papers under study, the total marks are 90 (compulsory questions: 50 marks; elective questions: 40 marks), but for the elective questions, students were asked to answer any two out of three questions (each question carries 20 marks). Hence, the "real" total marks are 110 (50 + 20 x 3), before the difficulty index is derived. Lastly, in the 2019 QSC131 final exam paper for instance, the actual total should be 78 marks (after adding up the marks allocated to each question) instead of 75 marks as stipulated on the cover page; thus the "real" total marks of this paper are regarded as 78 when deriving the index.
After deriving the difficult index for each paper, the overall relationship as well as long-term relationship per module between this index and pass rate of the modules is investigated with various descriptive statistical and graphical analyses, such as XY-scatter plot, correlation coefficients and Ordinary Least Squares (OLS) regressions.
In addition, to the quantitative index that we create, we can compare the proportion of marks that derive from repeated questions over time. If questions are repeated over multiple years, we can compare and test the effect on the pass rate of the module. This will relate to the critical thinking skills of students as well.
EMPIRICAL FINDINGS
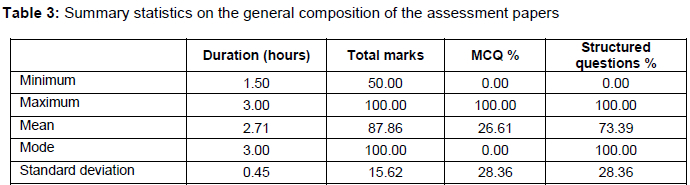
General composition of assessment papers
Table 3 present the information on the general composition of the assessment papers under study. Out of these 112 papers, 76 of them (or 67%) had a duration of three hours; only six modules' assessment papers had a duration of shorter than two hours: 2017 IPS 132 final and supplementary (1.5 hours), as well as 2017-2018 MER102 final and supplementary (1.75 hours). The remaining papers had duration of 2.0-2.5 hours. Moving on to total marks, 60 of the 112 papers (or 54% share) had total marks of 100, and eight assessment papers had the lowest total marks of 50, namely the 2017 IPS132 final and supplementary, as well as 20172019 MER102 final and supplementary.
At first-year levels, the two most common types of questions asked are multiple-choice questions (MCQs) and structured/short-essay written type questions. The findings from the two tables interestingly show the huge variance in the proportion of marks represented by the MCQs - ranging from as low as 0 per cent (in 48 papers) to as high as 100 per cent (in four papers -2018-2019 BUS132 final and supplementary), with a mean proportion of 28.36 per cent. Similarly, the proportion of questions accounted for by the written structured questions is as low as 0 per cent (the abovementioned four BUS132 papers) and as high as 100 per cent, with a mean of 28.36 per cent.
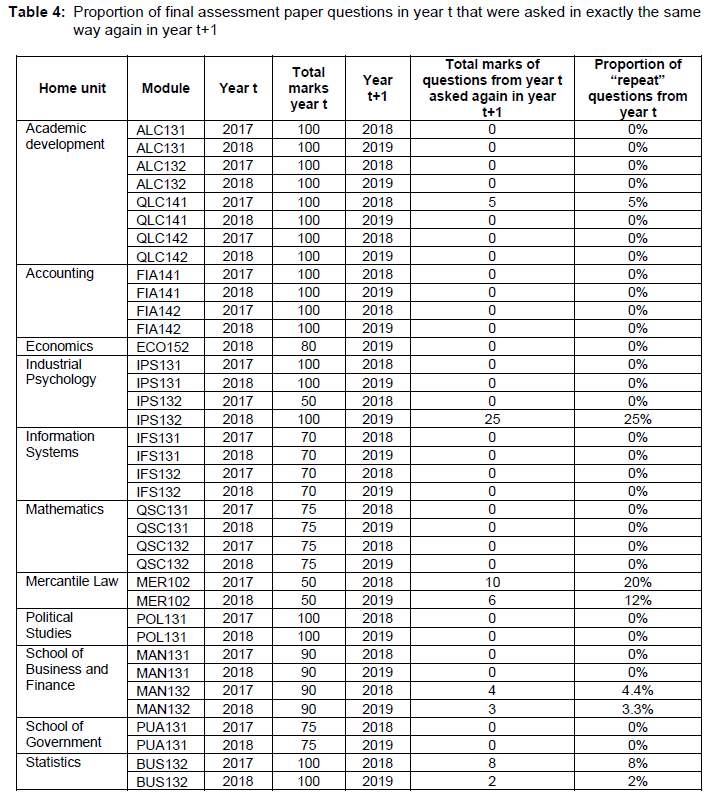
Usage of the same questions for final assessment papers in two consecutive years
In this sub-section we thoroughly examine the final assessment paper questions, as most students wrote the final assessments (results to be discussed in the next sub-section). We look at the proportion of questions that were asked in exactly the same way in two consecutive years. For example, in the QLC141/142 module, for the simplification of -(-4x9y5)4 being asked in consecutive years, whereas IFS131/132 asked the same question "Construct an ERD diagram for rule 1" but applied it to different scenarios each year. In this case, the QLC question would count as a repeated question but this is not the case in the IFS question.
The findings are shown in Table 4. The last column shows that the proportion of the year (t+1) "repeat" questions that came from the year t papers was the highest for the 2019 IPS132 final assessment paper (25%), followed by the 2017 MER102 paper (20%). The ALC131/132 module, while always asking students to write an academic essay with some guidelines, the questions change, and different case studies are used. Due to these reasons, the questions are not considered the same across the years. There were only two questions from QLC141/142 that repeated (one of three marks and one of two marks). The FIA141/142 courses are aligned to outside requirements from professional bodies like South African Institute of Chartered Accountants, and therefore while questions might repeat like setting of financial accounts, the scenarios are different.
The IPS131/132 final assessments asked MQCs and these repeated between the two years. If the order of the choice options is changed, this is still considered the same question. The MER102 final assessment papers are also highly dependent on MCQs and often focus on definitions in these questions. This is also true for MAN131/132 and BUS132.
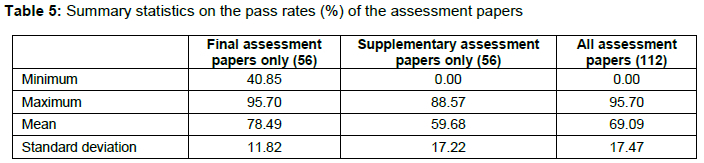
Pass rates statistics
Table 5 provide detailed statistics on pass rates. Each pass rate was derived by only considering the number of students who wrote the relevant examination (but not the total enrolment size). One must also keep in mind that, as expected, a much lower number of students wrote the supplementary assessments.
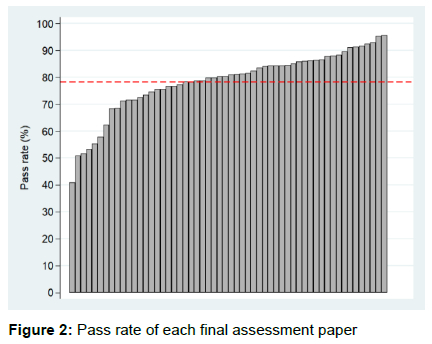
Looking at all 112 assessment papers, the average pass rate is just below 70 per cent (69.09%), with a minimum of 0 per cent and maximum of 95.70 per cent. For the 56 final assessment papers, the average pass rate is fairly high at 78.49 per cent (see the dotted line in Figure 2). The lowest pass rate comes from 2019 IPS132 - the only paper with less than 50 per cent pass rate. Moreover, 23 final assessment papers enjoy a pass rate of 80-89 per cent, while seven papers (2017 IPS132, 2017 MAN131, 2017 POL131, 2018 ALCS132, 2018 IFS132, 2019 IFS132 and 2019 QSC132) have a high pass rate of at least 90 per cent, with this rate being the highest in 2017 IPS132 (95.70%).
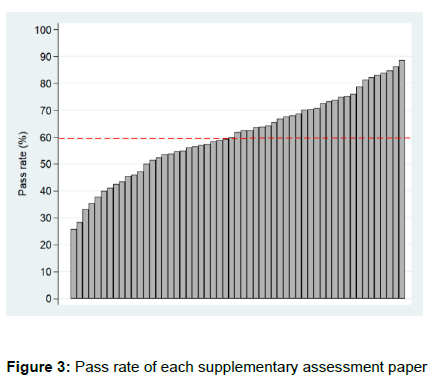
If one only examines the 56 supplementary assessment papers, the mean pass rate is relatively lower at 59.68 per cent (refer to the dotted line in Figure 3). This finding is expected as students writing the supplementary assessments are of relatively weaker academic standard (most of them failed after the final assessment). Only seven supplementary assessments had a pass rate of at least 80 per cent (2017 FIA142, 2017 IPS132, 2017 MER102, 2018 ALC131, 2018 ECO152, 2018 FIA142 and 2019 QSC131). On the contrary, a high number of 13 modules have a supplementary assessment pass rate of below 50 per cent; the pass rate was the lowest in 2017 QSC132 (all 14 students who wrote this assessment failed or the pass rate was 0%).
REVISED BLOOM'S TAXONOMY AND LEVEL OF DIFFICULTY INDEX
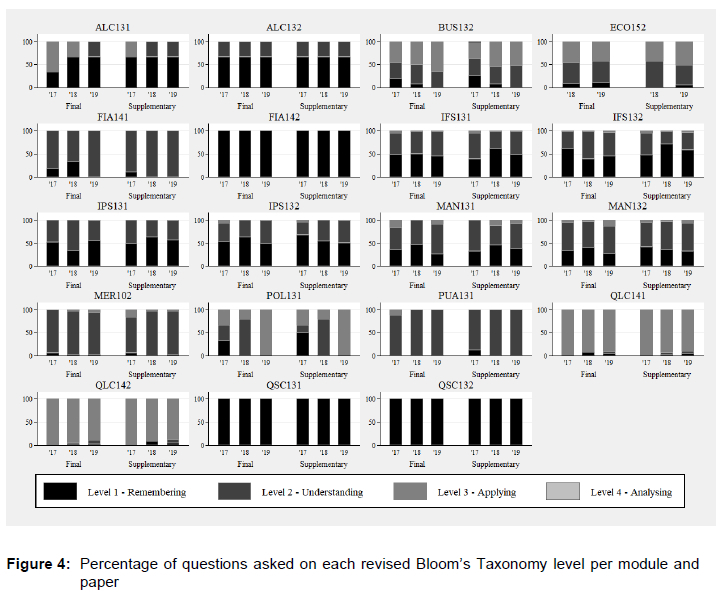
Breakdown of questions and derivation of level of difficulty index
The breakdown is shown in Figure 4 below. In the figure, most papers have levels 1 and 2 questions. FIA141/142 and QSC131/132 are four exceptions. These can be explained by the Bloom's application to quantitative questions where it places a higher level on mathematical calculations. This means words like "calculate" are associated with level 3, but simple remembering calculations are classified as remembering. Smith et al. (1996) adjust Bloom's taxonomy for the mathematical subjects like these. However, to keep the analysis consistent, we will not attempt this here. POL131 and QLC141/142 are subjects that have higher levels in level 3, where application is required, with some application questions in BUS132 and ECO152.
None of the papers we examined included questions that required students to use the higherlevel thinking on Bloom's Revised taxonomy, creating or evaluating. As noted above, NQF level five indicators do require students to evaluate problems new problems within a familiar context, although this form of evaluation is not explicitly aligned to Bloom's taxonomy. Thus, evaluation is not a key requirement of a first-year level assessment.
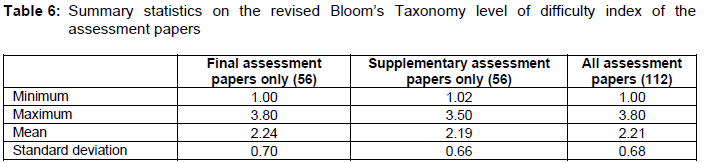
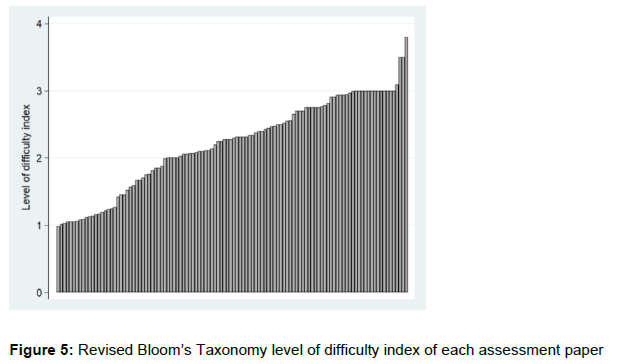
Table 6 shows the summary statistics of the level of difficulty index, and we show that on average the index is about 2.2, with a standard deviation of around 0.70. In addition, Figure 5 clearly shows the wide variation of the index amongst the 112 assessment papers. As per Figure 4 and Table 6, most assessment questions are on levels 1 and 2, with exceptions like QLC and POL with more level 3 questions. The average of the Revised Bloom's Taxonomy index for first-year summative assessment papers in EMS is 2.21.
Correlation between pass rate and revised Bloom's Taxonomy level of difficulty index
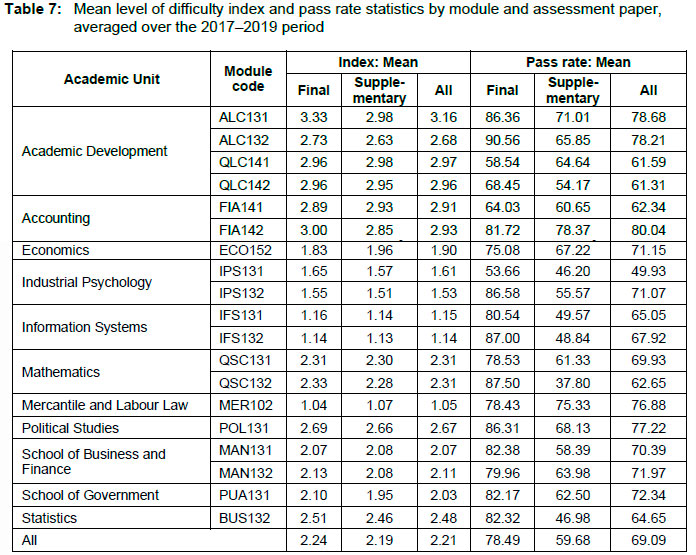
Table 7 shows the mean pass rate and level of difficulty index statistics by module and assessment paper. With regard to the former, the mean index is higher than the overall mean (2.2) in the following modules: ALC131, ALC132, QLC141, QLC142, FIA141, FIA142, QSC131, QSC132, POL132 and BUS132. The mean index is the highest in ALC131; on the contrary, it is the lowest (slightly above one) in MER102, IFS131 and IFS132. Going back to the modules with relatively higher mean of level of difficulty index, some of these modules are associated with low pass rates (less than 65%), namely QLC141 final and supplementary, QLC142 supplementary, FIA141 supplementary, QSC132 supplementary and BUS132 supplementary examinations.
Figures 6-8 show the XY-scatter plot results, and there is no strong indication of a negative relationship between the level of difficulty index and pass rate as expected. In fact, the correlation coefficients between the two variables are quite weak: (1) final assessment papers only: -0.0763; (2) supplementary assessment papers only: 0.1730; (3) all assessment papers: 0.0758. In other words, there is no strong indication that more difficult paper (associated with the higher index) is associated with lower pass rate. This result should be interpreted with great caution, because strictly speaking, one should also control for differences in other characteristics, such as personal characteristics, school performance, as well as lecture and tutorial attendances.
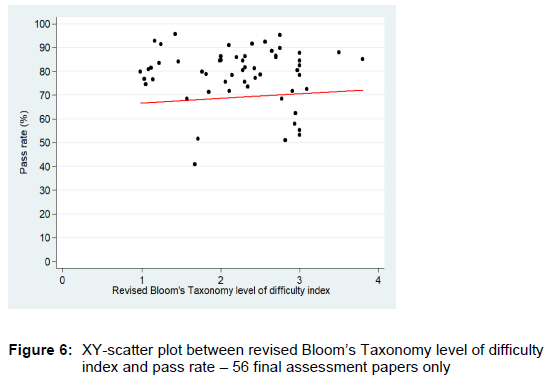
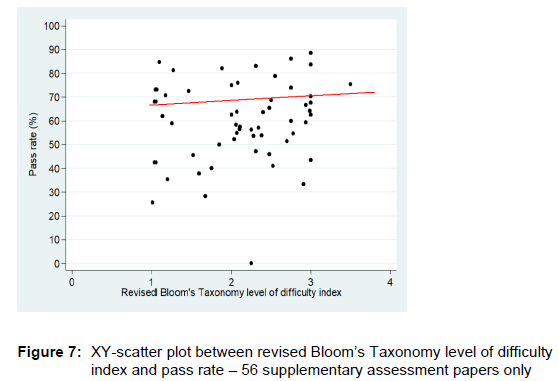
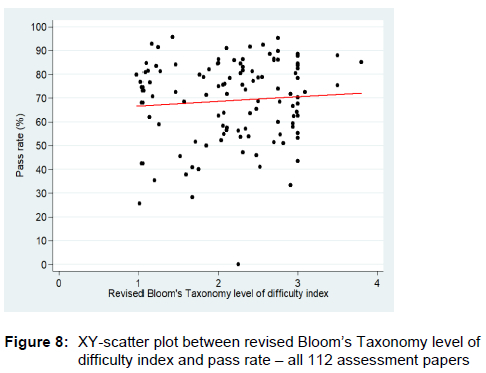
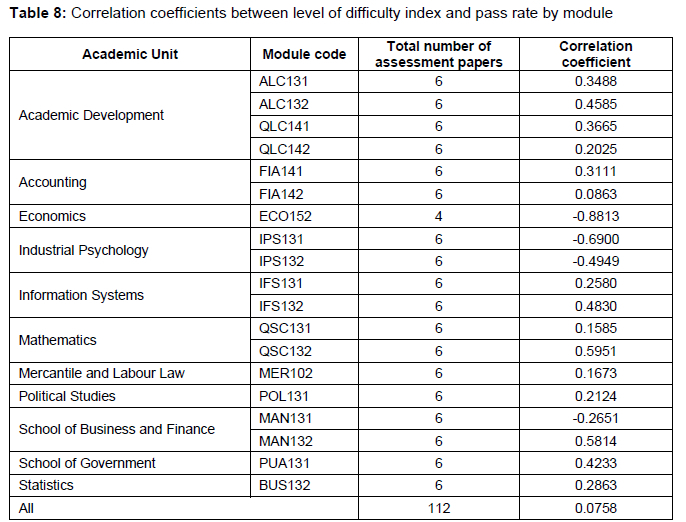
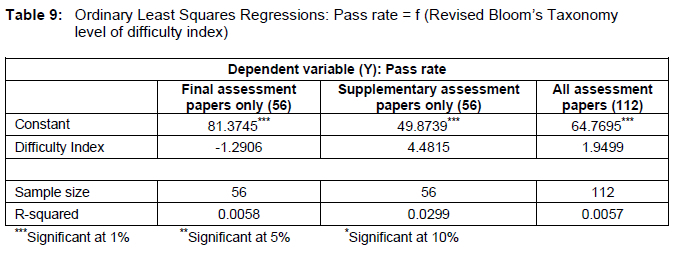
Table 8 shows the correlation coefficients in each module, but the results must be interpreted with great caution as the number of assessment papers per module is not particularly high (only between four and six during the 3-year period). The results indicate that the coefficient is negative only in a handful of modules: ECO152 (-0.8813), IPS132 (-0.6900), IPS132 (-0.4949) and MAN131 (-0.2651). Lastly, Table 9 shows OLS bivariate regression results, which once again do not suggest any significant relationship between the level of difficulty index and pass rate.
Given the above findings, it is possible that other factors such as study hours, class attendance, peer mentoring and Grade 12 results are more relevant in explaining pass rates of the modules during the period under study.
CONCLUSION AND RECOMMENDATIONS
This study examined 112 first-year EMS 2017-2019 final and supplementary assessment papers at a university in the Western Cape province. The general findings indicated that these papers are quite different in terms of total marks, duration, mark allocation to the MCQs and structured questions, as well as pass rates. Looking at our first two research questions we can see that first-year summative assessments have question posed mostly at levels one and two. Students are thus being assessed in terms of how much they remember and the extent to which they understand content. There are outlier modules that assess at either end of this scale. We see with the Mercantile Law MER102 module, for example, that MCQs are used extensively to assess and align with level one of Bloom's taxonomy. Here students are only required to remember content. On the other hand, there are modules that focus on applying, and in a very small number of cases, analysing information. Exam paper can differ in the types of questions they ask, and one paper may range from a level one question to a level four question. While there is variation across modules, the faculty is assessing on average between level two and three. In other words, on average papers are expecting students to move beyond remembering information, and to demonstrate understand of the content they are taught, and the ability to apply that content to case studies or real-world contexts.
In relation to our third research question, we see that there the empirical findings do not suggest a strong correlation between the level of difficulty index and the pass rates. One must interpret the results with great caution. Strictly speaking, we should control for other characteristics such as lecture attendance, personal circumstances and formative assessments in order to have clear findings. Our research presented a relatively simple bivariate analysis; to derive more comprehensive empirical findings, one needs to control for differences in a wide range of personal (e.g., gender, ethnicity, area of residence), school (e.g., Matric performance) as well as university study characteristics (lecture attendance, tutorial attendance, frequency of using the e-teaching learning and teaching materials).
For future research we recommend that we conduct a similar study at undergraduate levels 2 and 3 in EMS. It is important to understand whether summative assessment in moving up to higher levels of Bloom's taxonomy. It would also be useful to research students understanding of Bloom's taxonomy to better gauge their expectations and alignment with outcomes.
We found that there is no explicit national policy that guides higher education institutions (HEIs) on how to use Bloom's or any other taxonomy, to assess students at the appropriate NQF level. Hence, we strongly recommend that a national assessment policy framework be developed to guide the HEIs on how to assess undergraduate students at different cognitive levels as required by the NQF. Our recommendation is that there should be a national assessment policy guiding higher education institution on conceptual pointers such as the weighting allocation for each NQF level. For example, at first year (NQF 5), the weighting for low cognitive levels such as knowledge and comprehension be 20 per cent and high cognitive levels be 80 per cent. While for the second years (NQF 6), the weighting for low cognitive levels be 10 per cent and high cognitive levels be 90 per cent. Hence, our argument is that when students reach third year, then all assessments should be pitched only at a high cognitive level which is 100 per cent and, in this way, students will be adequately prepared for postgraduate study.
This research study highlights the plight for a need to develop an assessment model for higher education institutions for the South African context to address the ongoing challenges of assessments and the need for academics to be trained on how to assess at the appropriate NQF level as required by the SAQA.
Lastly, the context of this research study could inform higher education institutions in Africa about the ongoing challenges of assessing students at the appropriate NQF level and a possible way forward on how to overcome these challenges.
ACKNOWLEDGEMENT
The authors acknowledge the research assistance provided by Professor Gregory Ruiters.
REFERENCES
Anderson, L. W., D. R. Krathwohl, P. W. Airasian, K. A. Cruikshank, R. E. Mayer, P. R. Pintrich, J. Raths, and M. C. Wittrock. 2001. A taxonomy for learning, teaching and assessing: A revision of Bloom's Taxonomy of educational objectives. Abridged edition. New York: Longman. [ Links ]
Forehand, M. 2005. "Bloom's taxonomy: Original and revised." In Emerging perspectives on learning, teaching, and technology, ed. M. Oredy. http://projects.coe.uga.edu/epltt/. (Accessed 20 July 2020). [ Links ]
Jabbar, D. A. and Z. Omar. 2015. "Exam question classifications based on Bloom's taxonomy cognitive level using classifiers combination." Journal of Theoretical and Applied Information Technology 78(3): 1-21. [ Links ]
Kembo, J. 2020. "How effectively are university students tested? A case study." Eastern African Journal of Education Studies 2(1): 59-66. [ Links ]
Krathwohl, D. R. 2002. "A Revision of Bloom's taxonomy: an overview." Theory Into Practice 41(4): 212-218. [ Links ]
Mawa, B., M. M. Haque, and M. M. Ali. 2019. "Level of learning assessed through written examinations in social science courses in tertiary education: A study from Bangladesh." Journal of Teacher Education and Research 14(1): 7-12. [ Links ]
Omar, Z., S. F. Syahidah, R. Hassan, H. Arshad, M. Rahmat, N. F. A. Zainal, and R. Zulkifli. 2012. "Automated analysis of exam questions according to Bloom's Taxonomy." Procedia - Social and Behavioural Sciences 59(1): 297-303. [ Links ]
Ontong, J. M. and A. Bruwer. 2020. "The use of past assessments as a deductive learning tool? Perceptions of students at a South African University." South African Journal of Higher Education 34(2): 177-190. [ Links ]
SAQA see South African Qualifications Authority. [ Links ]
Smith, G., L. Wood, M. Coupland, and B. Stephen. 1996. "Constructing mathematical examination to assess a range of knowledge and skills." International Journal of Mathematical Education in Science and Technology 21(1): 65-77. [ Links ]
South African Qualifications Authority. 2012. Level descriptors for the South African National Qualifications Framework. Pretoria: SAQA. [ Links ]
Tremblay, K., D. Lalancette, and D. Roseveare. 2012. Assessment of higher education learning outcomes. Feasibility study report. Volume 1: Design and implementation. Paris: Organisation for Economic Co-operation and Development (OECD). [ Links ]
University of the Western Cape. 2019. "UWC Student Success and Retention Framework." Unpublished study. Bellville: University of the Western Cape. [ Links ]
University of the Western Cape. 2020. UWC examination paper repository. (Accessed 15 July 2020). [ Links ]
University of the Western Cape. 2021. UWC 2021 General Calendar. Bellville: University of the Western Cape. [ Links ]
UWC see University of the Western Cape. [ Links ]
Weir, C. and J. Roberts. 1994. Evaluation in ELT. Oxford: Blackwell. [ Links ]

