


Services on Demand
Article
 English (pdf)
 Article in xml format
 Article references
Indicators

Related links
-
 Cited by Google
 -
 Similars in Google
Share

 Permalink
South African Journal of Higher Education
On-line version ISSN 1753-5913
S. Afr. J. High. Educ. vol.35 n.5 Stellenbosch Nov. 2021
http://dx.doi.org/10.20853/35-5-4228
GENERAL ARTICLES
Tuition fees at the University of Cape Town: 1923-2020
K. DavidsonI; C. van WalbeekII; N. VelliosIII
ISchool of Economics University of Cape Town Cape Town, South Africa https://orcid.org/0000-0001-8771-4767
IISchool of Economics University of Cape Town Cape Town, South Africa https://orcid.org/0000-0003-0933-435X
IIISchool of Economics University of Cape Town Cape Town, South Africa https://orcid.org/0000-0003-1488-0179
ABSTRACT
Tuition fees at South African universities have been increasingly contested in recent years. In this article, we analyse trends in tuition fees for five degrees offered by the University of Cape Town (UCT) from 1923 to 2020. Data were collected from UCT's handbooks and calendars. Adjusting for inflation, we found that, on average, tuition fees increased nearly 400 per cent from 1923 to 2020. Tuition fees increased only marginally between 1923 and 1970, but increased almost 300 per cent, on average, from 1970 to 2020. We also estimated the affordability of tuition fees between 1946 and 2019. Affordability considers both changes in tuition fees and changes in average income, approximated by per capita GDP. Between 1946 and the early 1980s, tuition at UCT became relatively more affordable as the growth in average income generally exceeded the growth in tuition fees. Post-1980, the combination of modest economic growth and rapid increases in tuition fees has made university education at UCT substantially less affordable. The percentage of per capita GDP required to study at UCT doubled between the early 1980s and 2019.
Keywords: tuition fees, education, University of Cape Town, higher education, South Africa, affordability
INTRODUCTION
Student tuition fees have come under increasing scrutiny over the last few years. The #FeesMustFall protests (2016 to 2018) left an indelible mark on all tertiary institutions. Although the protests also addressed other issues, #FeesMustFall was mainly focused on students' frustration with high tuition fees. According to protesting students, high fees have made higher education an elite commodity. To provide a historical context to students' arguments, we explore the trends in tuition fees at the UCT from 1923 to 2020, and some of the factors that could explain these trends.
Trends in tuition fees have been routinely investigated in the US. For over 20 years, the College Board has published reports on college fees by state (Ma, Pender, and Libassi 2020, 1). The most recent report, published in 2020, indicates that tuition fees in the US have increased sharply in the past 30 years. Adjusting for inflation, the authors find that in 2020-21, the average public four-year in-state tuition and fee price is 2.78 times as high as it was 30 years ago. At private non-profit four-year and public two-year institutions, average tuition and fees, adjusted for inflation, have doubled in the past 30 years (Ma, Pender, and Libassi 2020, 4).
A systematic review of 178 articles, covering the 2006-2015 period, concluded that a decline in government funding has been associated with a rise in tuition fees in high-income countries (Zhang, Kang, and Barnes 2016, 521).
Teferra and Altbachl (2004) investigate the challenges faced by African higher education in the 21st century. Although the article is now dated, their findings that funding problems will get worse as the pressure for academic and institutional expansion runs into limited resources, still apply.
Higher education plays an important role in the economic development of any country. While education has individual benefits (Branson and Leibbrandt 2013, 2; Branson, Leibbrandt and Zuze 2009, 1), highly educated citizens are also crucial for the functioning of society as a whole (Pinheiro and Pundy 2016, 150; Bergheim 2005, 3). Since education benefits society, it is not surprising that the South African government, like nearly all governments worldwide, subsidises higher education. Universities typically have three sources of income: tuition fees, government subsidies, and "other income", the latter typically from industry, private grants, and bequests.
De Villiers and Steyn (2006) found that for a group of historically advantaged universities (including UCT), tuition fees as a percentage of total income increased from 13 per cent in 1986 to 23 per cent in 2003. Income from government subsidies for the same universities decreased from 51 per cent to 40 per cent of total income over the same period (De Villiers and Steyn 2006, 41).
In 2008, Wangenge-Ouma and Cloete argued that declines in government funding for higher education meant that universities had to rely more on tuition fees for revenue. They advocated a restructuring of the higher education funding model, and argued that if government funding continued to decline, tuition fees would inevitably continue to increase (Wangenge-Ouma and Cloete 2008, 906).
In a subsequent paper, Wangenge-Ouma (2012) argued that whenever higher education expands from the elite to the majority, new students entering the system are more likely to be financially challenged. Increased access to higher education after 1994 resulted in large numbers of financially insecure students coming into the system (Wangenge-Ouma 2012, 831).
Calitz and Fourie (2016) investigated tuition fee trends for the Bachelor of Arts (BA) degree at Stellenbosch University from 1911 to 2015. They found that inflation-adjusted tuition fees for the BA degree in 2015 were 2.7 times higher than in 1961. The authors noted that the rapid increases in tuition fees between 2006 and 2015 are a continuation of above-inflation increases in tuition fees that started in the 1970s. The main reason for the rapid fee increases in the post-1994 period is a lack of government funding, primarily as a result of the political imperative to prioritise primary and secondary education (Calitz and Fourie 2016, 149).
This focus of this article is on full-fee tuition. Through scholarships and bursaries, a large proportion of students, mainly from previously disadvantaged communities, are financially supported. Such students are largely unaffected by the level of, or the growth in, tuition fees. While some of these funds come from private endowments or from the government (e.g., the National Student Financial Aid Scheme (NSFAS)), UCT also uses a percentage of its income to support financially constrained students. In 2010, this percentage was 1 per cent, but by 2018 it had grown to 5 per cent (UCT 2010; UCT 2018).
As far as we are aware, there is no published literature on trends in tuition fees at the UCT. The University of Cape Town 1918-1948: The Formative Years mentions the university's tuition fees but does not provide any detail (Phillips 1993). Given the limited literature on tuition fees at South African universities in general, and UCT in particular, this article aims to shed light on the topic. We investigate trends in tuition fees at UCT for the period 1923 to 2020. We explore whether the claims made by protesting students that fees are unaffordable is substantiated by the data.
A BRIEF HISTORY OF FEES AT UCT
There has been considerable and repeated change to UCT's fee structure over the last century. From 1923 to 1935, the total fee was comprised of various fees and levies (UCT 1935, 200). These include a tuition fee paid in each quarter of the academic year, an exam fee per exam written, and some degree-related fees, for example the hospital fee paid by medical students. An athletics fee for all extracurricular activities was charged until 1936, which was mandatory for male, but not for female, students. In 1926, male students accounted for approximately 60 per cent of the student body (Phillips 1993, 60).
In 1936, the composite fee structure was replaced with a single annual fee, which continued until 1956. From 1957 to 2005, students registered for the Bachelor of Arts (BA) and Bachelor of Commerce (BCom) degrees were charged per course, while those taking the Bachelor of Science (Engineering) (BSc), Bachelor of Surgery and Medicine (MBChB), and Bachelor of Laws (LLB) degrees were all charged a single annual fee. There were five additional fees required, besides the single annual fees, from 1952 and 1988: a health fund fee (introduced in 1952), a contribution to a fund for visiting lecturers (1952), personal accident insurance (1971), a transport levy (1975) and a graduation fee (1975). From 1988 onward, they were no longer required. Since 2006, tuition fees have been levied by course. There are no additional mandatory or earmarked levies.
DATA AND METHODS
Trends in tuition fees
Fees data for five degrees offered by UCT from 1923 to 2020 were collated from the university's administrative archives in Mowbray, Cape Town. The primary resources were the handbooks and calendars that UCT has published annually since its inception. Prior to 2006, the information on all the faculties at the university, including tuition fees, degree structures, required courses, and administrative information, was reported in "calendars". As the university expanded, it was no longer possible to print all this information in one book. From 2006, separate handbooks were published for each faculty, covering degree structures, required courses, and administrative information. There are also handbooks covering student housing, student fees, bursaries, and other university-wide topics. The tuition fee handbook provides tuition fee information for all faculties.
The period 1923 to 2020 was chosen for the analysis as 1923 was the first year that all of the following five degrees were offered at UCT: LLB, BA, BCom, BSc and MBChB. The BCom degree was offered for the first time in 1923 (UCT 1923). The BA and BSc degrees were offered in full from 1918 (UCT 1918). 1922 was the first year that students could obtain the full MBChB degree at UCT (UCT 1922). Previously, students could complete some of the degree, but would then transfer to another university (typically in the UK) to complete their degrees.
The tuition fee by degree (in nominal terms) is computed as the average annual cost of the degree in that year. The cost for the 1923 BA degree, for example, is estimated by dividing the full cost of the degree in 1923 (£80) by the number of years required to complete the degree (3 years), i.e., £26.67. In 1923, the first year of the BA degree cost £26, disaggregated as follows: tuition fee of £20 (£5 tuition fee per term x 4 terms), exam fee of £3 (£1 per course x 3 courses), £2 athletics fee, and £1 registration fee. In 1923, the second year of a BA degree also cost £26, while the third-year cost £28 (inclusive of a £2 graduation fee).
Appendix A provides a full explanation of all the assumptions made. The assumptions regarding the time taken to complete a degree are as follows:
(1) BA: three years of only humanities courses;
(2) LLB : a five year combination of BA and LLB stream. Humanities courses are taken in the first three years and law courses in the final two years.
(3) BSc Engineering: four years;
(4) BCom: three years;
(5) MBChB: six years.
We assume that students take the minimum prescribed time to complete their degrees to incur the lowest cost possible. We also assume that, within a specific degree structure, students choose the cheapest stream or programme. For example, in 2019, the general BA degree's average cost was R48 812 (which is the amount used in our analysis), while the BA (Fine Arts) degree stream's average cost was R63 808. It was also assumed that students graduated in person instead of in absentia, as this cost the least. Graduation fees were levied in various years, primarily in the pre-1987 period.
Tuition fees were adjusted for inflation using the consumer price index following the methodology of Calitz and Fourie (2016) and Ma, Pender, and Libassi (2020). Annual consumer price index (CPI) data from 1980 to 2019 were sourced from Statistics South Africa (Statistics South Africa 2020). The 2020 CPI figure is a projected figure taken from the South African Reserve Bank's (SARB) Statement of the monetary policy committee (SARB 2020b). Fees were deflated using 2019 as the base year. For the 1923 to 1979 period, we constructed the CPI figures from the inflation figures published by Statistics South Africa (Statistics South Africa 2020).
Before 1960, fees were converted to rands at R2 per pound, as this was the rate pound sterling was converted to the new currency (Henshaw 1996, 198). This is the same method used by Calitz and Fourie (2016) in their calculation of tuition fees prior to 1960.
Affordability
Affordability refers to a person's ability to pay for a product or service, given its price and their income. Even if university tuition is becoming more expensive, it may remain affordable if people's income increases at a sufficiently rapid pace. Although per capita GDP is an imperfect measure of income, changes in per capita GDP are often used as a proxy for changes in individual or household income (Blecher and Van Walbeek 2009).
To estimate trends in the affordability of university tuition, nominal annual fees were divided by per capita GDP in current prices and multiplied by 100. GDP per capita data were sourced from the South African Reserve Bank (SARB 2020a). The affordability index is interpreted as the percentage of annual average income needed to pay annual tuition fees. The lower the number, the more affordable the degree is and vice versa. The analysis is done on a subset of the data (1946 to 2019) since per capita GDP data prior to 1946 are unavailable.
RESULTS
Trends in the real cost of tuition at UCT
Figure 1 shows the average annual real tuition fees for the BCom, BA, BSc, LLB and MBChB degrees from 1923 to 2020. On average, fees increased by 381 per cent from 1923 to 2020. Fees, in real terms, remained relatively stable until 1970 and then began to increase rapidly. The percentage increases from 1923 to 2020 for the degrees are 410 per cent (BCom), 439 per cent (BA), 330 per cent (BSc), 414 per cent (LLB), and 312 per cent (MBChB). In the first half of the period (1923 to 1969), the real tuition fees increased by 40 per cent (BCom), 68 per cent (BA), 27 per cent (BSc), 46 per cent (LLB), and 6 per cent (MBChB). The main increases in tuition occurred in the second half of the period (1970 to 2020) and were 271 per cent (BCom), 238 per cent (BA), 258 per cent (BSc), 272 per cent (LLB), and 311 per cent (MBChB).
Table 1 shows the overall and decadal percentage changes in real tuition fees (expressed in constant 2019 prices). For example, the annual cost of the BA degree increased from R10 506 in 1923 to R11 283 in 1930 (a 6% increase) (Table 1, Column 2). Decadal percentage increases in the real tuition fees are substantially higher in the post-1970 period than in the pre-1970 period (Table 1, Column 6). The largest decadal percentage increase (49%) occurred between 2000 and 2010.
While all degrees were subject to substantial fee increases, there is some variation across the five degrees. For example, from 1970 to 2020, inflation-adjusted fees for the MBChB degree increased by 311 per cent (the highest increase over that period), while inflation-adjusted fees for the BA degree increased by 238 per cent (the lowest increase over that period).
Figure 2 presents the year-on-year changes in the nominal tuition fees (an average for all five degrees) and the inflation rate. Between 1945 and the early 1970s, tuition fees did not automatically increase from year to year. Typically, nominal tuition fees remained the same from year to year, but increased quite sharply (often by more than 20%) every three to five years. Inflation was generally low in this period, which meant that annual inflationary adjustments were not required.
Inflation increased rapidly in the early 1970s and breached 10 per cent for the first time in 1974. Inflation remained consistently above 10 per cent till 1992. Nominal tuition fees increased every year since 1972 and the increase was typically a few percentage points above the inflation rate. As a result of the above-inflationary increases over an extended period of time, real tuition fees increased.
Trends in the affordability of tuition at UCT
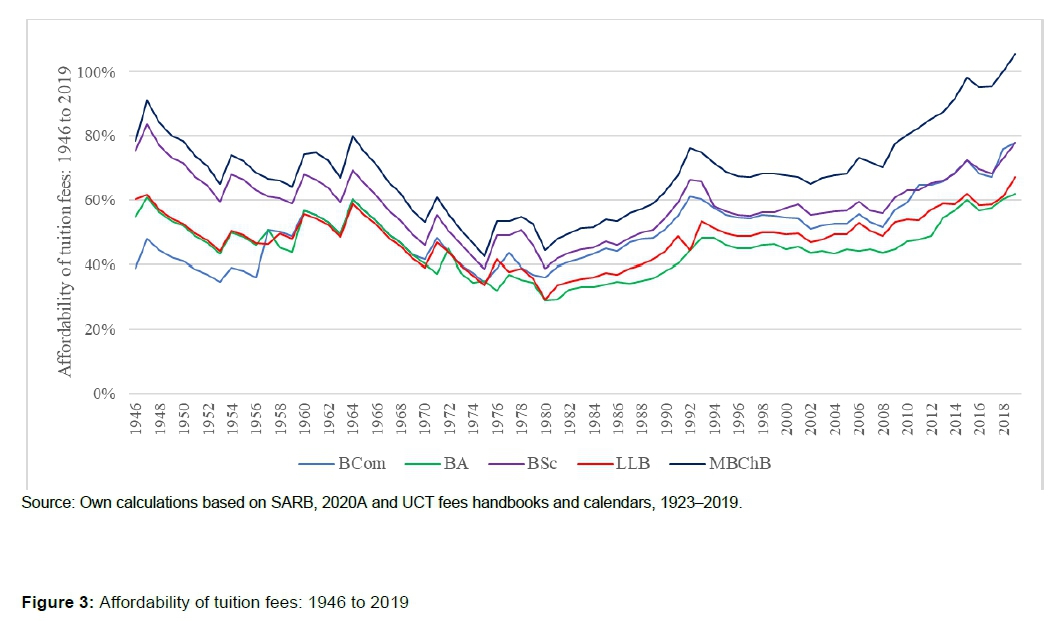
Between 1946 and 1980, real tuition fees increased by an average of 49 per cent across the five degrees, but this was counteracted by a 146 per cent increase in real per capita GDP over the same period (SARB 2020a; Statistics South Africa 2020). As a result, studying at UCT became more affordable for the average South African (see Figure 3). While this is generally true across the five degrees, there is some variation. For example, between 1946 and 1980, studying for a BCom became 7 per cent more affordable. Over the same period, a BA, a BSc, an LLB and an MBChB became 47 per cent, 48 per cent, 51 per cent and 43 per cent more affordable, respectively.
Since 1980, studying at UCT has become substantially less affordable for the average South African. The combination of large fee increases and low economic growth in the 1980s meant that studying at UCT became, on average, 41 per cent less affordable over that decade (see Table 2). Between the early 1990s and 2008 the growth in per capita GDP roughly kept up with the growth in tuition fees, with the result that there were no substantial changes in the affordability. However, after the financial crisis of 2008 and the ensuing recession, studying at UCT has become increasingly unaffordable. Tuition fees outpaced per capita GDP growth. In 2019, studying at UCT required, on average, 120 per cent more of per capita GDP compared to 1980. Between 1980 and 2019 the five degrees required 114 per cent (BA), 116 per cent (BCom), 101 per cent (BSc), 130 per cent (LLB) and 137 per cent (MBChB) more of an average household's income.
DISCUSSION
Since 1923, the real cost of tuition fees has, on average, increased by almost 400 per cent. The majority of the increases occurred since the 1970s. Decreased government funding since 1994 has forced universities to increase their reliance on tuition fees as a source of income, which has placed more financial pressure on students and their parents or funders. Since the early 1970s, the real cost of tuition fees at UCT has, on average, increased by nearly 300 per cent. This increase corresponds closely to the increase in tuition fees for a BA degree at Stellenbosch University (Calitz and Fourie 2016, 153), indicating that Stellenbosch University and UCT are likely to be subject to similar pressures.
The overall economic performance of a country can exacerbate or mitigate the impact of fee increases. When the economy was growing rapidly, as it did in South Africa in the 1960s and in the early 2000s (until 2008), the growth in average income prevented tuition fees from becoming unaffordable, despite relatively sharp increases in tuition fees.
Our findings are consistent with trends in both developed and developing countries. A systematic review of funding for institutions of higher education in developed countries concluded that there has been a decline in government funding and a rise in tuition fees (Zhang, Kang, and Barnes 2016). Similarly, developing countries, particularly in Africa, have faced large reductions in government expenditure on higher education (Kwasi-Agyeman, Langa, and Swanzy 2020, 4).
The South African government is faced with numerous spending priorities; higher education is one of many. Since 1994, the government has prioritised spending on housing, health, social grants, and education (Visser 2004, 14). In keeping with the South African constitution that ensures the right to basic education, the government has prioritised primary and secondary education (Motala and Dieltiens 2010, 1). The tertiary education sector includes not only traditional universities, but also Technical and Vocational Education (TVET) colleges (previously Technikons), Further Education and Training (FET) Colleges, and Sector Education and Training Authorities (SETAs). The non-traditional tertiary institutions have become relatively more important (in terms of student numbers) and have received an increasingly greater share of government funding.
From 1945 to 2000, the share of government expenditure allocated to the tertiary education sector increased consistently, and accelerated sharply in the post-democratic transition period (1994 to 1998). From 2002 to 2006, tertiary education's share of total government expenditure decreased from about 5.4 per cent to 4.10 per cent, despite an 11 per cent increase in student enrolments. Since its low point in the 2006-2009 period, the expenditure share of tertiary education has increased, reaching its 2002 level in 2020 (Beale 1998; National Treasury 1993; 1994; 1995; National Treasury 2019; 2020; SARB 2020c; Department of Education, 2002-2016).
UCT's share of the total government expenditure has decreased consistently from about 0.17 per cent in 2000 to less than 0.14 per cent in 2012, where it has remained. In the context of the fairly consistent increase in the tertiary sector's relative share of government expenditure since 2009, UCT has been getting a smaller and smaller share of the allocation to the tertiary education sector (UCT 2001; SARB 2020d).
The Report of the Commission of Inquiry into Higher Education and Training, published in 2017, provides a comprehensive examination of the implications of the recent tuition fee increases and recommendations for actions that government should take (The Presidency 2017). One of the Commission's key recommendations is to introduce a cost-sharing model, in particular an income-contingent loan scheme. This scheme would replace NSFAS for all students with the exception of TVET college students. It involves the private financial sector providing loans to university students and the state either purchasing or guaranteeing loan repayments. Students will only be expected to repay their loans once they reach a particular income level (The Presidency 2017, 540). Addressing the problem is beyond the scope of this paper.
Limitations
There are limitations on both the calculation of real tuition fees and the calculation of affordability. Regarding the tuition fee, we assume that students complete their degrees in minimum time. To the extent that students take longer to complete their degrees, this assumption will introduce a bias in the de facto cost of studying at UCT. Although CPI data is the best estimate of the general price level, it is subject to bias, especially over a very long period of time. The composition of the CPI basket changes, as some products and services become obsolete and other products and services are introduced and popularised. To prevent the illusion of precision, we do not present decimals in the growth rates (Tables 1 and 2).
Since income inequality in South Africa is extremely high, the affordability results should be interpreted cautiously. Because individuals' circumstances can differ a great deal from the average, it is not appropriate to use the affordability measure to determine whether university tuition has become more or less affordable for any individual. At best, it can be an approximate indicator of the income of the average person.
CONCLUSION
Since 2015, students across South Africa have challenged the high level of tuition fees at South African universities. The #FeesMustFall protests expressed students' frustration with the high tuition fees (and a range of other factors). Our analysis suggests that this frustration had a very long run-up.
We found that inflation-adjusted tuition fees at UCT increased by nearly 400 per cent between 1923 and 2020, on average, with most of the tuition-fee increases occurring in the post-1970 period. Increasing tuition fees at UCT are not a recent phenomenon but rather part of a long-run trend. Government funding plays an important role in keeping tuition fee increases under control.
Tuition fees became more affordable in the period from 1945 to 1980, but they became increasingly less affordable after 1980. Government funding is a vital component of any university's income. A decrease in government funding this has been counterbalanced by an increase in tuition fees and revenue from other sources.
REFERENCES
Beale, Mary A. 1998. "Apartheid and university education, 1948-1970." Doctoral dissertation. University of the Witwatersrand. http://wiredspace.wits.ac.za/bitstream/handle/10539/20610/Beale%20Mary%20Alice. _Apartheid%20and%20university%20educati_001.pdf?sequence=1& isAllowed=y (Accessed 27 July 2020). [ Links ]
Bergheim, Stefan. 2005. Human Capital is the Key to Growth - Success Stories and Policies for 2020. Deutsche Bank Research Current Issues Working Paper. http://dwyered.tripod.com/sitebuildercontent/sitebuilderfiles/db_human_capital.pdf (accessed 27 July 2020). [ Links ]
Blecher, Evan, Alex Liber, Corné van Walbeek, and Laura Rossouw. 2018. "An international analysis of the price and affordability of beer." PloS ONE 13(12). https://doi.org/10.1371/journal.pone.0208831. [ Links ]
Blecher, Evan and Corné van Walbeek. 2009. "Cigarette affordability trends: An update and some methodological comments." Tobacco Control 18(3): 167-175. http://dx.doi.org/10.1136/tc.2008.026682. [ Links ]
Branson, Nicola and Murray Leibbrandt. 2013. "Educational Attainment and Labour Market Outcomes in South Africa, 1994-2010." OECD Economics Department Working Papers No. 1022. Organisation for Economic Co-operation and Development. https://www.oecd-ilibrary.org/economics/educational-attainment-and-labour-market-outcomes-in-south-africa-1994-2010_ 5k4c0vvbvv0q-en (Accessed 27 July 2020). [ Links ]
Branson, Nicola, Murray Leibbrandt, and Tina L. Zuze. 2009. "What are the returns for tertiary education and who benefits?" In Responding to the Educational Needs of Post-School Youth, ed. Nico Cloete. Wynberg: Centre for Higher Education Transformation. [ Links ]
Calitz, Estian and Johan Fourie. 2016. "The Historically High Cost of Tertiary Education in South Africa." Politikon 43(1): 149-154. https://doi.org/10.1080/02589346.2016.1155790. [ Links ]
Department of Education. 2002-2006. Education Statistics in South Africa at a Glance. Pretoria: Government Printer. [ Links ]
De Villiers, Pierre and Gert Steyn. 2006. "Income and expenditure trends of higher education institutions in South Africa: 1986-2003." Perspectives in Education 24(2): 35-48. https://hdl.handle.net/10520/EJC87376. [ Links ]
Henshaw, Peter J. 1996. "Britain, South Africa and the Sterling Area: Gold production, Capital Investment and Agricultural Markets: 1931-1961." The Historical Journal 39(1): 197-223. https://www.jstor.org/stable/2639946. [ Links ]
Kwasi-Agyeman, Fredua, Patrício Langa, and Patrick Swanzy. 2020. "Higher Education Funding and Student Access in the Global South." Journal of Comparative & International Higher Education 12(Fall): 83-98. [ Links ]
Ma, Jennifer, Matea Pender, and Carmello Libassi. 2020. Trends in College Pricing and Student Aid 2020. New York: College Board. https://research.collegeboard.org/pdf/trends-college-pricing-student-aid-2020.pdf. [ Links ]
Motala, Shireen and Veerle Dieltiens. 2010. Educational access in South Africa: Country research summary. Consortium for Research on Educational Access, Transitions and Equity. University of the Witwatersrand Education Policy Unit. http://www.create-rpc.org/pdf_documents/South_Africa_Country_Research_Summary.pdf (Accessed 27 July 2020). [ Links ]
National Treasury. 1993. Budget Review. Pretoria: Government Printer. http://www.treasury.gov.za/documents/national%20budget/Budget%20Review%201993.pdf (Accessed 27 July 2020). [ Links ]
National Treasury. 1994. Budget Review. Pretoria: Government Printer. http://www.treasury.gov.za/documents/national%20budget/Budget%20Review%201994.pdf (Accessed 27 July 2020). [ Links ]
National Treasury. 1995. Budget Review. Pretoria: Government Printer. http://www.treasury.gov.za/documents/national%20budget/Budget%20Review%201995.pdf (Accessed 27 July 2020). [ Links ]
National Treasury. 2019. Budget Review. Pretoria: Government Printer. http://www.treasury.gov.za/documents/national%20budget/2019/review/FullBR.pdf (Accessed 27 July 2020). [ Links ]
National Treasury. 2020. Budget Review. Pretoria: Government Printer. http://www.treasury.gov.za/documents/national%20budget/2020/review/FullBR.pdf (Accessed 27 July 2020). [ Links ]
Phillips, Howard. 1993. The University of Cape Town 1918-1948: The Formative Years. Cape Town: Jacana Media. [ Links ]
Pinheiro, Rómulo and Pundy Pundy. 2016. "Higher education and economic development in the OECD: Policy lessons for other countries and regions." Journal of Higher Education Policy and Management 38(2): 150-166. https://doi.org/10.1080/1360080X.2016.1150237 (Accessed 27 July 2020). [ Links ]
SARB see South African Reserve Bank.
South African Reserve Bank. 2020a. GDP per capita (current). https://www.resbank.co.za/Research/Statistics/Pages/OnlineDownloadFacility.aspx (Accessed 15 July 2020). [ Links ]
South African Reserve Bank. 2020b. Statement of the monetary policy committee. Press Statement. https://www.resbank.co.za/Lists/News%20and%20Publications/Attachments/9946/Monetary %20Policy%20Statement%2021%20May%202020.pdf (Accessed 27 July 2020). [ Links ]
South African Reserve Bank. 2020c. Total expenditure - Consolidated general government: Education of which: Tertiary education. https://www.resbank.co.za/Research/Statistics/Pages/OnlineDownloadFacility.aspx (Accessed 22 April 2020). [ Links ]
South African Reserve Bank. 2020d. National government: Total expenditure. https://www.resbank.co.za/Research/Statistics/Pages/OnlineDownloadFacility.aspx (Accessed 25 April 2020). [ Links ]
Statistics South Africa. 2020. CPI History. http://www.statssa.gov.za/publications/P0141/CPIHistory.pdf? (Accessed 26 February 2020). [ Links ]
Teferra, Damtew and Phillip Altbachl. 2004. "African higher education: Challenges for the 21st century." Higher Education 47(1): 21-50. 10.1023/B:HIGH.0000009822.49980.30. [ Links ]
The Presidency. 2017. Report of the Commission of Inquiry into Higher Education and Training. Pretoria: The Presidency. https://www.justice.gov.za/commissions/feeshet/FeesCommissionReport-Full-20171113.pdf [ Links ]
UCT see University of Cape Town.
University of Cape Town. 1918. UCT Calendar 1918. Cape Town: UCT. [ Links ]
University of Cape Town. 1922. UCT Calendar 1922. Cape Town: UCT. [ Links ]
University of Cape Town. 1923. UCT Calendar 1923. Cape Town: UCT. [ Links ]
University of Cape Town. 1935. UCT Calendar 1935. Cape Town: UCT. [ Links ]
University of Cape Town. 2010. Annual Report 2010. Cape Town: UCT. http://www.staff.uct.ac.za/staff/finance/operations/annual-statements (Accessed 27 July 2020). [ Links ]
University of Cape Town. 2018. Annual Report 2018. Cape Town: UCT. http://www.staff.uct.ac.za/staff/finance/operations/annual-statements (Accessed 27 July 2020). [ Links ]
Visser, Wessel. 2004. Shifting RDP into GEAR: The ANC government's dilemma in providing an equitable system of social security for the "new" South Africa. Paper presented at 40th ITH Linzer Konferenz (Vol. 17). http://academic.sun.ac.za/history/downloads/visser/rdp_into_gear.pdf (Accessed 27 July 2020). [ Links ]
Wangenge-Ouma, Gerald. 2012. "Tuition Fees and the Challenge of Making Higher Education a Popular Commodity in South Africa." Higher Education 64(6): 831-844. 10.1007/s10734-012-9531-6. [ Links ]
Wangenge-Ouma, Gerald and Nico Cloete. 2008. "Financing higher education in South Africa: Public funding, non-government revenue and tuition fees." South Africa Journal of Higher Education 22(4): 906-919. https://hdl.handle.net/10520/EJC37467. [ Links ]
Zhang, Qilong, Ning Kang, and Ruth Barnes. 2016. "A Systematic Literature Review of Funding for Higher Education Institutions in Developed Countries." Front Educ China 11(4): 519-542. 10.1007/BF03397139. [ Links ]


