


Servicios Personalizados
Articulo
 Inglés (pdf)
 Articulo en XML
 Referencias del artículo
Indicadores

Links relacionados
-
 Citado por Google
 -
 Similares en Google
Compartir

 Permalink
South African Journal of Higher Education
versión On-line ISSN 1753-5913
S. Afr. J. High. Educ. vol.35 no.3 Stellenbosch jul. 2021
http://dx.doi.org/10.20853/35-3-3953
GENERAL ARTICLES
Demographic transformation and the influence of eleven selected socio-demographic variables on the face validity of an Engineering English for Specific Purposes approach at a South African university
J. MoyoI; C. C. MannII
IDepartment of Applied Languages Tshwane University of Technology Pretoria, South Africa e-mail: MoyoJ@tut.ac.za / http://orcid.org/0000-0002-4317-5674
IIDepartment of Applied Languages Tshwane University of Technology Pretoria, South Africa e-mail: MannC@tut.ac.za / http://orcid.org/0000-0002-1757-9552
ABSTRACT
In English for Specific Purposes (ESP), as accountable education, face validity, which could be an undesirable "negative" or a desirable "positive", is one of the ways in which we determine the learners' attitudes toward, and probable consequent motivation for, ESP learning programmes. In this study, we sought to explain the reactions of the 226 first year Engineering student respondents to Likert items by their sociodemographic characteristics. We measured and classified as an undesirable "negative" (if the mean was < 3.50), or a desirable "positive" (if the mean was > 3.50), the face validity generated by eleven sociodemographic characteristics for an ESP approach employed in the design and delivery of a compulsory ESP module (Engineering Communication) at a university in South Africa's Gauteng Province. We subjected the data to statistical significance testing with the ANOVA suite of inferential statistics to identify statistically significant relationships between the sociodemographic variables and the face validity variables, of which 20 were confirmed, and then measured the variance (influence) in the latter that could be associated with the former. The aggregate influence explainable by the sociodemographic variables was an eta2 of .908 (90.8%), of which High School Type (19.8%) recorded the most, and Engineering Work Experience (1,7%), the least. Whereas, Race was associated with the most "negative" influence, the Black1 and White groups were practically indistinguishable in attaining unequal, but "negative", scores. When we compared the sample demographic statistics to available institutional and national statistics to check for demographic transformation, the statistics suggested that the research university was transforming demographically at a fast pace, given its history.
Keywords: English for Specific Purposes, sociodemographic, demographic transformation, face validity
INTRODUCTION
Sociodemographic characteristics are studied for their influence on a range of dependent variables, from the academic performance, attitudes, and motivation of students across many disciplines, to multi-faceted constructs, such as the study experience and quality of life of students. Eleven sociodemographic characteristics were included for testing as one of the objectives in this study, whose main quest was to measure the degree of face validity generated by an Engineering ESP approach at a South African (SA) university (henceforth, the research university). Sociodemographics assume a particular importance in South Africa (SA), given the country's professed goal of demographic transformation of the post-school education sector, so that it reflects the sociodemographic distribution of the country, following the destructive social engineering of apartheid. This transformation seeks to correct the skewed social outcomes of racism, patriarchy, ageism, etc., in trying to create a fair and just society. In ESP, sociodemographic variables constitute components of the "identity" that students are assisted by different professionals to construct for themselves (Paltridge 2016, 74, 77; Zhang 2013, 3140).
This study, an explanatory and correlational component of a bigger study on face validity in ESP, aimed to determine, by means of statistical significance testing, the impact or influence of eleven sociodemographic variables on fifteen face validity variables (referred to as Likert items (LI), and by the item's original scale number). These sociodemographic variables are also explored in this study as potential factors of influence in the construction of a SA engineering identity. The following hypotheses were formulated and tested:
Null Hypothesis (Ho)
Each of the demographic variables 1-11 has no influence on each of the LI variables 1-15, if there are no statistically significant differences in the pairwise comparisons of the means of the subgroups being compared at an alpha significance level of less than 0.05 (α < 0.05).
Alternative Hypothesis (H1)
Each of the demographic variables 1-11 has an influence on each of the LI variables 1-15, if there are statistically significant differences in the means of the two or more groups in pairwise comparisons (α < .05). Notationally, the hypotheses are represented as follows (where μ is the population mean):
The following questions are answered: What proportion of the total variance is explained by the sociodemographics, and which ones (and their subgroups), represented a low face validity threat? How do the research sample statistics for race, gender, language and age compare with available directly and indirectly comparable institutional (research university) and national public university (PU) statistics, in the light of the constitutional and statutory vision of demographic transformation?
LITERATURE REVIEW
Transformation and demographic transformation concepts in SA higher education
During apartheid, sociodemographic characteristics were controlled by the law to oppress and discriminate against certain population groups. In the post-apartheid period, the South African Constitution (1996), the cornerstone of demographic transformation, prohibits oppression and discrimination through Article 9(3), in the Bill of Rights (Chapter 2), known as the Equality Clause. Article 2.24 of Education White Paper 3 articulates the goal of demographic transformation in higher education, thus:
"... [to] ensur[e] that the composition of the student body progressively reflects the demographic realities of the broader society. A major focus of any expansion and equity strategy must be on increasing the participation and success rates of black students in general, and of African, Coloured and women students in particular, especially in programmes and levels in which they are underrepresented". (South Africa 1997).
Debates have ensued on the conceptualisation and operationalisation of transformation, in spite of the seeming clarity of the policy framework. Govinder, Zondo and Makgoba (2013, 1) employed a mathematics-based Equity Index to calculate transformation, and concluded that it was slow, since no university attained the perfect score of zero. Cloete (2014, 1), and Universities South Africa (2015, 2) - a representative body of South African universities, criticised Govinder et al. (2013); Cloete, for "incorrect" definitions of equity and transformation; and, University South Africa, for presenting transformation as if it were a matter of staff research productivity. Rodny-Gumede and Chasi (2020, 220) articulate a post-Fees Must Fall, and, perhaps, more radical concept of transformation that goes beyond racial redress, and looks at the transformation of institutional cultures, communication, access, fees, staffing, curricula, pedagogy, teaching methodologies, etc. These transformation deliberations suggest two mutually-inclusive schools of thought on transformation: the pre-Fees Must Fall/Decolonisation school, which tends to emphasise demographics, and the post-Fees Must Fall/Decolonisation school, which tends to emphasise a broad scope for transformation.
Defining sociodemographics and ESP
For Salahuddin and Talukder (2017, 18), the term, "sociodemographic", refers to the convergence of sociology-related (sociological) and population-related (demographic) characteristics in describing social groups. Taking the cue from usage in the literature, we use the terms, "demographic", and, "sociodemographic", interchangeably. This study's focus is the basic demographics of race, gender, age, and language; the schooling-related ones: type of high school, type of English taken as a high school subject, and Grade 12 English achievement level; the university-related ones: levels of qualification, academic year (level) of study, and the engineering field enrolled for; and, the ESP-specific one: engineering work experience.
Whyte and Sarré (2017, 3) define ESP as "the branch of English language studies which concerns the language, discourse, and culture of English-language professional communities and specialised groups, as well as the learning and teaching of this object from a didactic perspective". ESP is viewed as customised language learning and teaching, wherein learner needs take precedence in course design and implementation, and face validity is a primary indicator of end-user satisfaction with course propositions. Needs analysis and authentic specialised materials are described by ESP purists as the defining features of ESP. Face validity is a feature originally associated with authentic specialised materials, but which has been expanded to include more course design processes and products, but, perhaps, still in a narrow sense that equates it with the verisimilitude of pedagogical practices and products. We approach it in this study from the broader educational psychology perspective of Nevo (1985, 288, 290), who defines it as the attitudes, opinions, and perceptions that non-experts form about the relevance, authenticity, specificity, usefulness, and desirability of teaching and learning processes and products, such as modules, qualifications, tests, lessons, etc. Face validity is valued in ESP, based on the belief that it renders curriculum processes and products realistic, thereby increasing the probability of achievement motivation (Hutchinson and Waters 1987, 166) - a desire which Schug and Le Cor (2017, 74) think has been sparsely supported by evidence. The concept, "motivation to learn", employed in this study, does not include intrinsic interest as a precondition for motivation, and, as such, characterises motivation as "long-term commitment to, and quality involvement in, the learning process" (Ames, in Lumsden 1994).
The underprepared-student and non-native English speaker status
Discursively, ESP learners are identified mainly by their language status as non-native or native speakers of English in English Second Language (ESL), English Foreign Language (EFL) or multilingual contexts. ESL countries, such as South Africa, are assumed to have high levels of English proficiency, because of the presumed widespread use of English in school, whereas, in reality, they produce learners who may struggle to cope with the demands of higher education, whom the system calls "underprepared learners". These learners struggle to meet the challenges of higher education academic literacy, defined as "those aspects of literacy required by contexts of learning and teaching that are highly dependent on reading and writing as vehicles for meaning construction, and whose context is customarily that of formal education" (Scott et al. 2007, 36, in Council on Higher Education (CHE) 2013, 58). Even though ESL students could be comparatively disadvantaged in SA higher education achievement tests by anything between 6 per cent and 25 per cent, they still embrace English as the language they want to learn, and be taught in (Sommerville and Singaram, 2018, 279; Webb 2006, 5-6). Alexander (2004, 119) attributes this embracement of English to "the rising black middle-class elite ... [who are] completely enthralled by the value of the English language for their own and their progeny's upward mobility". However, in the aftermath of "Fees Must Fall", some Engineering students have singled out English as a barrier to the optimal learning of Engineering in South Africa, and have attributed the difficulty of Engineering, the lack of engineers, and the high student failure rate in the subject, to its being taught in English, rather than in their home languages (Fomunyam 2017, 6801). In 2013, through to 2016, the foreign national, non-English speaker cohort constituted 7 per cent (about 6 326) of the close to one million students registered in SA public universities, of which 1 659 (26%) - the biggest proportion from a single country registered in undergraduate certificates and diplomas - were from the Democratic Republic of Congo (DRC), a francophone African country, and 1 782 (28%), from unspecified other countries (Department of Higher Education and Training (DHET)2 2015, 13; DHET 2018, 18).
Interconnected discursive practices in engineering: Race, age, gender, and scientism
SA legislation, such as the 1911 Mines and Works Act, and the Extension of University Education Act of 1959, ensured the reservation of Engineering education spaces and jobs for White males (Cruise 2011, 218; Kloot anad Rouvrais 2017, 192-193). English-medium universities, such as Wits University, and the University of Cape Town (UCT), protested against the racial segregation of universities (Scully and Desruisseaux 1986, in Kloot and Rouvrais 2017, 194), and later set up academic support programmes in English for the Black students that they were allowed to enrol in the 1980s - programmes which would set the foundation for ESP programmes in South Africa. It could, therefore, have come as no surprise that the first Black engineer to register as a professional engineer did so only in 1992, and the first woman, in 1997 (Cruise 2011, 218). The Engineering Council of South Africa's (ECSA 2014) National Engineering Skills Survey of 2013 suggests that Whites dominated all but one (the National Diploma category was at 44.1 per cent - dominated by the Black African group by just 2%) of the levels of Engineering qualifications of respondents, and the age category > 51 years. The Black, Asian, Coloured, and Indian demographics, however, dominated the < 30, 31-50 year categories, with the lowest being 35.5 per cent (Asian, 31-50 years), and the highest being 59.3 per cent (Black, 31-50 years). There appears to be some resistance from the older White male demographic to the transforming identity of the SA engineer (Cruise 2011), which is becoming younger and Black.
The worldwide participation rate of women in Science, Technology, Engineering, and Mathematics (STEM)3 was 23 per cent, in 2016, while ECSA reports that, of the 11 per cent of its total membership who are women, only 4 per cent were active professional engineers (Padayachee 2017). About 70 per cent of South Africa's Engineering female graduates do not practise the profession post-graduation (Nel 2014, in South African Government 2014). The most cited reason why women leave the profession everywhere is the pervasive gendered discursive bias in the field, which manifests, among other ways, in spotlighting: "the singling out of women by gender in ways that make them uncomfortable," (McLoughlin 2013, 373). Academia and professional practice spotlights women, when it channels them into discursively feminised Engineering disciplines and skills, such as Industrial and Biological Engineering, and the "feminine niches" within masculinised disciplines, such as Civil Engineering (Blosser 2017, 34-37), and feminised "non-engineering" disciplines and/or skills, such as communication and language skills (Noriko 2015, 2; Hong 2016, 3). This kind of channelling results in women's aversion toward performing feminised skills in intersectionally masculinised settings of engineering projects, as evidenced in an anecdote related by Marietjie van Rensburg (2018), an Engineering student at South Africa's Stellenbosch University. She complains about the reservation, for women, of compulsory "theoretical" responsibilities, exemplified by minutetaking, a language and communication-related skill, in engineering projects, which she perceives as a subtle act of gender bias.
As a discourse of power and prestige, the genderisation of disciplines resonates with such similar discourses as positivism, or "scientism", and its outcomes of epistemic snobbery, and the extreme of epistemicide. Epistemic snobbery operates by enacting epistemic dichotomies in which Humanities and Social Sciences disciplines are subordinated to STEM disciplines, and language or non-content disciplines to content disciplines. In these dichotomies, if non-STEM content disciplines are devalued as an inferior type of knowledge, for inadequate "scientificity", language disciplines are nullified as no knowledge or content, at all. This has engendered attempts in some "service" language education programmes to "masculinise" them by "de-linguifying" them; that is, by liquidating their language character by backgrounding language content, called the "real content" of language teaching by Dudley-Evans and St John (1998, 81), and then foregrounding subject-specific content, the "carrier content" of language teaching, to use Dudley-Evans and St. John's terminology again. Thus, any ESP approach that overlooks lexicogrammar, out of prejudice for language content, is an attempt at emptying a language programme of its "real content". Cameron (2002, 69) has, particularly, criticised the communicative skills approach for overlooking language content in preference to the transmission of Western cultural values. Benesch (2001, in Belcher 2006, 140) warns that an ESP practice that is too driven by a focus on subject-specific content risks neglecting the needs of L2 learners, and of such "minorities" as female students. An evaluation of "Engineering Communication", which was wholly based on the coursebook series written by David Ingre (2008), and titled, Engineering Communication: A practical guide to workplace communications for engineers, revealed that it was a communicative skills, ESP-type module that was not focused on language skills, nor on offering lexico-grammatical support to students, much less on the language skills needed by "underprepared" ESL students.
Despite the subordination of the taking of minutes as a non-engineering skill by a woman, studies in different countries reveal that, while Engineering students, as a category, exhibit "negative" attitudes toward, and low motivation for, English language learning, women tend to show positivity toward language learning (Cass and Fernandes 2008, in Kovac and Sirkovic 2017, 112). Studies by Kovac and Sirkovic (2017, 114) and Amengual-Pizzaro (2017, 41) observed positive attitudes of Engineering students towards English language learning that were not affected by gender, preparatory training, language level or high school differentiation, and those that were influenced by experience of learning. Johnson (2012, 88) found Japanese Engineering students to have expressed negative low impressions of English language course content, which, he concluded, seemed to have been transferred from high school because of being exhibited more by first-year students, which suggests lingering high school attitudes to be a probable low face validity threat.
METHODOLOGY
The respondents' sociodemographic profiles
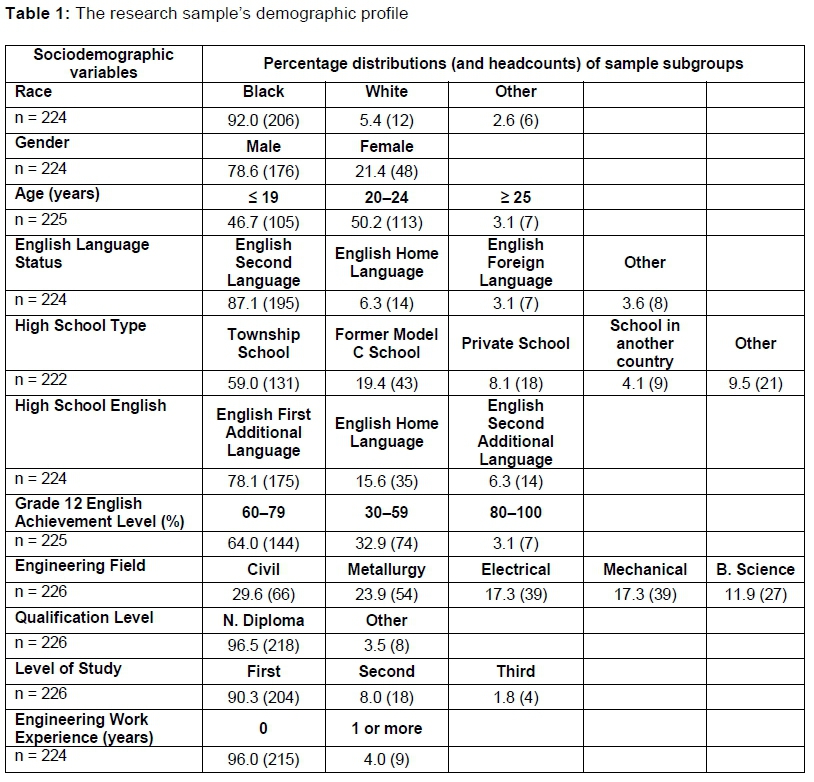
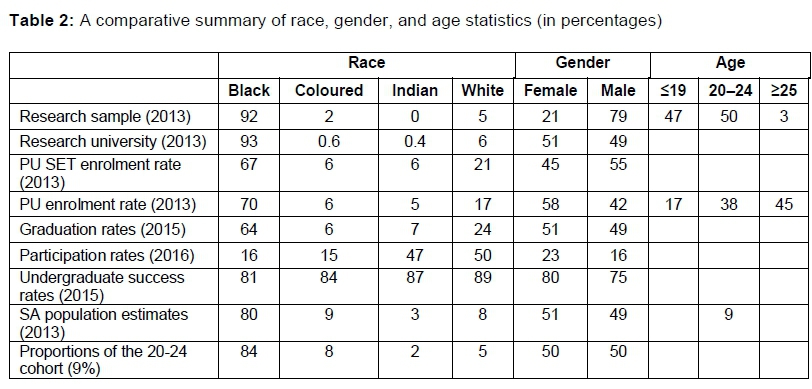
A purposive sample of 226 respondents was drawn from a population of first-year Engineering students registered for, and taught, the communication-skills-type ESP module, "Engineering Communication" (EC), at a campus of a SA university, in Gauteng Province (the research university). The sample, as shown in Table 1, was predominantly Black (92%), male (78.6%), ESL speakers (87.1%), English First Additional Language (EFAL) learners in high school (78.1%), registered for the National Diploma (96.5%), first-year university students (90.3%), and without engineering work experience (96%). As Table 2 shows, there were no respondents from the Indian population group, while the Coloured group were just under 2 per cent, and the original Other race groups, just under 1 per cent.
The institutional and national settings
Table 2 presents an illustrative comparison of research sample statistics, research university statistics, public university (PU) statistics (CHE 2015, 25-26; CHE 2018, 5), and national population estimates (Statistics South Africa 2014; 2018), which, albeit not perfect comparators, give an idea of how the research sample measured up against national statistics, with regard to demographic transformation. The research university, a public university, had, in 2013, a contact-mode headcount enrolment of 52 864 (of 54 159) - the biggest proportion of whom (22 173) were in SET programmes; 40 055 in undergraduate certificate and diploma programmes; 49 290 (93%) were Black, 304 (0.6%) Coloured, 213 (0.4%) Indian/Asian, and 3 057 (6%) White; 13 593 were first-time entering students; 25 943 (49%) were male, and 26 921 (51%), female.
Data collection instruments
A self-designed questionnaire was deployed to collect qualitative nominal demographic data, and quantitative interval data (Likert scale), for the computation of descriptive and inferential statistics on SPSS Version 25. The Likert scale, with fifteen items, and a Cronbach's alpha of .671, was a five-point scale with "strongly disagree" (coded 1), "not sure" (coded 3) "strongly agree" (coded 5), as the meaningful scale levels. The item means were indexical of a "negative" and undesirable low degree of face validity, if they were < 3.50, and of a "positive" and desirable high degree of face validity, if they were > 3.50.
Data analysis
We ran the ANOVA omnibus test, preferred to the non-parametric Kruskal-Wallis (ANOVA) and Mann-Whitney (T-Test) tests, for its statistical power, to identify statistically significant associations between demographic (nominal-independent) and Likert item (interval-dependent) variables; followed by the One-Way ANOVA, for comparing the means of three subgroups; and the Independent Samples T-Test (T-Test), for comparing two subgroups. The post hoc tests, Scheffe and Games-Howell, were also run, on the counsel of Grande (2015), for whom the Scheffe is appropriate for groups with unequal sample sizes, but homogeneous mean variances, and the Games-Howell, for groups with unequal sample sizes, and unequal mean variances, which were confirmed with the robust Welch's Test. The eta-squared (eta2) statistic, a non-standardised measure of variance (Lakens 2013, 5), was computed to measure the strength of variable interdependence. To determine the total proportional variance for a demographic variable, the eta2 values of compatible subgroup means ("positive" + "positive") were summed up, while those of discordant group means ("negative" + "positive") were split by the number of the subgroups with statistically significant mean differences. Descriptively, eta2 values can be interpreted as small (.01), medium (.06), or large (0.14) (Cohen 1988, in Lakens 2013, 7).
ANALYSIS AND DISCUSSION OF FINDINGS
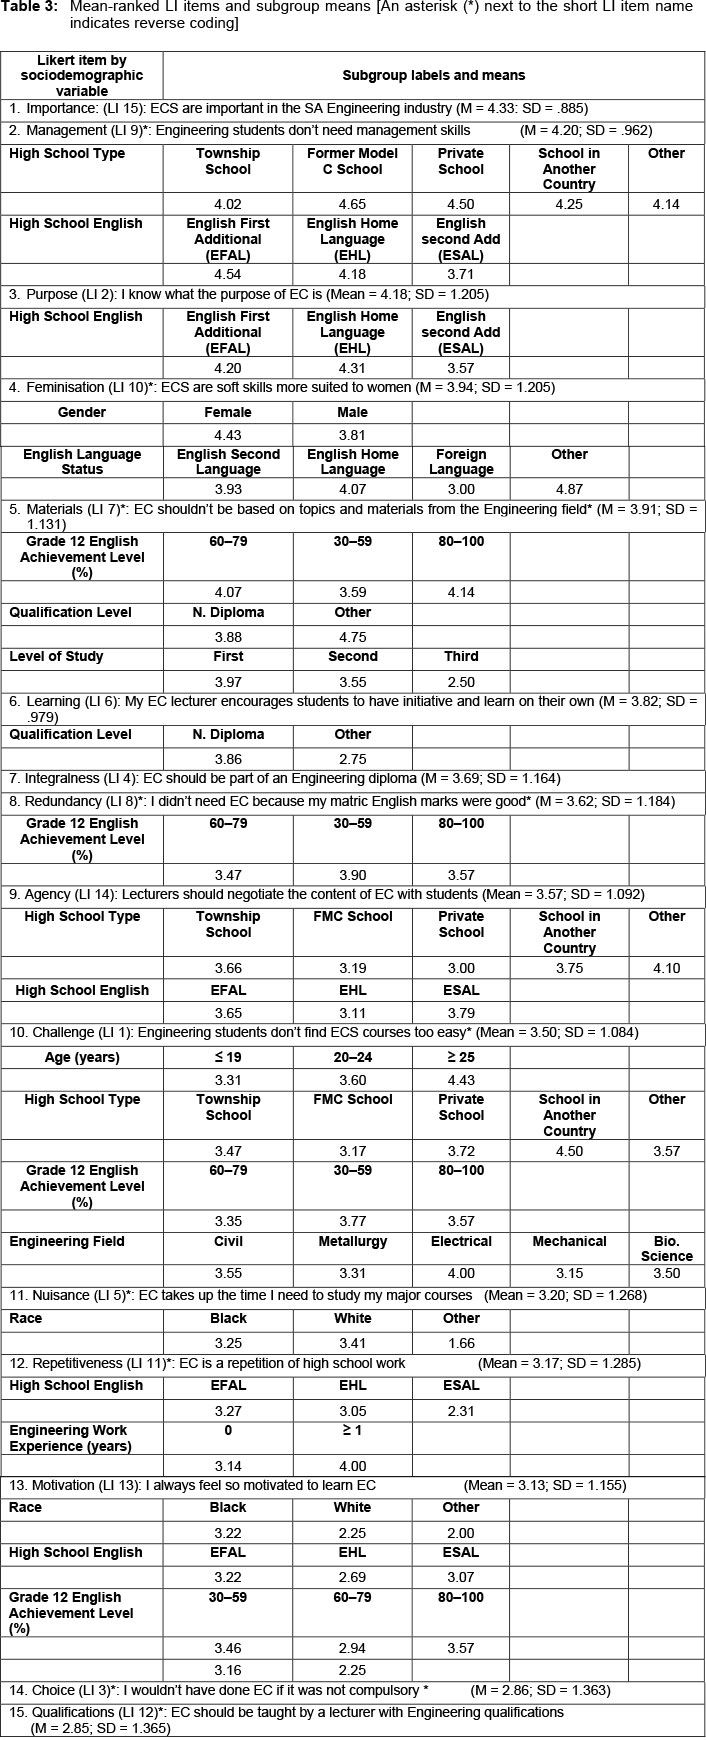
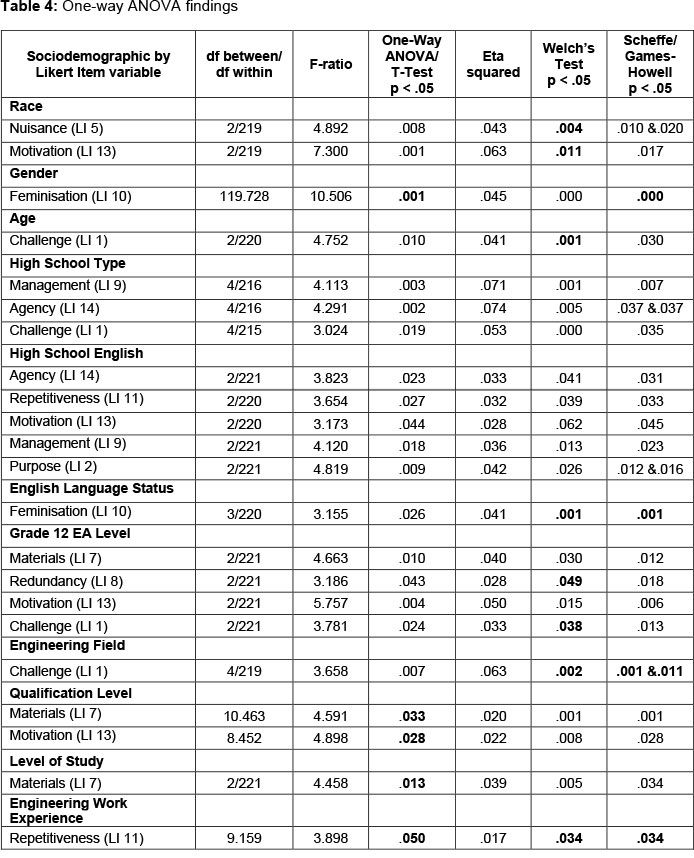
Table 3 shows the following sample descriptive statistics: rank-ordered sample means and standard deviations, and subsample means; while Table 4 shows the inferential statistics. There were, in total, thirty statistically significant relationships identified, implying that the Null Hypothesis was rejected 30 times on the ANOVA. Only 20 of these were confirmed by Welch's Test and post hoc testing (see Table 4).
The data in Table 3 show that Importance (LI 15) recorded the highest mean of 4.33, while Qualifications (LI 12) registered the lowest of 2.85. Two-thirds (or 10) of the item means were indicative of a high degree of face validity, which was achieved by a mean psychological or attitude tendency of 3.50 (or above), whereas, a third (or 5) recorded means indicative of a low degree of face validity, which was attainable through a mean score of below 3.50.
It could, therefore, be concluded that, on average, the sample group of 226 respondents generated a high degree of face validity for the ESP approach, which prompts the question whether there was consequent "motivation to learn", as posited in ESP theory.
The reconciliation of the eta2 data in Table 4, as described in the Methodology section, shows that the eleven sociodemographics recorded 90.8 per cent of aggregated, explained influence (variance), with virtually equal proportions of "negative" (44.25%) and "positive" (44.65%) influence. Three variables recorded "large" aggregate influences (> 14%); namely, High School Type (19.8%), High School English (17.1%), and Grade 12 English Achievement Level (15.1%). Two variables, Race (10.6%), and Engineering Field (6.3%), recorded "medium" influence levels (> 6%), while six variables recorded "small" influences (< 6%, and > 1%).
Two of the four variables with a "large" influence had a predominant influence that was "positive", with that of the first, High School Type, even classifiable as "large" at 13.5 per cent, and, the second, High School English, as "medium" at 9.45 per cent. Race, with 10.6 per cent of variance, had the highest "negative" influence, followed by Grade 12 English Achievement Level, with 8.05 per cent, High School English, with 7.65 per cent, and High School Type, with 6.3 per cent. Gender and English Language Status registered no "negative" influence. The remaining five sociodemographics registered equal "negative" and "positive" influences, ranging from 3.15 per cent, for Engineering Field, down to 0.85 per cent, for Engineering Work Experience.
Race, the biggest threat of low face validity, recorded two interdependence relationships, with Nuisance (LI 5; p = .008), and Motivation (LI 13; p = .001), and three pairs of subgroups with statistically significant mean differences. The Black (M = 3.25; p = .010) and White (M = 3.41, p = .020) groups differed statistically significantly with the Other group (M = 1.66), both on Nuisance (LI 5), that is, on agreeing or disagreeing with the sentiment that EC took up the time that they could use to study their majors, with 4.3 per cent of variance, with the Other group agreeing with the sentiment, and the two groups almost disagreeing. The Black (M = 3.22) and White (M = 2.25; p = .017) groups differed statistically significantly on self-declarations of motivation to learn EC (LI 13), with 6.3 per cent of variance, with both having a "negative" influence on the variable. The three subgroups each recorded two frequencies of "negative" influence, the Other group (Coloured, and the original Other) for probably believing that EC was a nuisance (LI 5), a belief that was almost shared by the Black and White groups. The "negative" influence of the Black and White subgroups came from respective declarations of "negative" inconclusive and downright low levels of motivation to learn EC (LI 13), which represented the biggest threat of low face validity, because of the "necessity" of the theoretical relationship between face validity and motivation in ESP, as theorised by Hutchinson and Waters (1987, 166). Schug and Le Cor (2017, 89) could have a point in describing the theorised causal link between authentic highly specialised materials, face validity, and motivation in ESP as "folk assumptions" not grounded in empirical evidence. However, it should be noted that EC, as a coursebook-based course, did not necessarily employ a strict ESP course design that prescribes a needs analysis, and authentic specialised materials, which are theorised as the main sources of face validity, and consequent motivation to learn in ESP - a view that Schuq and Le Cor also dismiss as unsupported by empirical evidence.
The research sample's race statistics (see Table 2) reflect the research university's more than it does the public university's (PU) SET enrolment race statistics. The 93 per cent representation of Black students at the campus, an erstwhile White-designated institution, versus the 92 per cent of the sample, shows how the race statistics have swung from one extreme to the other over the 15 or so years of the university's reconstitution and rebranding in a reconfigured system that began in 2000. However, there is still about a 10 per cent points-gap between the Black demographic's PU enrolment rates and population estimates, which is similar to the gap between the White demographic's population estimates and PU enrolment rates (see Table 2), except that the first gap reflects "underrepresentation", whereas the second points to "overrepresentation". The disparity is, again, brought into stark relief by low participation rates hovering around 16 per cent for the Black and Coloured demographics, and by high ones hovering around 50 per cent for the White and Indian/Asian demographics. With an enrolment count of 975 837 in 2016, the age-group data points in Table 2 show that, if the SA's PU system admitted only 20-24 year-old SA citizens, it would, so far, have had capacity for not more than 20 per cent of the cohort. The absence (0%) of the Indian demographic, and the almost negligible presence (2%) of the Coloured group, in the research sample, also reflect in the research university's statistics, wherein the two population groups make up just 1 per cent of the enrolment figures. The two population groups, together with the Black group, have, meanwhile, been increasing their participation in the SA private university sector from 2011 to 2016 (DHET 2018, 29).
The race statistics foreshadow the language statistics, embedded here in the sociodemographic variables, English Language Status, and High School English. The research sample's ESL distribution of 87 per cent reflected the fact of South Africa as an ESL context, as described by Dudley-Evans and St John (1998). English Language Status registered one statistically significant association, with Feminisation (LI 10; p = .010), and one pair of subgroups with statistically significant but "positive" mean differences, the ESL group (M = 3.93), and the Other group (M = 4.87; p = .001), with an explained variance of 4.1 per cent.
The presence of non-English First Additional Language (EFAL) and non-English as Home Language (EHL) learners at the research university was confirmed, as well as that of learners, who had attended a School in Another Country, who collectively constituted about 6.7 per cent of the sample. Combined, English as a Second Language (ESL) and English as a Foreign Language (EFL) groups constituted a minimum of 90 per cent of all the students, who were non-native speakers of English, who probably constituted the majority of the underprepared students, as identified by the CHE Report (2013), and some of whom might not even have wanted to study Engineering in English, as reported in Fomunyam's (2017) study. In the 90 per cent are the about 6 per cent, who probably had not even attended high school in English, but rather in French, in the Democratic Republic of Congo (DRC). Given that apartheid South Africa's higher education had a history of only accommodating Black students, and that not much transformation of institutional cultures has taken place since new institutions were configured, as argued by Rodny and Chasi (2020, 221), what are the chances of the English language learning needs of the majority of students, who may be underprepared, non-native speakers of English, being addressed by "Engineering Communication", a module that did not prioritise language learning content?
High School English produced five interdependence relationships, with Agency (LI 14; p = .023), Repetitiveness (LI 11; p = .027), Motivation (LI 13; p = .044), Management (LI 9; p = .018), and Purpose (LI 2; p = .009). These produced six pairs of subgroups with statistically significant mean differences, and a "large" aggregate variance of 17.1 per cent (7.65%, "negative"; 9.45%, "positive"). Having done EHL (M = 4.54) and ESAL (M = 3.71; p = .023), with a variance of 3.6 per cent, influenced Management (LI 9) positively. While the influence on Purpose (LI 2) of having done ESAL (M = 3.57) was statistically significantly different from that of having done EHL (M = 4.31; p = .012) and EFAL (M = 4.20; p = .016), with a variance of 4.2 per cent, they were all "positive" - suggesting that all the groups agreed with the assertion that they knew the purpose of "Engineering Communication". The "negative" influence on Repetitiveness (LI 11), both of having learnt EFAL (M = 3.27) and ESAL (M = 2.31; p = .033), with a variance of 3.2 per cent, pointed to both groups agreeing, rather "negatively", but statistically significantly differently, with the belief statement that EC was a repetition of high school content. The impact on Motivation (LI 13), both of having learnt EHL (M = 2.69) and EFAL (M = 3.22; p = .045), with a variance of 2.8 per cent, was "negative", but statistically significantly different - suggesting that the two groups declared that they were not motivated to learn EC. The influence on Agency (LI 14), with a 3.3 per cent variance, of having learnt EHL (M = 3.11), was "negative", and statistically significantly different from the "positive" influence of EFAL (M = 3.65; p = .031). EFAL had three frequencies of "negative" influence, and one of "positive"; ESAL, three of "positive" influence, and one of "negative"; and, EHL, two of "positive", and two of "negative", influence.
It is evident in Table 2 that the research sample's gender distribution lacks correspondence with national SET enrolment rates, which was expected, since the sample comprised only Engineering respondents, not the whole of the SET field. Public university SET enrolments revealed a narrowing of the gender disparity to 10 per cent points (55%, for males, versus 45%, for females), which indicates a growing availability of engineering skill potential in the women's demographic, whereas the research sample showed a male-dominant gender gap of 57.7 per cent points. The low participation and high attrition rates for women in engineering professional practice as reported by ECSA (Padayachee 2017) and Nel (South African Government 2014), believed to be caused mainly by an endemic hegemonic masculinity culture, which renders the environment hostile to women (Blosser 2017), remain a concern.
Gender was interdependent only with Feminisation (LI 10; p = .001), with observed statistically significant, but "positive", differences between the influences of the Female (M = 4.43) and Male (M = 3.81; p = .001) subgroups, and an explained variance of 4.5 per cent. Predictably, the Female subgroup disagreed more intensely with the feminised sentiment about ECS than the Male subgroup, which, while confirming the positivity reported in the studies by Cass and Fernandes (2008, in Kovac and Sirkovic 2017, 112) problematises the negative reaction of Marietjie van Rensburg (2018), the female Engineering student from Stellenbosch University, toward being assigned minuting duties. However, it should be recognised that her point is that the responsibility should also be borne by male students, not just by female students. The rejection by the Male group of the sexist sentiment in Feminisation (LI 10) could signal a change in the attitudes of the male group toward language-related skills and engineering skills. "Positive" sentiments about women in Engineering have become even more important, since the imminent attainment of numerical parity in women's SET university enrolment figures, and graduation rates (as shown in Table 2, women have actually surpassed men in SET graduation rates), has not changed the picture of participation rates in professional practice for women, which still looks bleak, according to Nel (in SA Government 2014). It would, therefore, appear as if this change in attitude may be needed more in the "field" of engineering professional practice and in faculty, as coded sexism may still be an issue in these areas, than in Engineering students, although the experiences of Marietjie van Rensburg (2018) point to continuing subtle acts of patriarchy at the micro-level. Issues to explore further, however, are whether and how Engineering students construct their identities, as Zhang (2013) discovered, for Business English students in China, whether the multiple identities include an ESL learning identity, and a professional identity. And, if they do, whether the interaction between these identities may not offer explanations for what has been seen as divergence between belief and practice, which manifests itself in how Engineering students may view English language skills modules as necessary to Engineering qualifications and practice, as challenging, even as too difficult (Johnson 2012), or not as soft skills suited only to women, which should not be included in their qualifications. The explanation could be a simple matter of the traditional and strict division between the sciences and the humanities - which has led to the epistemological hierarchy that places the sciences at the top, and languages at the bottom, so that, no matter how difficult or challenging a language module is, it will still be seen as not worthy of being studied, much less by aspiring engineers, because it does not attract prestige and social value.
CONCLUSIONS
The "positive" influence, in respect of High School Type, was associated with School in Another Country, Other School, and Township School, and the "negative" influence, mainly with FMC School, and somewhat, with Private School. In regard to High School English, EFAL was associated with the most "negative", and ESAL, with the most "positive", influence. Motivation to Learn (LI 13) - motivation being a key theoretical consideration in ESP, was influenced "negatively" by all the four demographic variables with which it had interdependence. Although the Black group was likely to be more motivated than White and Other groups, all these groups associated with "negative" influence. EFAL groups were likely to be more motivated than EHL and ESAL groups, while lower score groups were likely to be more motivated than higher score groups. The White demographic still dominates engineering practice, but the picture is changing in Engineering education and professions, with increasing participation by younger people and Black people, who may hold different attitudes towards the discursive meaning of Engineering as a discipline. While women are doing well in Engineering education, they do not seem to feel welcome in Engineering professional practice.
ACKNOWLEDGEMENTS
We would like to express our appreciation to the Department of Applied Languages for according Joseph Moyo study leave to complete his doctoral research project, to the Faculty of Engineering, for their co-operation and assistance, and to Tshwane University of Technology, for their support throughout this study.
NOTES
1 . This term is preferred, and is used throughout, rather than "African", a throwback to the apartheid era.
2 . The CHE and the DHET warn that the percentage totals in their reports may not add up to 100 per cent.
3 . SET and STEM are interchangeable. The CHE and DHET documentation prefer SET, which incorporates Mathematics under Science.
REFERENCES
Alexander, N. 2004. "The politics of language planning in post-apartheid South Africa." Language Problems & Language Planning 28(2): 113-130. https://www0.sun.ac.za/taalsentrum/assets/files/Alexander%20Lang%20Planning%20in%20Post-Apartheid%20SA.pdf (Accessed 2 February 2019). [ Links ]
Amengual-Pizzaro, M. 2017. "Engineering students' motivational variables towards English and the learning of the English language." Revista de Lenguas para Fines Específicos 23(1): 31-44. http://dx.doi.org/10.20420/rlfe.2017.156 [ Links ]
Belcher, D. D. 2006. "English or Specific Purposes: Teaching to perceived needs and imagined futures in worlds of work, study and everyday life." TESOL Quarterly 40: 133-56. [ Links ]
Blosser, E. 2017. "Gender segregation across engineering majors: how engineering professors understand women's underrepresentation in undergraduate engineering." Engineering Studies 9(1): 24-44. doi:10.1080/19378629.2017.1311902. [ Links ]
Cameron, D. 2002. "Globalization and the teaching of 'communication skills'." In Globalization and language teaching, ed. D. Block and D. Cameron, 67-82. London: Routledge. [ Links ]
CHE see Council on Higher Education.
Cloete, N. 2014. "A new look at demographic transformation: Comments on Govinder et al. (2013)." South African Journal of Science 110(1/2): 1-4. https://doi.org/10.1590/sajs.2014/a0048. [ Links ]
Council on Higher Education. South Africa. 2013. A proposal for undergraduate curriculum reform in South Africa: The case for a flexible curriculum structure. Discussion Document, Pretoria: CHE. http://www.che.ac.za/sites/default/files/publications/Full_Report.pdf (Accessed 15 March 2016). [ Links ]
Council on Higher Education. 2015. South Africa. VitalStats: Public higher education 2014. Pretoria: Council on Higher Education. https://www.che.ac.za/sites/default/files/publications/Vital%20Stats%202013_web_0.pdf (Accessed 28 August 2018). [ Links ]
Council on Higher Education. 2018. South Africa. VitalStats: Public higher education 2016. Pretoria: Council on Higher Education. https://www.che.ac.za/sites/default/files/publications/CHE_VitalStats_2016%20webversion.pdf (Accessed 28 August 2019). [ Links ]
Cruise, J. A. 2011. "The gender and racial transformation of mining engineering in South Africa." The Journal of the Southern African Institute of Mining and Metallurgy 111: 217-224. https://www.saimm.co.za/Journal/v111n04p217.pdf (Accessed 2 March 2019). [ Links ]
Department of Higher Education and Training. South Africa. 2015. Statistics on Post-School Education and Training in South Africa: 2013. http://www.dhet.gov.za/DHET (Accessed 28 July 2019). [ Links ]
Department of Higher Education and Training. South Africa. 2017. Statistics on Post-School Education and Training in South Africa: 2015. http://www.dhet.gov.za/DHET (Accessed 28 July 2019). [ Links ]
Department of Higher Education and Training. South Africa. 2020. Statistics on Post-School Education and Training in South Africa: 2018. http://www.dhet.gov.za/DHET (Accessed 30 March 2020). [ Links ]
Dudley-Evans, T. and M. J. St John. 1998. Developments in English for Specific Purposes: a multi-disciplinary approach. Cambridge: Cambridge University Press. [ Links ]
ECSA see Engineering Council of South Africa.
Engineering Council of South Africa. 2014. National Engineering Skills Survey December 2013. https://www.ecsa.co.za/news/Surveys%20PDFs/200215_ECSA_National_Engineering _Skills_Survey_Report_April_2014.pdf (Accessed 28 July 2019). [ Links ]
Fomunyam, K. G. 2017. "Decolonising the Engineering curriculum in a South African University of Technology." International Journal of Applied Engineering Research 12(17): 6797-6805. https://www.ripublication.com/ijaer17/ijaerv12n17_68.pdf (Accessed 28 July 2019). [ Links ]
Govinder K. S., N. P. Zondo, and M. W Makgoba. 2013. "A new look at demographic transformation for universities in South Africa." South African Journal of Science 109(11/12): 1-11. http://dx.doi.org/10.1590/sajs.2013/20130163. [ Links ]
Grande, T. L. 2015. ANOVA with Games Howell post hoc test in SPSS. https://www.youtube.com/watch?v=oagLeAOaevk. (Accessed 15 June 2017). [ Links ]
Hong, R. 2016. "Soft skills and hard numbers: gender discourse in human resources." Big Data and Society. http://journals.sagepub.com/doi/pdf/10.1177/2053951716674237. (Accessed 15 March 2017). [ Links ]
Hutchinson, T. and A. Waters. 1987. English for Specific Purposes: A learning-centred approach. Cambridge: Cambridge University Press. [ Links ]
Johnson, M. P. 2012. "Examining EFL motivation in Japanese engineering students." The Asian ESP Journal Summer: 79-102. http://asian-esp-journal.com/wp-content/uploads/2013/11/Volume-8-2.pdf (Accessed 1 February 2015). [ Links ]
Ingre, D. 2008. Engineering Communications: Practical Guide to Workplace Communications for Engineering Students. Belmont, CA: Wadsworth, Inc. [ Links ]
Kloot, B. and S. Rouvrais. 2017. "The South African engineering education model with a European perspective: History, analogies, transformations and challenges." European Journal of Engineering Education 42(2): 188-202. doi: 10.1080/03043797.2016.1263278. [ Links ]
Kovac, M. M. and N. Sirkovic. 2017. "Attitudes towards Communication Skills among Engineering students." English Language Teaching 10(3). http://doi.org/10.5539/elt.v10n3p111. [ Links ]
Lakens, D. 2013. "Calculating and reporting effect sizes to facilitate cumulative science: A practical primer for t-tests and ANOVAs." Frontiers in Psychology 4. https://www.ncbi.nlm.nih.gov/pubmed/24324449 (Accessed 28 July 2017). [ Links ]
Lumsden, L. S. 1994. "Student motivation to learn." Eric Digest No. 2. https://www.ericdigests.org/1995-1/learn.htm (Accessed 28 July 2019). [ Links ]
McLoughlin, L. A. 2013. "Spotlighting: Emergent Gender Bias in Undergraduate Engineering Education." The Research Journal for Engineering Education. https://doi.org/10.1002/j.2168-9830.2005.tb00865.x. [ Links ]
Nevo, B. 1985. "Face validity revisited." Journal of Educational Measurement 22(4): 287-293. https://www.jstor.org/stable/1434704?seq=1#page_scan_tab_contents (Accessed 5 July 2017). [ Links ]
Noriko, I. 2015. "Gender Differences among Engineering Majors in Their Attitudes and Motivation toward Learning English." http://www.toyo.ac.jp/uploaded/attachment/17145.pdf (Accessed 28 July 2017). [ Links ]
Padayachee, P. 2017. "We have too few women engineers in South Africa: here's what we can do to fix that." Huffington Post Blog. https://www.huffingtonpost.co.za/priyanka-padayachee/we-have-too-few-women-engineers-in-south-africa_a_21703682/ (Accessed 28 July 2018). [ Links ]
Paltridge, B. 2016. "Developments in English for Specific Purposes Research." On CUE Journal 9(2): 73-85. https://jaltcue.org/files/OnCUE/OCJ9.2/OCJ9.2_pp73-85_Paltridge.pdf (Accessed 3 March 2018). [ Links ]
Rodny-Gumede, Y. and C. T. Chasi. 2020. "Metaphors of transformation of education and fitness for purpose: Towards a humanizing agenda." South African Journal of Higher Education 34(1): 213230. https://www.journals.ac.za/index.php/sajhe/article/view/3147 (Accessed 1 April 2020). [ Links ]
Salahuddin, S. and H. K. Talukder. 2017. "Influence of sociodemographic characteristics on academic performance of medical students." Bangladesh Journal of Medical Education 8(2): 18-23. http://dx.doi.org/10.3329/bjme.v8i2.33332. [ Links ]
Schug, D. and G. Le Cor. 2017. "Towards a dynamic approach to analysing student motivation in ESP courses." In New developments in ESP teaching and learning research, ed. S. Whyte and C. Sarré, 73-92. https://hal.archives-ouvertes.fr/hal-01657477/file/NewDevelopmentsESP_CSSW_2017.pdf (Accessed 28 July 2019). [ Links ]
Sommerville, T. and V. S. Singaram. 2018. "Exploring demographic influences on students' academic performance over a five-year programme." South African Journal of Higher Education 32(2): 273-287. http://dx.doi.org/10.20853/32-2-2054. [ Links ]
South African Constitution. 1996. The Constitution of the Republic of South Africa as adopted by the Constitutional Assembly on 8 May 1996 and as amended on 11 October 1996. Pretoria: Government Printer. http://www.justice.gov.za/legislation/constitution/SAConstitution-web-eng.pdf (Accessed 20 June 2019). [ Links ]
South Africa. 1997. Department of Education. Education White Paper 3: A programme for the transformation of higher education. 24 July 1997. https://www.che.ac.za/sites/default/files/publications/White_Paper3.pdf (Accessed 28 July 2017). [ Links ]
South African Government. 2014. Women in engineering: Gender dynamics. Media Statements. https://www.gov.za/women-engineering-gender-dynamics (Accessed 28 July 2017). [ Links ]
Statistics South Africa. 2014. Mid-year population estimates, 2014. https://www.statssa.gov.za/publications/P0302/P03022014.pdf (Accessed 28 July 2017). [ Links ]
Statistics South Africa. 2018. Mid-year population estimates, 2018. http://www.statssa.gov.za/publications/P0302/P03022018.pdf (Accessed 28 July 2017). [ Links ]
Universities South Africa. 2015. Reflections on Higher Education Transformation. Discussion paper prepared for the second national Higher Education Transformation Summit, 15-17 October, 2015. http://www.justice.gov.za/commissions/FeesHET/docs/2015-HESummit-Annexure05.pdf (Accessed 28 July 2019). [ Links ]
Van Rensburg, M. M. J. 2018. An Engineer's View: "My Experience as a Female Engineering Student". https://www.saimeche.org.za/news/388797/An-Engineers-View-My-Experience-as-a-Female-Engineering-Student.htm (Accessed 15 May 2019). [ Links ]
Webb, V. 2006. "English in higher education in South Africa: Inclusion or exclusion." MIDP symposium, Bloemfontein, 24-27 April, 2006. https://www.uac.za/media/shared/Legacy/sitefiles/file/46/10824/papers/engexclusion.doc (Accessed 10 July 2017). [ Links ]
Whyte, S. and C. Sarré. 2017. "Introduction to new developments in ESP teaching and learning research." In New developments in ESP teaching and learning research, ed. S. Whyte and C. Sarré, 1-14. https://hal.archives-ouvertes.fr/hal-01657477/file/NewDevelopmentsESP_CSSW_2017.pdf (Accessed 28 July 2019). [ Links ]
Zhang, Z. 2013. "Identities in needs analysis for Business English students." ESP Today 1(1): 26-44. http://www.esptodayjournal.org/pdf/2.%20ZUOCHENG%20ZHANG%20-%20full%20text.pdf (Accessed 28 July 2017). [ Links ]

