


Servicios Personalizados
Articulo
 Inglés (pdf)
 Articulo en XML
 Referencias del artículo
Indicadores

Links relacionados
-
 Citado por Google
 -
 Similares en Google
Compartir

 Permalink
South African Journal of Higher Education
versión On-line ISSN 1753-5913
S. Afr. J. High. Educ. vol.35 no.3 Stellenbosch jul. 2021
http://dx.doi.org/10.20853/35-3-3887
GENERAL ARTICLES
Counting what counts: a researcher productivity scoring framework for South Africa's universities of technology
M. MasindeI; J. CoetzeeII
ICentre for Sustainable SMART Cities Central University of Technology, Free State Bloemfontein, South Africa e-mail: muthonimasinde@gmail.com / https://orcid.org/0000-0002-8914-0055
IIDepartment of Economics and Finance University of the Free State Bloemfontein, South Africa e-mail: CoetzJ@ufs.ac.za / https://orcid.org/0000-0001-8457-8261
ABSTRACT
One of the three objectives of academic institutions all over the world is that of ensuring and upholding vibrant research productivity. For developing countries such as South Africa, public spending on research and development provides mechanisms for this. The South Africa's Department of Higher Education and Training (DHET) is the custodian of government research funds. Evidence shows that DHET continues to grapple with the challenge of objectively measuring research productivity from the research funds invested in universities. The current funding framework applied by DHET has received numerous criticism one of them being its quantitative nature - it rewards quantity as opposed to quality research. This problem is more pronounced in Universities of Technology (UoTs) where, after more than ten years of operating as universities, the culture of research is not yet fully entrenched. Acknowledging the critical role played by research productivity measurements, we present a research productivity and quality measurement framework for UoTs. Using a case study of one of the UoTs, quantitative data relating to 48 aspects of the of existing research incentive system was used in determining the system's effectiveness and efficacy in stimulating researchers' activities. The proposed Framework consists of three components on: how to motivate researchers, what/how to measure research performance and how to incentivise researchers. Using an actual dataset of research outputs from the case study, an illustration on how to apply the framework has been provided. The results confirm our Framework's ability to "count what counts" and proven the statement that "not everything that can be counted counts".
Keywords: research incentive system, research productivity score, Universities of Technology (UoTs), Central University of Technology, Free State (CUT).
INTRODUCTION
Background
The global changes sweeping across the higher education sector have resulted in pressure on universities to produce more research outcomes and hence resulting in more competitive funding and research performance evaluation systems (Sutton and Brown 2016). This has led to increased external administrative control over researchers and their work (Humphrey and Gendron 2015) as well as cascading effects of increased competition among individual researchers, universities/research institutes, countries and even among different journals (Adler and Harzing 2009). With this dynamism, the kitty for financing research activities is becoming smaller and the competition for this slice has become stiffer. The universities are finding themselves having to answer the question: "How do we encourage research staff to engage in research projects that are viewed favourably by grant committees?"
In answering this question, universities in South Africa and elsewhere in the world have designed incentive schemes for researchers. However, evidence indicates that most of these incentives are ineffective and have in most cases been viewed as "rewards" for when these activities did occur (Andersen and Pallesen 2008; Derrick and Bryant 2013). Empirical studies further reveal that some of these incentive systems have led to negative or malfunctioning research performance enhancement (Sutton and Brown 2016). One of the reasons for the negative results is the perceived element of "control" that diminishes the power of autonomous motivation - which refers to "when people act out of their own volition and self-endorsement" (Ryan and Deci 2000, cited in Sutton and Brown 2016).
With the self-determination theory (Reeve 2012) in mind, as well as the need to increase research outputs top on the agenda, the top management at one of South Africa's Universities of Technology (UoTs) reached a decision to develop explicit measures to redress the low research outputs dilemma. To this end, a number of both momentary and non-monetary incentives were put in place in 2013 with the view to motivate academic staff members to carry out research. These include the provision for staff members to (directly into their bank accounts) financially benefit from the Department of Higher Education and Training (DHET) subsidy to the University. Results from the latest DHET Research Outputs Report show only a marginal improvement in research outputs at the UoT - an indication that the incentives have not been effective (DHET 2017).
Research aims and objectives
The overall aim of this research was to develop a research incentive framework for academic staff members at South African Universities of Technology. This was achieved through the following objectives:
• To carry out detailed review of various monetary and non-monetary employee reward programmes in use globally and in South Africa's UoTs;
• To investigate the effectiveness of the existing research incentive system in use at one of the UoTs; and
• To develop a framework measuring research productivity for South Africa's UoTs.
RESEARCH INCENTIVE SYSTEMS
Intrinsic research systems and autonomous motivation
Research incentive systems should be designed around the researchers as they are the ones who produce the research outputs at the end of the day (Stoyanov 2017). Such systems should enable their autonomy, creativity, flexibility and innovation (Derrick and Bryant 2013). Success to this revolves around the ability to keep the researchers intrinsically motivated as this enhances persistence, creativity and cognitive flexibility. One of the most common incentive systems used is direct financial incentive scheme that is aimed at adding a financial package to motivating researchers to engage in activities geared towards increased research production (Carr 2009; Frey and Neckermann 2008; Larkin, Pierce, and Gino 2012; Derrick and Bryant 2013). However, Andersen and Pallesen (2008), citing empirical findings on Motivation Crowding Theory (MCT), attests that finances do not always appeal to people's intrinsic motivation. This position is further affirmed in (Ryan and Deci 2000).
When it comes to research, it has been argued that autonomous motivation is the "sacred spark" that keeps researchers focused on carrying out the research, despite whatever challenges/obstacles they may face. To this end, the findings by Sutton and Brown (2016) revealed three autonomous motivational factors: (i) passion for doing research which constitutes outcomes and contribution of their research, involvement in the research process itself and their inherent interest in the content of the research; (ii) research incentives and performance evaluation criteria that rewarded them with more opportunities/resources to do more research; and (iii) cultural-administrative structures that enhances and reinforces autonomous motivation to do research - this is by way internalisation of these structures by the researchers. This is in contrast with researchers that look up for external stimulation such the one from their supervisors (Reeve 2012).
How do we measure quality of research productivity?
In their article titled: "When Knowledge Wins: Transcending the Sense and Nonsense of Academic Rankings'", Adler and Harzing (2009) posed a number of thought-proving questions, one of them reads: "Do our academic assessment systems reward scholarship that addresses the questions that matter most to society?" in other words, do the systems "count what really counts'"! There exists conundrum around the question of what/how to measure research; this is especially so when it comes to the decision between research productivity (e.g., the number of publications) or impact (e.g., citation counts) (Gendron 2015). On the question of how to measure, researchers agree that bibliometric database have done a good job. The three most commonly used bibliometric databases are Google Scholar, Scopus and Web of Science. All the three apply the following key metrics (Harzing 2013): (i) publications - the total number of publications per academic; (ii) citations - the number of citations per academic; and (iii) H-index - an academic with an index of h has published h papers each of which has been cited in other papers at least h times. On the question of what aspect to measure, two measures have been proposed in (Adler and Harzing 2009): (i) quantity - the total number of publications or other forms of research outputs; and (ii) quality - measured using subjective parameters such as publication in a journal that is led by a highly respected editorial board.
DHET Research Outputs and Subsidy Policy
DHET was established in 2009 (RSA Presidency 2009) with the sole mandate of managing post-secondary education institutions such as universities and Technical, Vocational Education and Training (TVET) colleges and South African Qualifications Authority (SAQA) (DHET 2013). Apart from coordinating research, DHET is the vehicle through which the government funds post-secondary education institutions; for this, grants schemes such as National Student Financial Aid Scheme (NSFAS), Actual Teaching/Research Inputs and Teaching/Development have been put in place (DHET 2013); (DHET 2014a). For the Actual Research Outputs Block Grants, DHET provides subsidy to universities for all accredited (by DHET) journal articles, books and conference papers published. For instance, out of the 40-billion rand allocated during the 2016/2017 financial year budget, DHET allocated over 3 billion to Actual Research Outputs Block Grants (DHET 2014b). The actual outputs funded are weighted as 1 unit for publication, 1 unit for research masters graduates and 3 units for doctoral graduates.
In order to manage the process of allocating Research Outputs Block Grants, DHET introduced the Policy for the Measurement of Research Outputs of Public Higher Education Institutions (2003). This has since been replaced with the DHET's Research Outputs Policy of 2015, published in the Government Gazette on 11 March 2015. This Policy took effective from 1 January 2016, and was applied to the 2016 research outputs that were evaluated in 2017 and onwards. The key highlights for the updated policy are:
1. Rewarding quality research output - not all research outputs are awarded, only those that are identified by DHET. For this reason, the Policy stipulates the criteria used in recognising published in journals, books and conference proceedings.
2. The quality above is measured through peer review process followed for each outputs. DHET currently relies on evaluation of the pre-publication refereeing or evaluation of complete manuscripts by independent experts. The Policy states the possibility of adopting bibliometric data, discipline specific panels of experts and post-publication reviews to determine quality in future.
3. No subsidies are paid for outputs from commissioned research.
4. Outputs are not differentiated on basis such as national or international journal outlets.
In general, the policy aims at stimulating research by offering monetary incentives to increase research outputs for the benefit of the Country. In order to ensure that the quality of the research outputs is competitive with research from other countries, DHET has delegated the Academy of Science of South Africa (ASSAf) as the external reviewer to determine quality research outputs. This process involves, two approaches: expert opinion and citation analysis (Pouris and Pouris 2015).
In allocating the research funds, a rigorous evaluation process is carried out each year, leading to a list of DHET approved journals, which is then distributed to universities. Research subsidy to universities is then determined based on the number of publications in these journals and further on proportional contribution of authors from the University. For example, given that the ACM Journal on Emerging Technologies in Computing Systems was recognised in the 2018 list of DHET approved journals (DHET 2018a), should author A, from University X publish an article in this journal, University X will receive 1 subsidy unit. If, however there were 2 other authors involved in this article; say author B from University Y and author C from University Z, all the 3 universities will receive a third of subsidy unit. This is one of the problems with the DHET research subsidy system; it penalizes collaborative research and tends to focus too much on quantity of publications and less on quality. Some authors (Pouris and Pouris 2015; Harley et al. 2016) have raised concerns that if this is not checked, it may result in non-professional practices where researchers will focus on the single agenda of maximizing the subsidy units. Apart from subsidies from journal articles, authorship in books and in conference proceedings is also considered for subsidy. According to the policy (DHET 2015a), 1 subsidy unit is granted for a journal article and 0.5 unit for a paper published in conference proceedings. Subsidies from books are computed based on the number of pages, for example, two units are awarded for a book of between 60 to 90 pages. According to DHET (DHET 2015b), most (over 85%) research outputs are in form of journal articles.
Differentiated funding for Universities and for UoTs
In calculating the normative weighted component of the research subsidy, the type of university category plays a great role. For instance, the institution's total of permanently appointed instruction/research staff for the year under consideration is factored in. Further, a set of benchmarks which are approved on a three-year rolling basis (by the Minister of Education) for the university is considered. The ratios of weighted publication units to permanently appointed instruction/research staff: 2016/17 to 2017/18 are 1.25 for universities and 0.5 for Technikons.
Statistics show that that the pattern of research funds subsidy distribution among the universities in South Africa reflects the universities classification; these are: (1) (Traditional) Universities that offer basic formative degrees such as BA & BSc, and professional undergraduate degrees such as BScEng and MBChB.; at postgraduate level, they offer Honours degrees, and range of masters and doctoral degrees; (2) Universities of technology (UoTs) that were mainly established to offer vocational or career-focused undergraduate diplomas, and BTech which serves as a capping qualification for diploma graduates. The UoTs also offer limited number of masters and doctoral programmes; and thirdly (3) Comprehensive universities that are supposed to offer programmes typical of university as well as programmes typical of university of technology (Bunting and Cloete 2010). After the recent addition of three new universities (Sol Plaatje University (SPU), the University of Mpumalanga (UMP), and Sefako Makgatho Health Sciences University), the Country now has 26 universities: 12 traditional, six comprehensives and eight UoTs (DHET 2018b).
The traditional universities have far more resources that the comprehensive ones while most of the UoTs, apart from having been established much later, they have the least resources - especially human capital. This partially explains the sharp differences in terms of the research funds distribution. For example, in terms of both publication outputs and postgraduate graduates, six traditional universities (the universities of Johannesburg, Pretoria, Stellenbosch, Cape Town, Witwatersrand and KwaZulu-Natal) took up 55 per cent of the outputs while the remaining share the remaining 45 per cent (Lobel 2017). As shown in Figure 1, most UoTs were left to scramble for the research development grant aspect of the funding because they could not meet their targets.
DATA AND METHODS
Introduction
Exploratory/discovery case study (Zainal 2007) method was applied in this research. The case study was based on one of the Central University of Technology, Free State (CUT); one of Universities of Technology (UoTs) in South Africa (Mtshali and Sooryamoorthy 2018; Lobel 2017; Pinheiro, Langa, and Pausits 2015). The main data collection instrument used was a questionnaire administered online via Survey Monkey. The questionnaire sought to collect data that could be used to: (i) identify the factors that stimulated staff members' research activities;
(ii) assess what was considered appropriate way of measuring research productivity; and
(iii) identify appropriate research awards, recognition and rewards.
Questionnaire design and data collection
The questionnaire was structured to represent all the elements of a research incentive system as shown in Figure 2. For easier preliminary and automated data analysis, Survey Monkey online questionnaire tool was used. In order to minimize the chances of sampling, data collection and data processing errors, the questionnaire was first piloted using five staff members from the selected UoT. Although the questionnaire was administered to the entire population of the academic staff members at CUT, the one hundred and one respondents resulted in a representative random stratified sample (Bryman et al. 2014) of the entire population. Further, theoretical sampling (Coyne 1997; Draucker et al. 2007) was used to identify 30 researchers whose 4-year publication record was used in evaluating the designed research incentive framework. For this group, qualitative analysis of the incentives thus earned and publications on the two main bibliometric databases (Google Scholar and Web of Science) was carried out.
Data sampling
The entire population of 315 of full-time academic and research staff members was considered; this therefore formed the population for this research. Given that not all the 101 staff members who filled the questionnaire are involved in research; non-probabilistic sampling was adopted in targeting 30 of those that are actively involved in research. In selecting the 30, the frequency of the researchers' names in DHET's research submission Ms Excel files for the UoT's 20142017 was the main criteria used. This equates to purposeful sampling as described in research (Denrell and Kovács 2008; Green 2016). Although the responses to the online questionnaire were random, the resulting pattern of these responses matched the targeted stratified sample.
Data analysis methods
In analysing the data from the questionnaire, Statistical Package for the Social Sciences (SPSS) for Macintosh (Green 2016) was extensively used to carry out the following: (i) data reliability tests; (ii) correlation analysis; (iii) statistical significance determination and factor analysis. Factor Rotation (using Varimax) was applied in finding solutions for which each variable has only a small number of large loadings, i.e., is affected by a small number of factors, preferably only one. In order to determine the statistical significance of the components (and their constituting dimensions), both chi-square tests and correlations coefficient were used. Further, the values of mean, standard deviation, median and sum values were computed from the weights associated with the Likert scale of the questionnaire questions. Components and/or dimensions with values below the median were discarded as they did not represent what an "average" respondent might think, or the "likeliest" response (Bryman et al. 2014).
RESULTS AND DISCUSSION
Research performance aspects
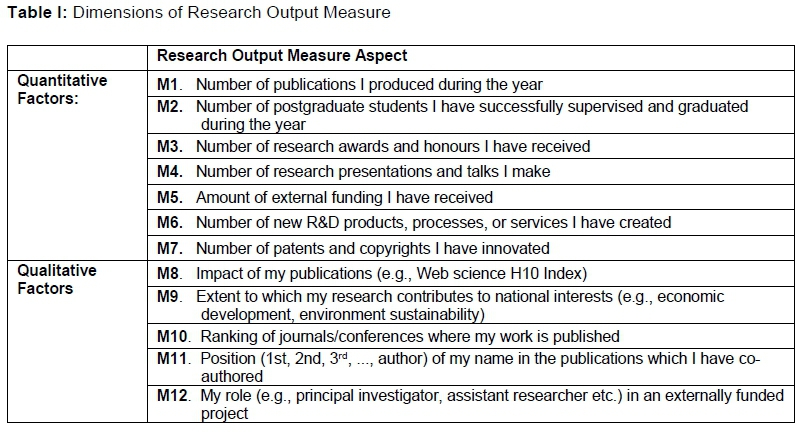
Based on the questionnaire administered, the acceptability of the 12 aspects of research performance was assessed using a 5-likert scale (Gliem and Gliem 2003). Seven of these aspects were of quantitative-nature (e.g., number of publications) and the remaining 5 were qualitative in nature. Correlation analysis (using Pearson Correlation) on the 12 aspects revealed significant correlation for all of the aspects - all of them had a significant (2-tailed) of below 0.01 (Green 2016). The measures' aspects/dimensions are shown in Table 1.
Existing research incentive system
In order to exhaustively assess the appropriateness of the existing research incentive system in its efficacy to stimulate individual researcher's activities, each of the 48 components of the System was assessed through a 5-likert scale. The respondents were asked to choose from "Strongly Agree", "Agree", "Disagree" and "Strong Disagree". These were translated to integer values of 4, 3, 2 and 1 respectively. A neutral option (equivalent to value 0) was provided for the aspects that did not apply to the respondent. This option was also meant to cater for cases where the respondents, for one reason or another, was not aware of existence of the particular component of the incentive system. Some of the 48 components are presented in Table 2.
Reliability testing results
There were 89 responses (12 of the 101 respondents skipped this section) for the "Research Measurements" section of the questionnaire. The 89 passed the reliability test and were included in the processing. The 12 aspects of research incentive measure returned a Cronbach's Alpha value of 0.938. Results of Correlation Measure on the individual measures returned high levels of correlation with the least (M4) measure having a value of 0.495 and the highest (M8) value of 0.8195.
On the other hand, there were 82 (19 of the 101 respondents skipped this section) responses to the section on the existing research incentive system. With a 100 per cent validity - all the 82 responses were included. The reliability of the 48 statements resulted in a very high reliability with Cronbach's Alpha value of 0.943. Reliability tests on the 9 individual categories was carried out and statements with weaker correlations eliminated. For example, Q3. was found to have very low correlation with the other Monetary aspects of the incentive system. Similarly, the significance for Q11indicated its tendency to be of "Affirmative Action" in nature.
Exploratory principal component analysis results
Both the quantitative and qualitative measures yielded only one component that explained 65.82 per cent and 64.75 per cent of the variance respectively. They also yielded acceptable KMO values of 0.821 and 0.813 respectively. For the Research Incentive System aspect of the data, except for one category ("Research Resources"), factor analysis also resulted in one component. The KMO values for the components were also way above the minimum (0.6) while the percentages explaining the variance ranged between 56 per cent and 66 per cent.
Further, the two components extracted under the Research Resources also had a high (0.764) KMO value and explained 62.43 per cent of the variance. Figure 3 shows the clustering of the statements around these two components. There is a clear separation between the two components. Statements associated with Component 2 (Q20, Q22 and Q23) are linked to access to the library, ICT infrastructure and conducive office space respectively. The others are associated with some form of funding. Incidentally, Q22, Q20 and Q25 are ranked number 1, 2 and 5 respectively, in terms of their significance. This is an indication of importance of a conducive research working environment in motivating researchers.
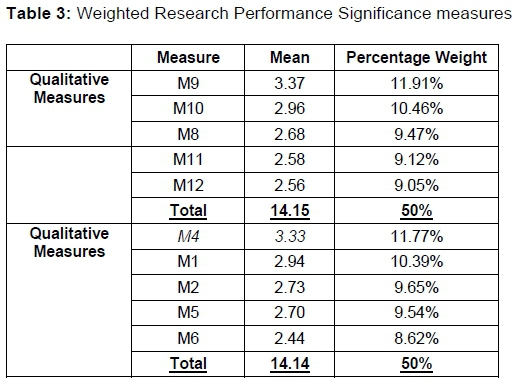
Results for significance of factors
Various data significance measures were generated using descriptive frequencies (see Table 3). The values for mean were then used to determine the significance of each measure/question in the categories/clusters. With a median of at least 3 and a mean of at least 2.5, nine of the twelve research performance measures were found to be significant. The top three measures are therefore qualitative. Table 3 shows the new weights of the various measures after eliminating the two (M7 and M3) less significant measures. The decision to retain M6 (despite having a mean of 2.44) was based on the fact that qualitative measure M9 (Extent to which my research contributes to national interests (e.g., economic development, environment sustainability) is actually a qualitative measure of M6 (Number of new R&D products, processes, or services I have created) and omitting the latter would invalidate M9 which coincidently is ranked the highest.
Computation of significance measures for the 48 aspects of the research incentive system was also carried out. The results revealed that, 30 out of the 48 measures were significant based on a mean of at least 2. It is evident from these results that the top 10 aspects relate to Research Resources and Collegiality aspects of the research system. At position 11, Q1 is the highest ranked monetary aspect of the incentive system. This points to the fact that money is not the main source of motivation for researchers (Towers 2012). All the aspects related to both Collegiality and Provision of Research Resources are ranked within the first 18 positions. The overall first position is taken by Q22 (I have/can access to the university's ICT Infrastructure that enables me to do research, e.g., internet connection, laptops and printers) while Q20 (I have/can access to online journals for which the university Library has subscribed, e.g., Science Direct) is the 2nd highest ranked.
Aspects related to Affirmative Action are ranked last with Q26 (I have received funding from the Next Generation Researchers Programme (for black women)) being at the bottom of the list. The poor significance for this category is related to three facts: (i) it applies to very few researchers; (ii) lack of awareness of its existence; and (iii) respondents who despite the fact that the aspects in this category did not apply to them, still went ahead and answered (instead of choosing the neutral answer). The second poorly ranked category is the one for Support for Postgraduate Students (under researchers' supervision). While the issues relating to Monetary category received average (at between 2.00 and 2.49) ranking, most (3 out of 5) of those under Awards and Recognition and those under Support for Research Collaboration received below average ranking. Eliminating all the aspects with a mean of less than 2.0 resulted in the rankings shown in Table 4.
RESEARCH INCENTIVE FRAMEWORK
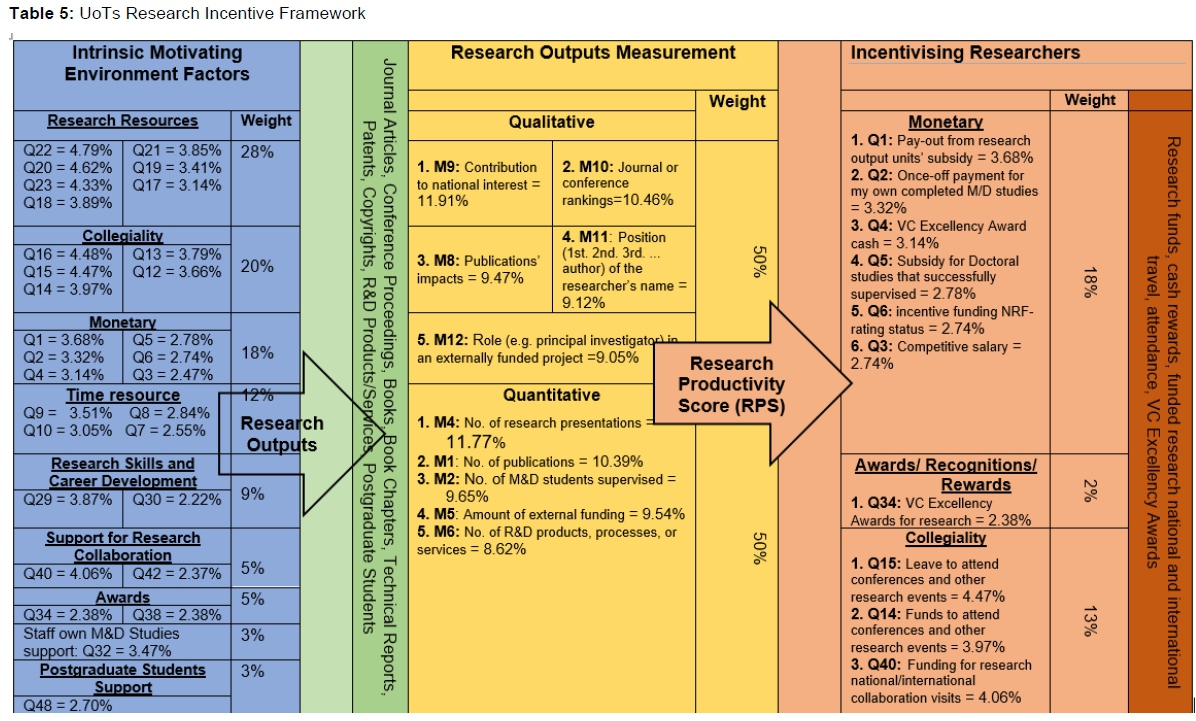
From the results discussed above, the framework for research motivation, research performance measurement and research award/recognition/reward shown in Table 5 was derived. The framework is based on weights of the elements in Tables 3 and 4. The elements in the left column are those with high potential in stimulating individual researchers' motivation to engage in research activities. The middle column contains the research productivity measurements aspects that were found to be appropriate while the right column contains the preferred research reward/award/recognition aspects. These columns represent the 3 elements of the framework described below.
Framework Component 1: Intrinsic motivating environment factors
The highest priority (a weight of 28%) is given to provision of adequate and appropriate resource resources. The sub-components of the research resources are further listed in order of priority; Q22 having the highest priority (4.79%) and Q17 having the lowest weight (3.14%) in this category. The second category is collegiality, the third is time resources and the last one is related to support for postgraduate students. The interpretation of the weights in each of these categories follows the same fashion as the one for provision of research resources. As explained earlier, the low correlation (with other aspects in "Research Skills and Career Development") of Q32 informed the decision to treat it separately. Further, the fact that it had high significance (with overall mean of 2.4 and ranked at number 14) meant that the researchers considered it key to their motivation to do research.
Framework Component 2: Research Productivity Score (RPS)
This section of the framework provides the answer to the question; "what aspects of research performance to measure: qualitative or quantitative?'" Data analysis revealed that the qualitative measures have the same weight (50%) as their quantitative counterpart. This is strong indication that although the qualitative measures are not currently explicitly considered at CUT and the Country (South Africa) at large (DHET 2015a).
Framework Component 3: Incentivising researchers
Once the weighted researcher's performance score is computed, the third component of the framework is the "Incentivising Researchers". In determining this, the aspects that entails some form of incentives are presented in the right column. In coming up with the incentives, the Collaboration aspect Q40 was grouped together with Collegiality factors. This therefore means that 33 per cent of research funds coming from research outputs' subsidies should be used in directly incentivising researchers. The distribution should be 18 per cent to monetary, 13 per cent to collegiality and 2 per cent to awards/recognitions/rewards - the rest (67%) should be ploughed back to enhancing an intrinsically motivating research environment.
Application of the incentive framework
In order to illustrate the application of components 2 (Research Outputs Measurement) of the Incentive Framework developed in this research, research output records of 30 researchers from CUT was used. These researchers' names appeared frequently in the DHET subsidy submissions from CUT. These researchers were also among the 37 who chose to provide their names and ticked "yes" on the section of the questionnaire that sought consent to mention respondents' names in the research findings.
The first step in applying the Incentive Framework is the computation of the Research Productivity Score (RPS). The Research Output Measures weights shown in the framework in Table 5 are applied in the expression below. When applying the Framework, the following should be put into consideration: (i) M9 is associated with M6; (ii) M10 is associated with both M4 and M1; (iii) M8 and M11 are both associated with M1; and (iv) M12 is associated with M5.
RPS = Oral Presentations (O) + Publications (P) + M&D students (D) + External Funding (F) + R&D products, processes, or services (R)
i. Oral presentations
In the case of researchers from South African UoTs (and indeed other universities in the Country), most oral presentations are related to results from the researchers' personal research. In most cases, these are from papers already submitted either for publications in conference proceedings or special issues of a journal. Including these in the RPS may therefore result in double-dipping (Pouris and Pouris 2015). However, some presentations may fall under the category of Guest Speakers or may be dissemination of high-level research in national or international forums that may not have conference proceedings or journal publication outlets. For the latter, the O contribution to the RPS should be computed using the expression below. In order to differentiate between various types of conference presentations, a "type of talk" measure is introduced - similar measures are adopted in the work by (Schroen et al. 2012).
O = 0.1177 (talk-type)
where talk-type = 0.1 for provincial, 0.2 for national, 0.3 for regional (e.g., Southern Africa) and 0.4 for international
ii.Publications
DHET differentiates 4 types of publications: journal articles, conference proceedings, book chapters and books. The weights currently applied are 1, 0.5, 1 for articles, proceedings and book chapters respectively. The criteria for books is based on number of pages in the book (DHET 2015b). The latter is not included in the expression below - given that only an insignificant number of CUT's annual DHET publications is composed of books, this omission does not affect the validity of the overall Framework described in this research. For instance, in 2016, only 1 unit (out of 117 research units produced from CUT used as the case study for this research) was from the books. This however may not necessarily apply to other UoTs and the expression below would need to be updated.
P = [(0.1039 X publication-type) + (0.1046 X JIF) + (0.0967 X publication-citations)
+ (0.0912 X author-role)]
* the values of the weights (0.1039, 0.1046 etc.) are extracted from the various percentages of the measures in Framework, e.g., 10.39% for Measure M1 and 10.46% for Measure M10where
publication -type = 1 for journal; 1 book chapter; 0.5 for proceedings author-role = 1 for 1st author; 0.5 for 2nd author; 0.25 for others JIF represents either the impact factor of the journal or ranking of the conference proceedings
Similar to the work presented in (Schroen et al. 2012), the publications that do not have impact factors are weighted at the lowest impact factor reported for that year.
iii.Postgraduate students supervision
The question of the level (B. Tech/Hons, Masters, Doctorate or Postdoc) of M&D student was not posed in the data collection tools, however, for completeness purposes, following weights are assigned 10 per cent, 20 per cent, 30 per cent and 40 per cent to B.Tech/Hons, Masters, Doctorate or Postdoc respectively.
D = 0.0965 X student-level
where student-level = 0.1 for Hons; 0.2 for masters; 0.3 for doctoral; and 0.4 for postdoctoral
iv.External research funds
In computing RPS contribution from external funding, the role (in applying and attracting the funding) of the researcher is factored in as follows:
F = 0.0954 X funding-role
where funding-role = 1 for Principal Investigator, 0.5 for Collaborator
v.R&D products, processes, or services
As mentioned earlier, this type of research outputs is rare in CUT. Further, the nature of these outputs can be subjective in terms of their qualitative measures such as commercialisation value and contribution to national interest. For example, if one researcher innovates a laser pen and another one innovates a new HIV-AIDS vaccine, just counting the quantity (a value of 1 in this case) of these is not objective enough. Further researcher and consultation are therefore required before the RPS contribution of this category is computed. From the findings of this research however, it is recommended that the aspect of "contribution to national interest" be pegged at 0.1191.
Illustration of RPS: Researchers 4-year publication records
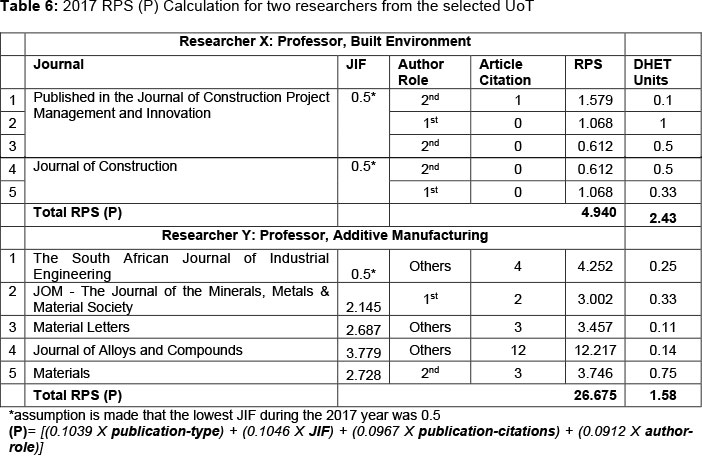
To illustrate RPS computation, the 2017 research output for two of the 30 researchers was considered. Researcher no. X was the best ranked in terms of DHET research subsidies received by CUT while Researcher Y had the highest H10 index on Google Scholar. In 2017, Researcher X produced 5 journal articles, 11 conference proceedings and 1 book chapter while Researcher Y produced 5 journal articles and 2 conference proceedings. The P (with only the journal articles) part of the RPS is therefore computed as follows:
The parameters used in the calculations in Table 6 were extracted as follows:
• publication-type - a value of 1 was used since these are journal articles
• JIF - the journal (where the articles were published) impact factor was retrieved from the journal's website. For the journals (e.g., Journal of Construction) without an impact factor, a value of 0.5 was assumed. In the actual application of the RPS(P) expression, the value should be determined based on the lowest ranked JIF journal in that year
• publication-citations - the number of citations on the article was extracted from Google Scholar
• Author-Role - this was retrieved from CUT's the DHET's research subsidy submission file for 2017
For comparison purposes, the column "DHET Units" shows the value of the Research Units (DHET 2015a) that were allocated to the researchers for each of the publication. Using the DHET formula, Researcher X received a total of 2.43 Outputs Units while Researcher Y received 1.58 units. The proposed RPS approach however awards much higher score (26.675) to Researcher Y - this researcher was "penalised" for collaboration (one of the articles has 7 authors - in which case 1 output unit is divided by 7) yet the articles have attracted more citations than those by researcher X. This may explain the huge differences in value of the two researchers Google Scholar H10-Indices: 5 and 40 for researcher X and Y respectively.
The other aspects of P (Conference Proceedings and Book Chapters) are calculated in the same fashion as the journal articles. The RPS expression presented earlier is then applied to calculate the final RPS that includes the values for O, R, D and F. This value is then used in determining the values for incentivising individual researchers.
CONCLUSION
Like other research funding agencies, DHET continues to grapple with the challenge of objectively measuring research productivity invested in the billions of research grants and subsidies given to public universities (Pouris and Pouris 2015; DHET 2015a; Harley et al. 2016). Given that the context and realities at the UoTs differ from those of the other types of universities (Bunting and Cloete 2010), research output measurement criteria applied by DHET should be different. Similarly, research incentives put in place at the individual UoTs' level should endeavour to enrich the research environment. Such incentives should seek to appeal to the researchers' intrinsic autonomous motivation to engage in research activities.
In the research presented in this paper, factors that researchers at one of the UoTs (CUT) considered important part of their intrinsic autonomous motivation were identified. A 9-deminsion research incentive system and a 2-dimension research measurement were used to collect data from 101 respondents. The results from performing factor analysis and statistical significance on this data were used in developing a 3-component research incentive framework. This Framework assigns equal weights to the quantity and quality aspects of research outputs. Further, the framework advocates for a research motivating environment that is capable of providing adequate research resources and supports for collegiality aspects. In as much as money is required in meeting these two needs, direct monetary incentive is not a top priority for the researchers.
Unlike the DHET (and other similar systems in use globally), Component 2 of the Framework presented here incorporates both qualitative and quantitative measures in calculating a Research Productivity Score (RPS) for 5 research output types: Oral Presentations (O), Publications (P), M&D students (D), External Funding (F) and R&D products, processes, or services (R). These are measured along 5 different qualitative measures: publication type, Journal Impact Factor (JIF), publication-citations, author-role, postgraduate student level, oral presentations type and role in external funding. Although most of these measures are not new, the inclusion of statistically derived weights for these as well inclusion of "publication-citations" (for the particular publication - not the journal) are unique to our Framework. Further, component 3 of the Framework provides a guideline for incentivising individual researchers based on their PRS values. The Framework apportions 33 per cent of research subsidies to the following incentives: 18 per cent for Monetary, 13 per cent to collegiality and 2 per cent to awards, recognition and rewards.
Using journal article publications for 2017 from the UoT studied, a clear demonstration of the superiority and applicability of the proposed framework has been documented. Two researchers from the extreme ends of the research outputs measurement spectrum were selected. While one consistently produced the highest number of DHET research outputs units for 3-years, the second one has the highest Google Scholar H10-Index and is also a host of one the South African Research Chairs Initiative (SARChI). The ability of our Framework to objectively assess these two research outputs confirms its ability to "count what counts" and prove the statement that "not everything that can be counted counts'".
It is recommended that the Framework be implemented in the case study UoT. In order to ensure and assess the success of this implementation, the Framework should be anchored within the human resource strategy (Fisher 2008) of the UoT and monitoring and evaluation mechanism be put in place. Further work should be carried out in terms of adapting the framework for other categories of South African universities (comprehensive and traditional) (Bunting and Cloete 2010). Given the distinct differences between UoTs and these universities, the results of this adoption could be an interesting unfolding.
REFERENCES
Adler, Nancy J. and Anne Wil Harzing. 2009. "When Knowledge Wins: Transcending the Sense and Nonsense of Academic Rankings." Academy of Management Learning and Education. https://doi.org/10.5465/AMLE.2009.37012181. [ Links ]
Andersen, Lotte Bogh and Thomas Pallesen. 2008. "'Not Just for the Money?' How Financial Incentives Affect the Number of Publications at Danish Research Institutions." International Public Management Journal 11(1): 28-47. https://doi.org/10.1080/10967490801887889. [ Links ]
Bryman, A., E. Bell, P. Hirschsohn, A. dos Santos, J. du Toit, and A. Masenge. 2014. Research Methodology: Business and Management Contexts. Oxford University Press. https://doi.org/10.1016/S0048-7333(02)00072-0. [ Links ]
Bunting, Ian and Nico Cloete. 2010. Institutional Types in Higher Education in South Africa. Pretoria. https://doi.org/10.1080/07366981.2014.869962. [ Links ]
Carr, K. A. 2009. "Firms Find That Nonmonetary Rewards Count, Crain's Cleveland Business." Regional Business News 30(42). [ Links ]
Coyne, Imelda T. 1997. "Sampling in Qualitative Research. Purposeful and Theoretical Sampling; Merging or Clear Boundaries?" Journal of Advanced Nursing. https://doi.org/10.1046/j.1365-2648.1997.t01-25-00999.x. [ Links ]
Denrell, Jerker and Balázs Kovács. 2008. "Selective Sampling of Empirical Settings in Organizational Studies." Administrative Science Quarterly. https://doi.org/10.2189/asqu.53.L109. [ Links ]
Derrick, Gemma E. and Chris Bryant. 2013. "The Role of Research Incentives in Medical Research Organisations." R and D Management 43(1): 75-86. https://doi.org/10.1111/radm.12001. [ Links ]
Department of Higher Education and Training. 2013. Report of the Ministerial Committee for the Review of the Funding of Universities. Pretoria. www.dhet.gov.za. [ Links ]
Department of Higher Education and Training. 2014a. DHET Research Agenda: 2014-2017. Pretoria. www.dhet.gov.za. [ Links ]
Department of Higher Education and Training. 2014b. "Ministerial Statement on University Funding: 2015/16 and 2016/17." Pretoria. www.dhet.gov.za. [ Links ]
Department of Higher Education and Training. 2015a. Report on The Evaluation of the 2013 Universities' Research Outputs. Pretoria. http://www.dhet.gov.za. [ Links ]
Department of Higher Education and Training. 2015b. "Research Output Policy (2015). Directorate: University Policy and Development Support." Communique 2 of 2015 - August 2015, Vol. 597 11 March 2015, No. 38552. Pretoria. [ Links ]
Department of Higher Education and Training. 2017. Report on the Evaluation of the 2015 Universities' Research Output. Pretoria. http://www.dhet.gov.za. [ Links ]
Department of Higher Education and Training. 2018a - "DHET accredited journals 2018". Pretoria. https://www.dhet.gov.za/SitePages/UniversityEducation.aspx. [ Links ]
Department of Higher Education and Training. 2018b. Department of Higher Education and Training Annual Report 2016/17. Volume 5. Pretoria. http://www.dhet.gov.za [ Links ]
DHET see Department of Higher Education and Training.
Draucker, Claire B., Donna S. Martsolf, Ratchneewan Ross, and Thomas B. Rusk. 2007. "Pearls, Pith, and Provocation Theoretical Sampling and Category Development in Grounded Theory." Qualitative Health Research 17(8): 1137-48. https://doi.org/10.1177/1049732307308450. [ Links ]
Fisher, J. G. 2008. How to Run Successful Employee Incentive Schemes: Creating Effective Programmes for Improved Performance. Vol. 3. London, Great Britain. [ Links ]
Frey, B. and S. Neckermann. 2008. "Awards: A View from Psychological Economics." Journal of Psychology 216: 198-208. [ Links ]
Gendron, Yves. 2015. "Accounting Academia and the Threat of the Paying-off Mentality." Critical Perspectives on Accounting 26: 168-76. https://doi.org/10.1016/j.cpa.2013.06.004. [ Links ]
Gliem, Rosemary R. and Joseph A. Gliem. 2003. "Calculating, Interpreting, and Reporting Cronbach's Alpha Reliability Coefficient for Likert-Type Scales." In Midwest Research-to-Practice Conference in Adult, Continuing, and Community Education. https://doi.org/10.1109/PROC.1975.9792. [ Links ]
Green, Samuel B. 2016. Using SPSS for Windows and Macintosh: Analyzing and Understanding Data:Using SPSS for Windows and Macintosh: Analyzing and Understanding Data. American Statistician. https://doi.org/10.1198/tas.2005.s139. [ Links ]
Harley, Yolande X., Esmari Huysamen, Carlette Hlungwani, and Tania Douglas. 2016. "Does the DHET Research Output Subsidy Model Penalise High-Citation Publication? A Case Study." South African Journal of Science 112(5/6): 3 Pages. https://doi.org/10.17159/sajs.2016/20150352. [ Links ]
Harzing, Anne Wil. 2013. "A Preliminary Test of Google Scholar as a Source for Citation Data: A Longitudinal Study of Nobel Prize Winners." Scientometrics 94(3): 1057-1075. https://doi.org/10.1007/s11192-012-0777-7. [ Links ]
Humphrey, Christopher and Yves Gendron. 2015. "What Is Going on? The Sustainability of Accounting Academia." Critical Perspectives on Accounting 26: 47-66. https://doi.org/10.1016/j.cpa.2014.09.008. [ Links ]
Larkin, I., L. Pierce, and F. Gino. 2012. "The Psychological Costs of Pay for Compensation of Employees." Strategic Management Journal 33: 1194-1214. [ Links ]
Lobel, Jules. 2017. Chapter 4: Financing Research in Higher Education, 47-58. https://doi.org/10.1520/MNL10373M. [ Links ]
Mtshali, Mduduzi Nkosinathi Gladwin and Radhamany Sooryamoorthy. 2018. "A Research-Inducing Environment at a University of Technology in South Africa: Challenges and Future Prospects." Futures June: 0-1. https://doi.org/10.1016/j.futures.2018.06.017. [ Links ]
Pinheiro, Rómulo, Patricio V. Langa, and Attila Pausits. 2015. "One and Two Equals Three? The Third Mission of Higher Education Institutions." European Journal of Higher Education. https://doi.org/10.1080/21568235.2015.1044552. [ Links ]
Pouris, Androniki E. M. and Anastassios Pouris. 2015. "An Assessment of South Africa's Research Journals: Impact Factors, Eigenfactors and Structure of Editorial Boards." South African Journal of Science 111(3-4): 1-8. https://doi.org/10.17159/sajs.2015/20130358. [ Links ]
Reeve, Johnmarshall. 2012. "A Self-Determination Theory Perspective on Student Engagement." In Handbook of Research on Student Engagement, 149-72. Boston, MA. https://doi.org/10.1007/978-1-4614-2018-7_7. [ Links ]
RSA Presidency. 2009. "Medium Term Strategic Framework (MTSF): A Framework to Guide Government"s Programme in the Electoral Mandate Period (2009 to 2014)." Pretoria. http://www.thepresidency.gov.za/docs/pcsa/planning/mtsf_july09.pdf. [ Links ]
Ryan, Richard M. and Edward L. Deci. 2000. "Self-Determination Theory and the Facilitation of Intrinsic Motivation, Social Development, and Well-Being." American Psychologist. https://doi.org/10.1037/0003-066X.55.L68. [ Links ]
Schroen, Anneke T., Monika J. Thielen, Florence E. Turrentine, Irving L. Kron, and Craig L. Slingluff. 2012. "Research Incentive Program for Clinical Surgical Faculty Associated with Increases in Research Productivity." The Journal of Thoracic and Cardiovascular Surgery 144(5): 1003-1009. https://doi.org/10.1016/jjtcvs.2012.07.033. [ Links ]
Stoyanov, Stoyan. 2017. A Theory of Human Motivation. https://doi.org/10.4324/9781912282517. [ Links ]
Sutton, Nicole C. and David A. Brown. 2016. "The Illusion of No Control: Management Control Systems Facilitating Autonomous Motivation in University Research." Accounting and Finance.https://doi.org/10.1111/acfi.12099. [ Links ]
Towers, Watson. 2012. "Companies That Successfully Retain Top Talent in M&As Start Early, Use Monetary and Nonmonetary Tactics, Towers Watson Survey Finds." June 2012. [ Links ]
Zainal, Zaidah. 2007. "Case Study as a Research Method Zaidah." Jurnal Kemanusiaan Bil.9.https://doi.org/10.1177/152342230204300. [ Links ]

